FEDS Notes
April 19, 2024
Inequality and financial sector vulnerabilities
Anni T. Isojaervi and Sam Jerow1
Overview
In recent decades, income and wealth inequality have risen notably in the United States and other countries around the world. Importantly, such rises in inequality have been shown to predict financial crises.2 However, the mechanisms through which inequality may matter for financial stability are not fully understood. While recent literature has linked higher income inequality to increases in household borrowing and higher wealth inequality to both lower equity premium and higher equity valuations relative to gross domestic product (GDP), there could be other channels through which inequality may impact financial stability.
The purpose of this note is to take first steps toward a broader understanding of the potential channels through which inequality may affect financial stability. Using predictive regressions, we conduct a broad analysis to establish stylized facts about the relationship between income inequality and financial sector vulnerabilities. We consider a large set of vulnerabilities from the four categories monitored in the Board's Financial Stability Report: nonfinancial leverage, asset valuations, financial leverage, and funding risk. Our analysis reaffirms findings in the literature determined through an extensive review, such as inequality increasing household leverage and equity valuations relative to GDP. Relative to the existing literature, we also have several novel findings. First, we find that an increase in income inequality is associated with an increase in corporate bond debt relative to GDP. Second, we find that a rise in income inequality is associated with an increase in the ratio of assets to GDP for mutual funds and life insurers. Lastly, we find that an increase in income inequality is positively correlated with the prevalence of nonbank short-term wholesale funding in the financial system.
We also provide intuition for our results: Household finance literature has noted that, compared with low-income households, high-income households save a higher share of their income and allocate a higher fraction of their savings toward riskier assets. Thus, higher inequality increases the stock of savings and demand for riskier assets, which can explain why inequality is positively related to nonbank sector size and debt as well as higher valuations of riskier assets relative to GDP. In addition, higher savings of the rich have also been shown to increase dissaving of both the rest of the households and the government through a higher supply of credit, linking this same mechanism to overborrowing of lower-income households (Mian et al., 2020).
While we do not attempt to make causal claims, we argue that inequality may exacerbate vulnerabilities that have been shown to propagate shocks in the financial system and worsen real outcomes. A better understanding of these linkages and mechanisms would thus be granted.3
Methodology
U.S. data show that both wealth and income inequality have increased notably over the last 40 years. For example, the top 1 percent income share, measuring the share of total income earned by the 99th percentile of the income distribution, has increased from 10 percent in 1980 to 19 percent in 2020 (Figure 1).
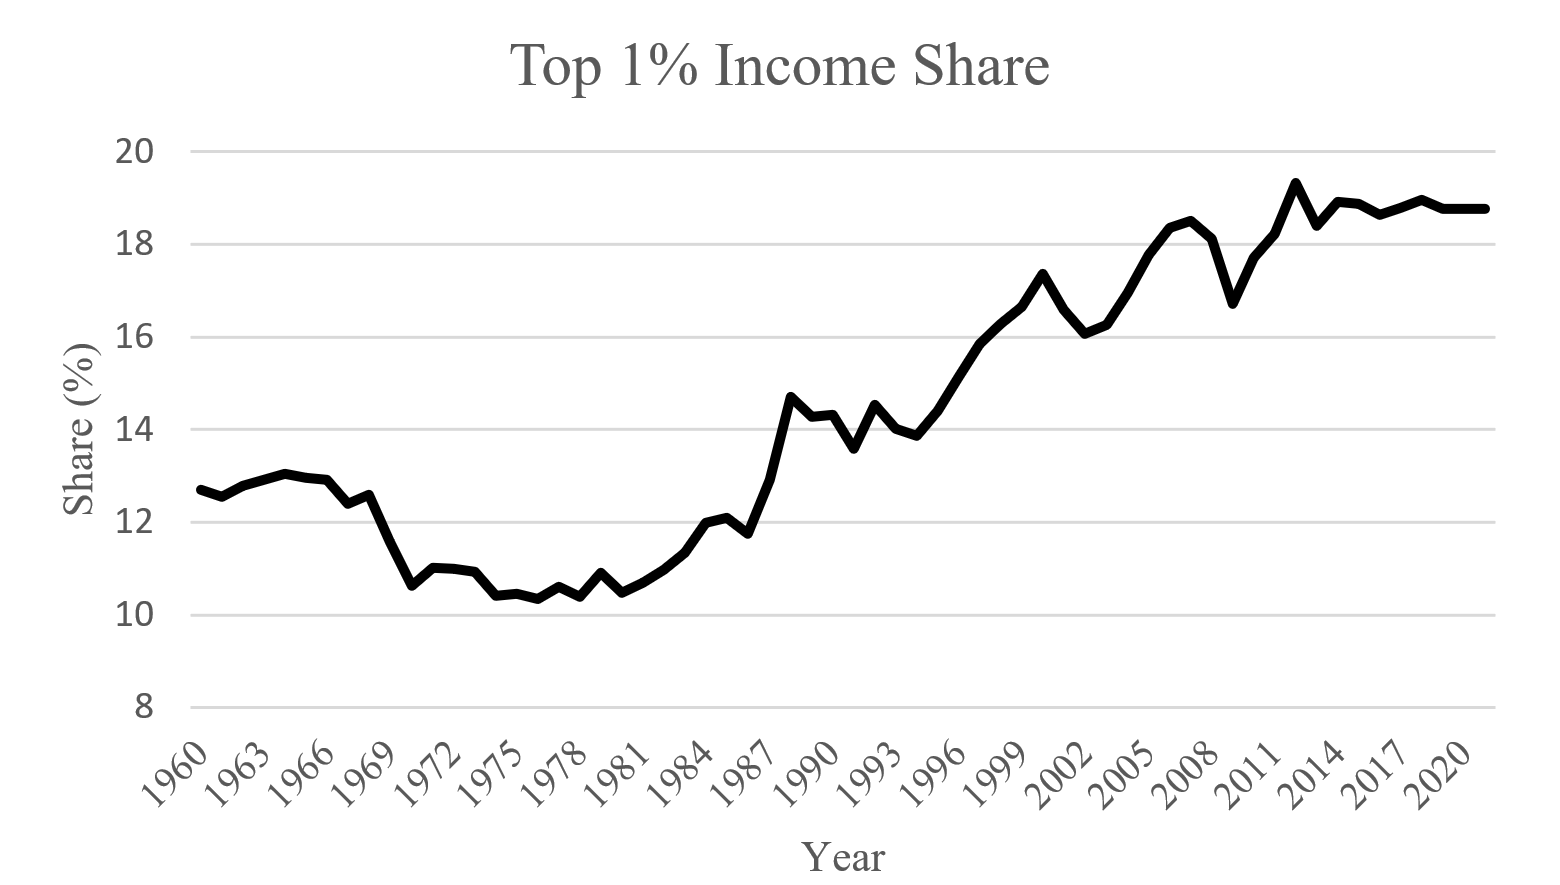
Note: We use pretax income share data based on Piketty et al. (2018) as our income inequality measure. The share excludes capital gains. Income shares measure how large of a portion of total income is earned by a given percentile of the income distribution.
Source: The World Inequality Database.
Using annual U.S. data from 1964 to 2019, we examine the impact of changes in inequality, measured as the top 1 percent income share, on various measures of financial sector vulnerabilities via the following predictive regression model:
$$\Delta_{1}FS_{t+1} = \alpha + \beta\times\Delta_{4}ineq_{t} + \gamma\times\Delta_{4}X_{t}+\epsilon_{t}$$
where $$\Delta_{1}FS_{t+1}$$ measures a one-year change in a vulnerability measure of interest at time $$t+1$$.4 We assume that each vulnerability measure is a function of a constant $$\alpha$$, a four-year change in inequality5, $$\Delta_{4}ineq_{t}$$, and a change in the vector of controls, $$\Delta_{4}X_{t}$$ from $$t-4$$.6
Review of Existing Findings
We conducted broad analysis on inequality and financial sector vulnerabilities by investigating different measures of inequality and covering the four main categories of vulnerability monitored in the Financial Stability Report. We list all investigated vulnerability measures in Table 1, and our choice of the measures was determined by the availability of long-enough time series.
Table 1. Vulnerability measures
| Vulnerability Category | Variable | Transformation | Source |
|---|---|---|---|
| Nonfinancial Leverage | Total nonfinancial* | Log Diff. | Financial Accounts of the U.S. |
| Household* | Log Diff. | Financial Accounts of the U.S. | |
| Household mortgage* | Log Diff. | Financial Accounts of the U.S. | |
| Household consumer | Log Diff. | Financial Accounts of the U.S. | |
| Nonfinancial business | Log Diff. | Financial Accounts of the U.S. | |
| Nonfinancial noncorporate business | Log Diff. | Financial Accounts of the U.S. | |
| Nonfinancial corporate business | Log Diff. | Financial Accounts of the U.S. | |
| Commercial paper | Log Diff. | Financial Accounts of the U.S. | |
| Bank loans | Log Diff. | Financial Accounts of the U.S. | |
| Mortgages | Log Diff. | Financial Accounts of the U.S. | |
| Corporate bonds* | Log Diff. | Financial Accounts of the U.S. | |
| Asset Valuations | Equity premium | Difference | Jordà et al. (2019) |
| Housing capital gains | Difference | Jordà et al. (2019) | |
| Equity valuations* | Log Diff. | Financial Accounts of the U.S. | |
| Residential real estate valuations | Log Diff. | Financial Accounts of the U.S. | |
| Commercial real estate valuations | Log Diff. | Financial Accounts of the U.S. | |
| Treasury market valuations | Log Diff. | Financial Accounts of the U.S. | |
| Financial Leverage | Bank leverage* | Log Diff. | Jordà (2021) |
| Broker-dealer leverage | Log Diff. | Financial Accounts of the U.S. | |
| Mutual fund assets-to-GDP* | Log Diff. | Financial Accounts of the U.S. | |
| Insurer assets-to-GDP* | Log Diff. | Financial Accounts of the U.S. | |
| Property and casualty insurer | Log Diff. | Financial Accounts of the U.S. | |
| Life insurer* | Log Diff. | Financial Accounts of the U.S. | |
| Agency securitization | Log Diff. | Financial Accounts of the U.S. | |
| Funding Risk | Bank loans-to-deposits | Log Diff. | Jordà (2021) |
| Bank noncore funding | Log Diff. | Jordà (2021) | |
| Nonbank short-term wholesale funding* | Log Diff. | Financial Accounts of the U.S. | |
| Financial sector liabilities-to-GDP | Log Diff. | Financial Accounts of the U.S. |
Note: We denote series that have a statistically significant relationship, at least at the 10 percent level, with either income or wealth inequality with (*). Throughout the analysis, we rely on standard errors that are robust to heteroskedasticity and autocorrelation. Income inequality is defined as the four-year change in the top 1 percent income share, and wealth inequality is defined as the one-year change in the top 1 percent wealth share. All results include a full set of controls. The nonfinancial leverage results include the following controls: changes in the short-term interest rate, log growth in the investment-to-output ratio, log growth in the money supply-to-output ratio, and log growth of GDP. The asset valuations (excluding equity premium and housing capital gains), financial leverage, and funding risk results include the following controls: log growth of GDP, log growth in PCE inflation, log growth in bank assets, and log growth in the share of the population aged 55 or older. The equity premium and housing capital gains results include the following controls: log growth of GDP, log growth in the price-to-dividends ratio, log growth in the price-to-earnings ratio, and log growth in the consumption-to-wealth ratio. GDP is defined as nominal gross domestic product from the U.S. Bureau of Economic Analysis, National Income and Product Accounts (Quarterly). The following series are defined as in Aikman et al. (2017): broker-dealer leverage, nonbank short-term wholesale funding, and financial sector liabilities.
We focus on describing statistically significant results.7 Beyond the novel results presented in the next section of this note, we also confirm some results from earlier literature on the connections between inequality and financial sector vulnerabilities. Earlier research has linked income inequality to higher household leverage and wealth inequality to both higher equity valuations relative to GDP and lower equity premia.8 We can confirm the results for household leverage and equity valuations, while we do not find a statistically significant relationship between wealth inequality and equity premium.9 Earlier literature has also found evidence on income inequality lowering future housing price growth, but we are not able to confirm that in our data (Määttänen and Terviö, 2014; Hailemariam et al., 2021; Berisha et al., 2022).
The existing literature on inequality and financial sector vulnerabilities has focused on the connection between income inequality and household leverage, as the Global Financial Crisis (GFC) was preceded by rapid increases in both. A prevalent hypothesis in the literature is that higher inequality led to an excess of borrowing by low-income households prior to the GFC, which then led to a financial crisis via higher default rates of households (Kumhof et al., 2015; Rajan, 2011). The findings in the literature point to a positive relationship between inequality and household leverage.
We assess the relationship in the U.S. data by considering the effect of income inequality on household leverage. Our results confirm the previous results and show that a 1 percent increase in the top 1 percent income share increases the household debt-to-GDP ratio by 0.111 percent, a strong and significant result (Table 2). We further break down household leverage to mortgages and consumer credit and find that the effect of inequality on household leverage runs through mortgage debt. These findings indicate that income inequality can contribute to higher financial fragility via higher household indebtedness.
Table 2. Income and wealth inequality and household leverage, asset prices
| Vulnerability Measure | Coefficient | T-Statistic |
|---|---|---|
| Household Leverage | 0.111** | 3.406 |
| Household Leverage: Mortgage | 0.151** | 4.021 |
| Household Leverage: Consumer | 0.014 | 0.234 |
| Equity Premium | -1.428 | 0.782 |
| Equity Valuations | 1.038* | 1.896 |
| Housing Capital Gains | -0.196 | 0.795 |
Note: The first three rows of this table show regression coefficients for each vulnerability measure and the four-year change in income inequality. The last three rows show the regression coefficients for each vulnerability measure and the one-year change in wealth inequality. We use annual U.S. data from 1964 to 2019. The total equity returns are defined as $$r_{t+1} = \frac{p_{t+1} + d_{t+1}}{p_{t}} - 1$$, where $$p_{t}$$ is the equity price at time $$t$$ and $$d_{t}$$ are the dividends paid at time $$t$$. Our measure of the equity premium is the difference between the total equity returns and the risk free (T-bill) rate. The housing capital gains are measured as $$r_{t+1} = \frac{p_{t+1}}{p_{t}} - 1$$, where $$p_{t}$$ is the housing price at time $$t$$. All specifications include control variables. For the first three rows the controls are four-year GDP growth, four-year PCE inflation, four-year growth in the investment-to-output ratio, and four-year growth in the money supply-to-output ratio. For equity premium and housing capital gains, the controls are one-year growth in GDP, one-year growth in the price-to-dividends ratio, one-year growth in the price-to-earnings ratio, and one-year growth in the consumption-to-wealth ratio. For equity valuations, the controls are: one-year growth of GDP, one-year growth in PCE inflation, one-year growth in bank assets, and one-year growth in the share of the population aged 55 or older. * signifies significance at the 10 percent level, ** at the 5 percent level, and *** at the 1 percent level. Standard errors are robust to heteroskedasticity and autocorrelation.
Source: For the income and wealth shares, the World Inequality Database; for housing capital gains, equity returns, T-bill rate, GDP growth, PCE inflation, the investment-to-output ratio, and the money supply-to-output ratio, the Macrohistory Database (Jordà et al. 2017; Jordà et al. 2019); for bank assets, Federal Reserve Board, Statistical Release Z.1., "Financial Accounts of the United States"; for the share of the population aged 55 or older, the Bureau of Labor Statistics; for the price-to-dividends ratio, the price-to-earnings ratio, and the consumption-to-wealth ratio, Welch and Goyal (2008).
Recent literature has associated higher wealth inequality with upward valuation pressures of equity and a long-term decline in the equity premium in the United States and other countries. As wealthier households hold more stocks and other riskier assets—either because of a higher risk tolerance or more optimistic views about future dividends—the top 1 percent wealth share negatively predicts future excess stock market returns (Toda and Walsh, 2020). We consider the effect of a one-year change in the top 1 percent wealth share on the equity premium. While we also find a negative point estimate for the inequality measure, our result is not statistically significant (Table 2). We also consider the effect of one-year changes in the top 1 percent wealth share on equity valuations relative to GDP and find that a 1 percent increase in the top 1 percent wealth share predicts a 1.038 percent increase in equity valuations, consistent with the findings in the literature (Table 2).
Novel Results
We first consider the effect of income inequality growth on nonfinancial business leverage. The full results are shown in Table 3. We find evidence that the four-year change in income inequality is positively associated with nonfinancial business leverage. In particular, we find that there is a strong and statistically significant relationship between corporate bonds and income inequality: A 1 percent increase in the top 1 percent income share predicts a 0.166 percent increase in the ratio of corporate bond debt to GDP. To put this result into an economic magnitude, this increase is about 13 percent of the average annual growth in the ratio over our sample period. Business leverage has been flagged as a financial stability concern in recent years, and our analysis shows that income inequality can exacerbate this vulnerability. When looking at other components that make up nonfinancial corporate business leverage, or aggregate business leverage measures, we do not find a statistically significant relationship between income inequality and business leverage.
Table 3. Income inequality and nonfinancial business leverage
| Vulnerability Measure | Coefficient | T-Statistic |
|---|---|---|
| Nonfinancial Business Leverage | 0.058 | 0.867 |
| Nonfinancial Corporate Business Leverage | 0.089 | 1.279 |
| Nonfinancial Noncorporate Business Leverage | 0.002 | 0.019 |
| Nonfinancial Corporate Business: Bank Loans | 0.028 | 0.334 |
| Nonfinancial Corporate Business: Mortgage | 0.022 | 0.23 |
| Nonfinancial Corporate Business: Commercial Paper | -0.019 | 0.064 |
| Nonfinancial Corporate Business: Corporate Bonds | 0.166** | 1.977 |
Note: This table shows regression coefficients for each of the vulnerability measures in the first column and the four-year change in income inequality using annual U.S. data from 1964 to 2019. All specifications include the following controls: four-year change in short-term interest rate, four-year GDP growth, four-year growth in investment-to-output ratio, and four-year growth in money supply-to-output ratio. * signifies significance at the 10 percent level, ** at the 5 percent level, and *** at the 1 percent level. Standard errors are robust to heteroskedasticity and autocorrelation.
Source: For the income share, the World Inequality Database; all control variables are from the Macrohistory Database (Jordà et al., 2017).
We next consider the effect of income inequality on financial sector leverage and funding risks. We begin by considering the relationship between income inequality and the ratio of several nonbank financial institutions' assets to GDP.10 The full results are shown in Table 4. As shown in the first row, we find that increases in income inequality are significantly associated with increasing mutual fund size. Furthermore, we find that income inequality is positively associated with increasing insurer assets. As highlighted in Table 4, this result is driven by life insurers—we do not find a statistically significant relationship between income inequality and property and casualty insurers. Taking these results together, we find that increases in income inequality can increase the size of the nonbank sector, which is subject to fewer regulations and can play a significant role in propagating shocks throughout the financial system and to the real economy (Adrian et al., 2015).
Table 4. Income inequality and financial sector asset valuations, funding risks
| Vulnerability Measure | Coefficient | T-Statistic |
|---|---|---|
| Mutual Funds | 0.559* | 1.818 |
| All Insurers | 0.132** | 3.114 |
| Life Insurers | 0.146** | 3.38 |
| Nonbank Short-Term Wholesale Funding | 0.326** | 2.385 |
Note: This table shows regression coefficients for each of the vulnerability measures in the first column and the four-year change in income inequality using annual U.S. data from 1964 to 2019. All specifications include the following controls: four-year GDP growth, four-year PCE inflation, four-year growth in bank assets, and four-year growth in the share of the population aged 55 or older. * signifies significance at the 10 percent level, ** at the 5 percent level, and *** at the 1 percent level. Standard errors are robust to heteroskedasticity and autocorrelation.
Source: For the income share, the World Inequality Database; for GDP growth and PCE inflation, the Macrohistory Database (Jordà et al., 2017); for bank assets, Federal Reserve Board, Statistical Release Z.1., "Financial Accounts of the United States"; for the share of the population aged 55 or older, the Bureau of Labor Statistics.
Lastly, we further explore the connection between inequality and the nonbank sector by looking at the relationship between income inequality and funding in the nonbank sector. These results are again shown in Table 4. We see that there is a positive and significant relationship between income inequality and nonbank gross short-term wholesale funding11. In line with the results on mutual fund and life insurer asset valuations, this result supports the hypothesis that increasing inequality may increase the flow of money to less regulated spaces. Short-term wholesale funding, in particular, has been flagged as a potential financial stability concern (Adrian et al., 2015). Thus, inequality may contribute to financial stability risks by attenuating funding risks through increasing reliance on short-term funding.
To summarize, we show that increasing income inequality can heighten financial sector vulnerabilities by increasing business leverage, funding risks, and the sizes of different nonbank sectors.
Discussion
Our results show that inequality is associated with different financial sector vulnerabilities. The existing literature has proposed potential mechanisms why inequality affects vulnerabilities: 1) Inequality may increase demand for household credit if low-income households borrow to keep up with consumption when incomes stagnate; 2) inequality may increase demand for riskier assets if the rich have higher risk tolerance or more optimistic views about future dividends; 3) inequality increases savings of the rich, and these increased savings feed into the financial system through different asset classes and eventually end up increasing the supply of credit, increasing dissaving of the rest of the households.12
We postulate that the last mechanism can rationalize many of the results we find. First, compared with low-income households, high-income households save a higher share of their current and lifetime income (Dynan et al., 2004; Straub, 2019; Auclert and Rognlie, 2017, 2018), and the rise in inequality has been associated with increased savings of rich households (Mian et al., 2020).
Second, higher-income households allocate a higher fraction of their savings toward financial assets and riskier assets compared with lower-income households. We can look at the breakdown of the household asset composition by income percentiles using data from the Distributional Financial Accounts (Figures 2 and 3). Figure 2 shows the shares of different assets out of the total portfolio for different groups in the income distribution in 2019:Q4. It is evident that, compared with lower-income households, households higher up in the income distribution tend to hold a smaller share of their portfolios in real assets (real estate and consumer durable goods) and a higher share in riskier assets, like corporate equities and mutual fund shares. In fact, Figure 3 shows that the top 20 percent of the income distribution holds about two-thirds of all the financial assets in the economy.13
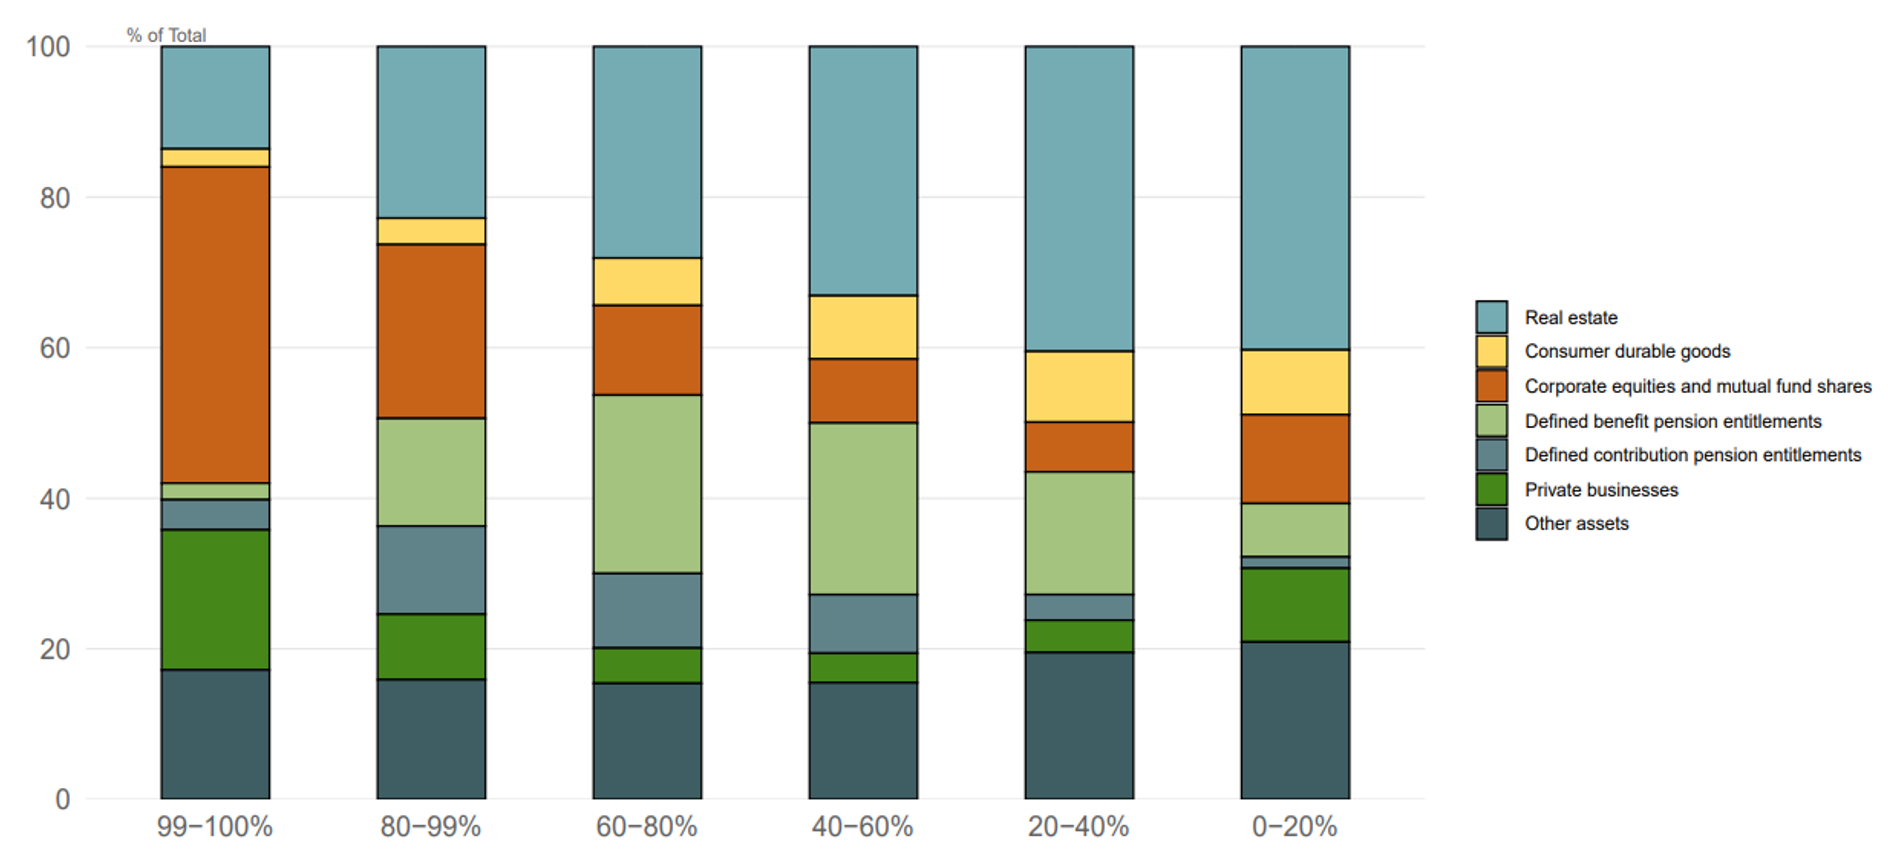
Note: The key identifies series in order from top to bottom.
Source: Survey of Consumer Finances and Financial Accounts of the United States.
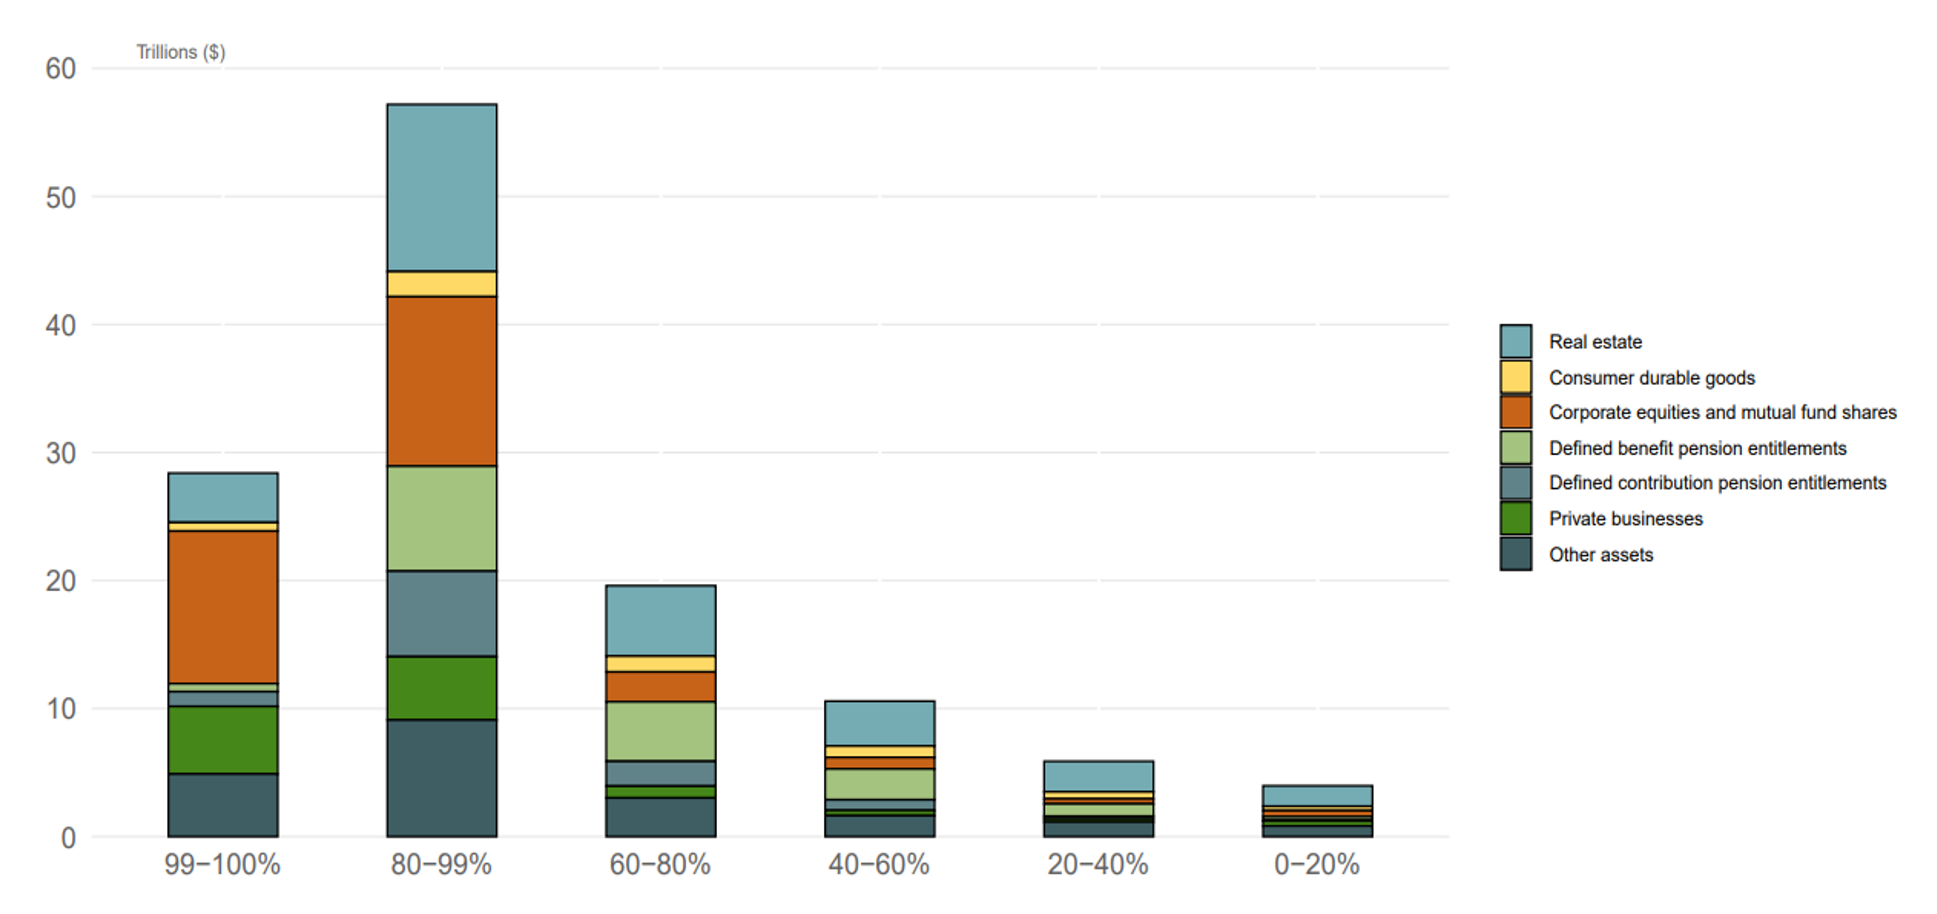
Note: The key identifies series in order from top to bottom.
Source: Survey of Consumer Finances and Financial Accounts of the United States.
These data points highlight how shifts in total income and wealth toward higher percentiles increase demand for riskier assets and can rationalize why inequality is positively related to nonbank sector size and debt as well as higher valuations of riskier assets relative to GDP. Patterns in corporate bond financing have also been linked to changes in the pricing of credit risk (Greenwood and Hanson, 2013), which may vary with inequality and aggregate risk appetite. In addition, Mian et al. (2020) show that increased savings of the rich feed into the financial system and finally end up increasing the supply of credit. We find a positive association between income inequality, mutual funds, and life insurers. As mutual funds and life insurers are both large holders of corporate bonds and agency government-sponsored enterprise debt, a rise in inequality may lead these nonbanks to demand more of these assets and indirectly increase the supply of credit in nonfinancial sectors, consistent with our findings.
References
Adrian, T., D. Covitz, and N. Liang (2015). Financial stability monitoring. Annual Review of Financial Economics 7, 357–395.
Aikman, D., M. Kiley, S. J. Lee, M. G. Palumbo, and M. Warusawitharana (2017). Mapping heat in the US financial system. Journal of Banking & Finance, 81, 36–64.
Auclert, A., and M. Rognlie (2017). Aggregate demand and the top 1 percent. American Economic Review 107(5), 588–592.
Auclert, A., and M. Rognlie (2018). Inequality and aggregate demand (No. w24280). National Bureau of Economic Research.
Baldacci, E., L. De Mello, and G. Inchauste (2002). Financial crises, poverty, and income distribution. In A. Mody and C. Pattillo, eds., Macroeconomic Policies and Poverty Reduction. London: Routledge, 269–307.
Bazillier, R., J. Héricourt, and S. Ligonnière (2021). Structure of income inequality and household leverage: Cross-country causal evidence. European Economic Review 132, 103629.
Berisha, E., J. Meszaros, and R. Gupta (2022). Income inequality and house prices across US states. Quarterly Review of Economics and Finance 91, 192–197.
Bodea, C., C. Houle, and H. Kim (2021). Do financial crises increase income inequality? World Development 147, 105635.
Caballero, R. J., E. Farhi, and P. O. Gourinchas. (2008). An equilibrium model of "global imbalances" and low interest rates. American Economic Review 98(1), 358–393.
Caballero, R. J., and A. Krishnamurthy. (2009). Global imbalances and financial fragility. American Economic Review 99(2), 584–588.
Cairò, I., and J. Sim (2020). Market power, inequality, and financial instability. Finance and Economics Discussion Series 2020-057. Washington: Board of Governors of the
Federal Reserve System, https://doi.org/10.17016/FEDS.2020.057.
Carpentier, J.-F., J. Olivera, and P. Van Kerm (2018). Macroprudential policy and household wealth inequality. Journal of International Money and Finance 85, 262–277.
Doerr, S., T. Drechsel, and D. Lee (2022). Income inequality and job creation. Staff Reports 1021, New York: Federal Reserve Bank of New York, June (revised August 2023), https://www.newyorkfed.org/research/staff_reports/sr1021.html.
Dynan, K. E., J. Skinner, and S. P. Zeldes. (2004). Do the rich save more? Journal of Political Economy 112(2), 397–444.
Falato, A., D. Kadyrzhanova, J. Sim, and R. Steri. (2022). Rising intangible capital, shrinking debt capacity, and the US corporate savings glut. Journal of Finance 77(5), 2799–2852.
Frost, J., and R. van Stralen (2018). Macroprudential policy and income inequality. Journal of International Money and Finance 85, 278–290.
Gomez, M. (2022). Asset prices and wealth inequality. Technical report.
Greenwald, D. L., M. Lettau, and S. C. Ludvigson (2019). How the wealth was won: Factors shares as market fundamentals (No. w25769). National Bureau of Economic Research.
Greenwood, R., and S. G. Hanson (2013). Issuer quality and corporate bond returns. Review of Financial Studies 26(6), 1483–1525.
Hailemariam, A., S. Awaworyi Churchill, R. Smyth, and K. T. Baako (2021). Income inequality and housing prices in the very long-run. Southern Economic Journal 88(1), 295–321.
Iacoviello, M. (2008). Household debt and income inequality, 1963–2003. Journal of Money, Credit and Banking 40(5), 929–965.
Jordà, O., M. Schularick, and A. M. Taylor (2017). Macrofinancial history and the new business cycle facts. NBER Macroeconomics Annual 31(1), 213–263.
Jordà, O., K. Knoll, D. Kuvshinov, M. Schularick, and A. M. Taylor (2019). The rate of return on everything, 1870–2015. Quarterly Journal of Economics 134(3), 1225–1298.
Jordà, O., B. Richter, M. Schularick, and A. M. Taylor (2021). Bank capital redux: solvency, liquidity, and crisis. Review of Economic Studies 88(1), 260–286.
Kiley, M. T. (2021). What macroeconomic conditions lead financial crises? Journal of International Money and Finance 111, 102316.
Kirschenmann, K., T. Malinen, and H. Nyberg (2016). The risk of financial crises: Is there a role for income inequality? Journal of International Money and Finance 68, 161–180.
Kumhof, M., R. Rancière, and P. Winant (2015). Inequality, leverage, and crises. American Economic Review 105(3), 1217–1245.
Li, Y. (2023). Fragile new economy: Intangible capital, corporate savings glut, and financial instability. Accepted at American Economic Review.
Malinen, T. (2016). Does income inequality contribute to credit cycles? Journal of Economic Inequality 14, 309–325.
Markiewicz, A. and R. Raciborski (2022). Income inequality and stock market returns. Review of Economic Dynamics 43, 286–307.
Mian, A. R., L. Straub, and A. Sufi (2020). The saving glut of the rich. (No. w26941). National Bureau of Economic Research.
Määttänen, N. and M. Terviö (2014). Income distribution and housing prices: An assignment model approach. Journal of Economic Theory 151, 381–410.
Paul, P. (2020). Historical patterns of inequality and productivity around financial crises. Federal Reserve Bank of San Francisco.
Perugini, C., J. Hölscher, and S. Collie (2016). Inequality, credit and financial crises. Cambridge Journal of Economics 40(1), 227–257.
Piketty, T., E. Saez, and G. Zucman (2018). Distributional national accounts: Methods and estimates for the United States. Quarterly Journal of Economics 133(2), 553–609.
Rajan, R.G. (2011). Fault lines: How hidden fractures still threaten the world economy. Princeton, NJ: Princeton University Press.
Rewilak, J. (2018). The impact of financial crises on the poor. Journal of International Development 30(1), 3–19.
Straub, L. (2019). Consumption, savings, and the distribution of permanent income. Unpublished manuscript, Harvard University.
Toda, A. A., and K. J. Walsh (2020). The equity premium and the one percent. Review of Financial Studies 33(8), 3583–3623.
Wachter, J. A., and M. Yogo (2010). Why do household portfolio shares rise in wealth? Review of Financial Studies 23(11), 3929–3965.
Welch, I., and A. Goyal (2008). A comprehensive look at the empirical performance of equity premium prediction. Review of Financial Studies 21(4), 1455–1508.
1. This note reflects the views of the authors and not necessarily those of the Federal Reserve Board or the Federal Reserve System. Return to text
2. See Kirschenmann et al. (2016) and Paul (2020). Kiley (2021) also finds that inequality has some predictive power on financial crises, but the impact is smaller and weaker than the effect of other proposed predictors. Return to text
3. While we focus here on how inequality affects financial vulnerabilities, some research has focused on studying the distributional impacts of financial crises, and the distributional impacts of macroprudential policies and regulation. On the one hand, evidence exists that financial crises hit the lowest-income households the hardest (Baldacci et al., 2002; Rewilak, 2018; Bodea et al., 2021), increasing inequality. On the other hand, there have been critiques of the macroprudential policies and regulation attempting to reduce risks of financial crises, arguing that these policies may exacerbate inequality if the costs of these policies are borne by low-income households and small businesses. The results from existing research have been mixed, showing that the effect of macroprudential policies on inequality depends on the underlying structure of the economy (Carpentier et al., 2018) and policy tools used (Frost and van Stralen, 2018). Return to text
4. Our results are broadly robust to using the top 10 percent income share as an inequality measure. Return to text
5. Earlier literature points out specifically that medium-run changes in inequality hold predictive power on financial crises (see, for example, Paul, 2020). For that reason, we focus on four-year (or medium-run) changes rather than shorter-run changes in inequality in our analysis. Return to text
6. The vector of controls varies by vulnerability category. In all specifications, we control for log growth in GDP. For nonfinancial sector leverage measures, the remaining controls include changes in the short-term interest rate, log growth in the investment-to-output ratio, and log growth in the money supply-to-output ratio. For asset valuation and funding risk measures, the controls include log growth in PCE inflation, log growth in bank assets, and log growth in the share of the population aged 55 or older. For asset return measures, the controls include log growth in the price-to-dividends ratio, log growth in the price-to-earnings ratio, and log growth in the consumption-to-wealth ratio. Return to text
7. The vulnerability measures that have a statistically significant correlation with inequality are flagged in Table 1. We use standard errors robust to heteroskedasticity and autocorrelation to determine statistical significance. Return to text
8. For inequality and household leverage, see Iacoviello (2008), Kumhof et al. (2015), Malinen (2016), Perugini et al. (2016), Cairo and Sim (2020), and Bazillier et al. (2021). For wealth inequality and equity valuations and returns, see Greenwald et al. (2019), Toda and Walsh (2020), Gomez (2022), and Markiewicz and Raciborski (2022). Return to text
9. Our wealth inequality measure differs from the measures used in the earlier literature, potentially explaining why we do not have statistically significant results. Gomez (2022) uses the wealth share of the top 0.01 percent, while Toda and Walsh (2020) construct their own measure of wealth inequality mainly reflecting capital wealth and income inequality (see Toda and Walsh, 2020, pp. 3596–99). Return to text
10. Nonbanks are subject to fewer regulations and are often opaquer compared with banks, making them harder to monitor. Tracking total assets of different nonbank sectors relative to GDP helps to assess the overall size and potential vulnerabilities in these sectors. Rapid growth in their relative size may signal a build-up of vulnerabilities, especially in sectors that are known to be highly leveraged or are known to engage in riskier activities. Relatedly, Kirschenmann et al. (2016) find that a larger size of the U.S. mutual fund industry predicts financial crises. Return to text
11. Nonbank gross short-term wholesale funding is defined as the sum of gross financial sector liabilities less gross liabilities for the monetary authority and private depository institutions. This includes, for example, money market funds and broker-dealers. The series is expressed relative to GDP. Return to text
12. Excess savings have been linked to financial stability before. "The global saving glut," a large increase in savings globally, has been showed to fuel the credit expansion in the United States before the GFC, as these savings increased demand for U.S. dollar-denominated safe assets (Caballero et al., 2008; Caballero and Krishnamurthy, 2009). Mian et al. (2020) document a large rise in the savings of the top 10 percent households in the U.S. income and wealth distribution and show that this domestic "saving glut of the rich" has been of the same magnitude as the documented global increase in savings. These results hint that the rise in domestic savings can be as important a driver of financial instability as the rise in global savings. More recently, research has also showed that the rise in the use of intangible capital has led firms to hold more liquid assets, like cash (Falato et al., 2022), and these increased savings of firms have been linked to financial instability through cheap leverage to financial intermediaries and increased asset prices (Li, 2023). Return to text
13. When distributing households by wealth, the results are even starker. For the earlier literature, see, for example, Wachter and Yogo (2010), Mian et al. (2020), and Doerr et al. (2022). Return to text
Isojaervi, Anni T., and Sam Jerow (2024). "Inequality and financial sector vulnerabilities," FEDS Notes. Washington: Board of Governors of the Federal Reserve System, April 19, 2024, https://doi.org/10.17016/2380-7172.3482.
Disclaimer: FEDS Notes are articles in which Board staff offer their own views and present analysis on a range of topics in economics and finance. These articles are shorter and less technically oriented than FEDS Working Papers and IFDP papers.