FEDS Notes
March 21, 2025
Life Insurers’ Role in the Intermediation Chain of Public and Private Credit to Risky Firms1
Sydney Carlino, Nathan Foley-Fisher, Nathan Heinrich, and Stéphane Verani
Executive Summary
This note quantifies life insurers' role in the intermediation of public and private credit to risky firms. Since the 2007-09 financial crisis, the share of life insurers' general account assets exposed to below-investment-grade ('risky') corporate debt has roughly doubled. Life insurers invest directly in risky firms through high-yield corporate bonds and leveraged loans, while also gaining exposure indirectly via broadly syndicated loan (BSL) collateralized loan obligations (CLOs), middle market (MM) CLOs, business development companies (BDCs), and joint venture loan funds (JVLFs). Life insurers' affiliated asset managers have become major corporate loan originators and managers of BSL and MM CLOs, BDCs, and JVLFs. Partnerships between life insurers and asset managers have created complex and arguably opaque structures to increase investment returns. These arrangements seek to shift portfolio allocations towards risky corporate debt while exploiting loopholes stemming from rating agency methodologies and accounting standards.
A Representative Example
Our representative example is based on one of the largest and oldest life insurers in the U.S., with several domestic life insurance companies holding over $250 billion in general account assets and a wholly-owned reinsurer located in Bermuda, holding about $20 billion in assets as of the end of 2023.2,3
The example life insurer has an affiliated asset manager ('AM'), which manages all assets and specializes in the acquisition, origination, and securitization of loans to below-investment-grade ('risky') firms, including bank-originated leveraged loans and privately-originated middle-market (MM) loans. AM has two asset manager subsidiaries named AM‑BDC and AM‑CLO, which are responsible for AM's BDC- and CLO-managed loans, respectively. By year-end 2023, AM‑BDC managed about $2 billion in loans, and AM‑CLO managed about $18 billion in CLOs. These figures exclude loans from AM‑BDC's affiliated joint venture loan funds (JVLFs), which are not consolidated in AM‑BDC's SEC filings and manage roughly $1 billion in loans that were chiefly self-originated.
While AM‑BDC's regulatory leverage ratio is under 2:1, we estimate that AM‑BDC's consolidated leverage could reach up to 12:1 when combined with its affiliated JVLFs and MM CLOs. In effect, AM's loan portfolio is funded through a mix of debt and equity from CLOs, BDCs, JVLFs, and the insurer itself, along with financing from external investors. Such complex arrangements thus obscure the true leverage of both the insurer and the insurer-affiliated AM. Moreover, the insurer's exposure to risky corporate debt is similarly opaque, as its equity positions in affiliated BDCs, JVLFs, and CLOs are not consolidated or reported and some are treated as investment-grade debt under statutory accounting.
This stylized, yet factual example illustrates the complex and opaque structures developed by life insurers and their asset managers to enhance their role in the intermediation of public and private credit to risky firms. This note first quantifies the growth of these structures and exposures across the life insurance industry, and then discusses the regulatory loopholes fueling their development.
1. Life insurers' role in the intermediation chain of chain of credit to risky firms
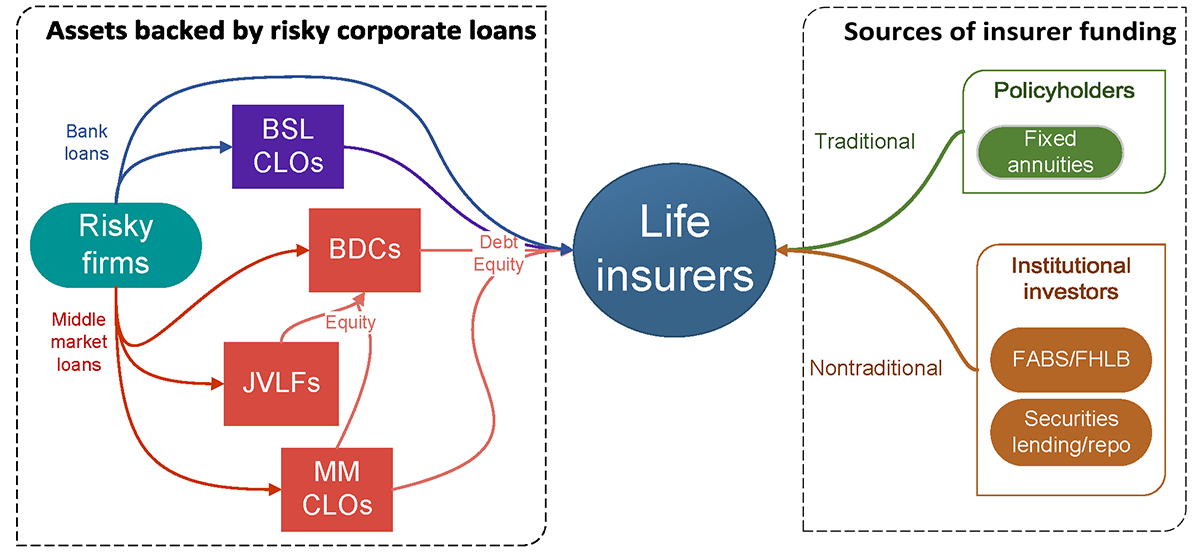
Figure 1 is a stylized map showing life insurers' position in the intermediation chain of public and private credit to below-investment-grade ("risky") firms. The arrows on Figure 1 represent how the different types of assets and liabilities feed into insurers' general account. These firms seek funding from capital markets via high-yield corporate bonds, from banks through leveraged loans (public credit), and from nonbank financial institutions, such as BDCs and JVLFs, in the form of private credit. BDCs invest directly in loans to qualifying companies, primarily small and medium-sized enterprises (SMEs), and establish affiliated JVLFs and middle-market (MM) CLOs.4 Life insurers invest directly in risky firms through high-yield corporate bonds and leveraged loans, while also gaining exposure indirectly via broadly syndicated loan (BSL) CLOs, MM CLOs, and BDCs/JVLFs. Their funding comes from policyholders through insurance liabilities such as fixed annuities and from institutional investors through nontraditional liabilities, including funding agreement-backed securities (FABS), FHLB advances, securities lending programs, and repo programs.
We compile a wide range of detailed commercial and regulatory data for each node shown in Figure 1. For BSL and MM CLOs, we utilize Leveraged Commentary & Data (LCD) CLO Global Databank and Moody's Analytics CLO collateral data. For BDCs, we combine data from PitchBook, LCD's Historical BDC Holdings database, and SEC filings such as Form N-54A and Form N-54C (filings through which a company elects to be or cease to be regulated as a business development company, respectively). The result is a comprehensive dataset of 176 public and private BDCs, 28 of which are or become affiliated with a life insurer over the sample period. For life insurers, we use portions of statutory filings, including Schedule Y to trace their relationships with asset managers since 2000, and asset holdings data from Schedule D Parts 1 and 2, Schedule DA, and Schedule BA.
We use these data to measure (i) the amount of risky corporate debt originated by life insurers' affiliated asset managers and (ii) the exposure of life insurers to risky corporate debt.
1.1. Risky loan origination by affiliated asset managers
Asset managers affiliated with life insurers are increasingly significant in originating risky loans. To illustrate this, we analyze the loans held by the CLOs and BDCs they created. Panels A and B of Figure 2 show the broadly syndicated loans and MM loans, respectively, held by CLOs issued by these asset managers. By the end of 2023, these CLOs contained over $360 billion in broadly syndicated loans and approximately $35 billion in MM loans. The dashed line in each panel indicates the share of outstanding loans held by CLOs attributable to life insurer-affiliated asset managers, which has steadily risen to about 35 percent for broadly syndicated loans and 40 percent for middle-market loans.
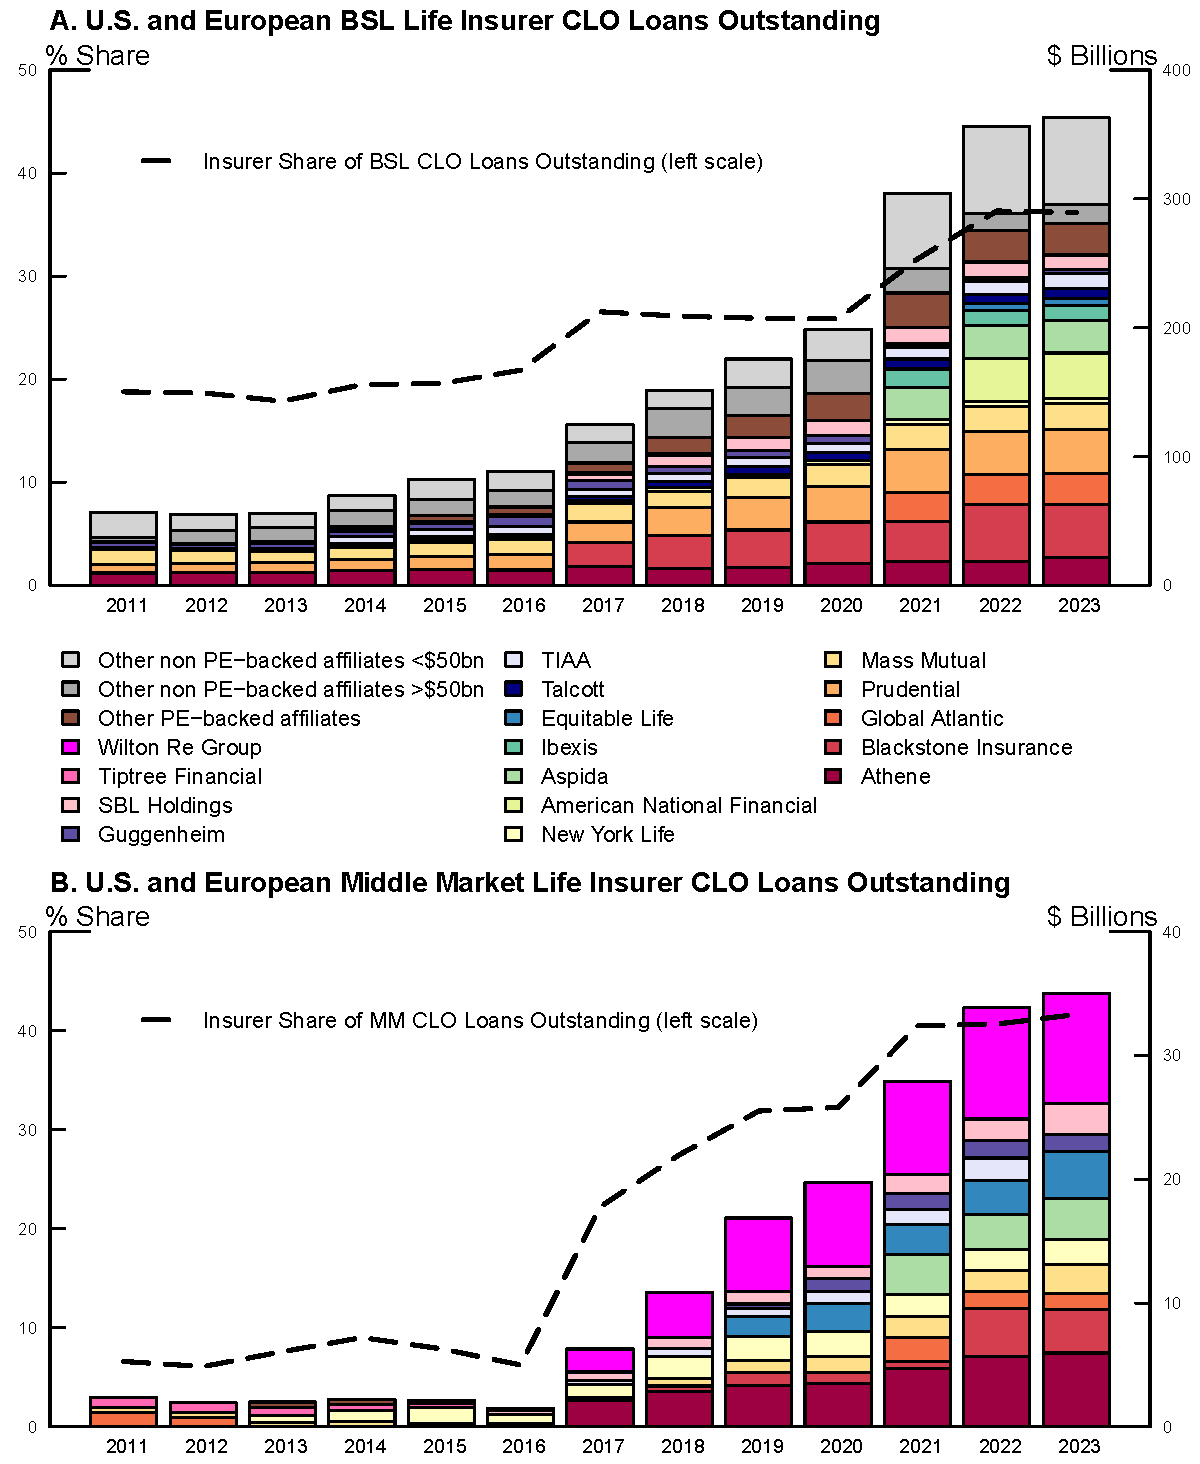
Note: The key identifies bars in order from top to bottom.
Source: Staff estimates based on Moody's Analytics data and NAIC Statutory Filings. Data are current as of 2023Q4.
Additionally, asset managers channel their risky loan originations into BDCs. The colored bars in Figure 3 display the asset holdings of BDCs established by asset managers affiliated with life insurers. By the end of 2023, these holdings exceeded $100 billion, partially fueled by Blackstone's acquisition of Everlake Holdings in November 2021. The dashed line indicates that this amount represents approximately 40 percent of all BDC assets.
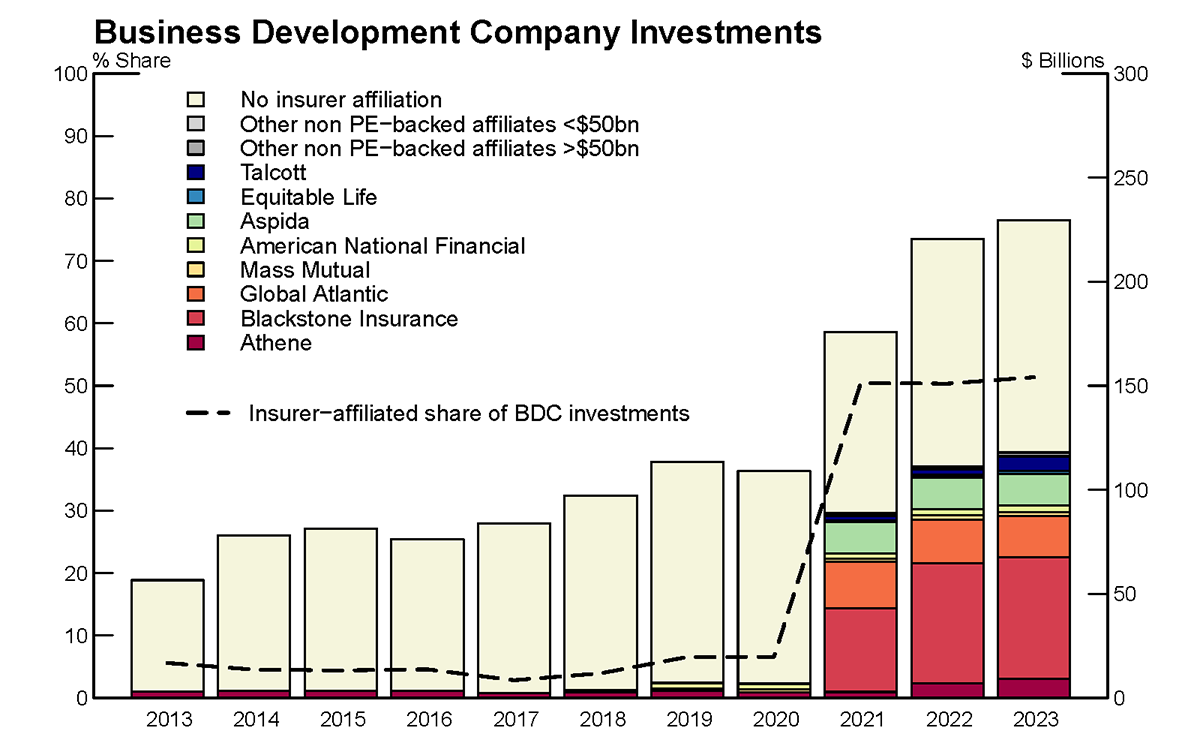
Note: The key identifies bars in order from top to bottom.
Source: Staff estimates based on data from PitchBook, LCD, SEC Filings. Data are current as of 2023Q4.
1.2. Life insurers' exposure to risky corporate debt
Life insurers' exposure to risky corporate debt, both directly and indirectly through complex investment structures, has been steadily increasing. Panel A of Figure 4 illustrates the consistent growth in their total investments in high-yield corporate bonds, corporate loans, CLOs, and BDCs/JVLFs. Growth is particularly striking in their exposures to BSL and MM CLOs, which together reached a record $212 billion by the end of 2023.5 Overall, the share of life insurers' general account assets invested in risky corporate debt has roughly doubled since the 2007-09 financial crisis, as indicated by the dashed line in the figure.
Panel B of Figure 4 focuses on life insurers with affiliated asset managers that create CLOs and BDCs/JVLFs. As of the end of 2023, these insurers controlled general account assets totaling $4.1 trillion, accounting for about 72 percent of the industry. While their overall share of investments in risky corporate debt is similar to that of the rest of the industry, smaller insurers without loan origination platforms tend to hold a disproportionately higher amount of MM CLO tranches and BDC debt and equity.
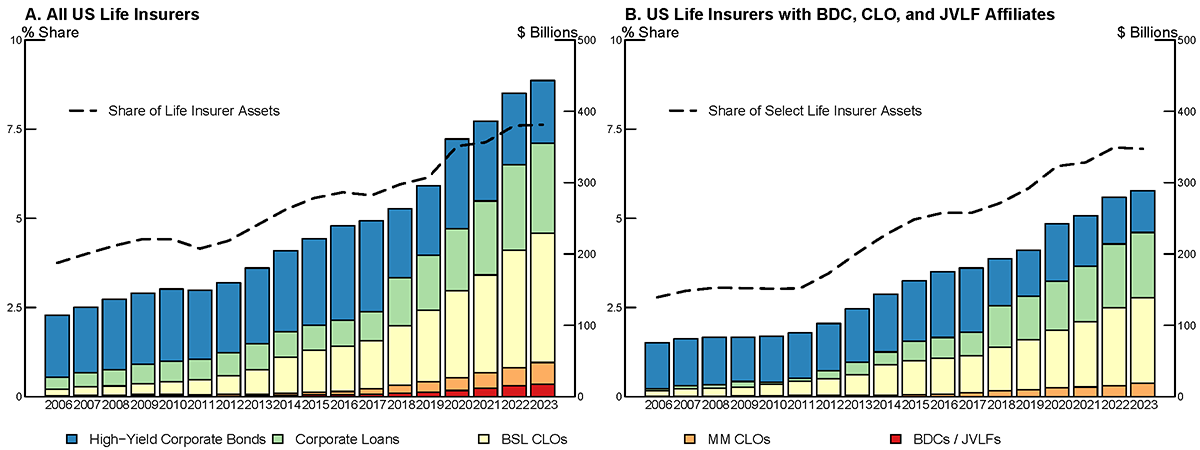
Note: The key identifies bars in order from top to bottom.
Source: Staff estimates based on Bloomberg Finance and NAIC Annual Statutory filings. Data are current as of 2023Q4.
2. Regulatory loopholes that drive growth in complex structures
In the second part of this note, we explore how these activities exploit, to some extent, loopholes in regulations from the Securities and Exchange Commission (SEC), the National Association of Insurance Commissioners (NAIC), and the Bermuda Monetary Authority (BMA).6 These opportunities may have contributed to the growth of life insurers' exposure to risky corporate debt through partnerships with asset managers and the development of intricate investment structures.
2.1. Increasing off-balance sheet leverage
BDCs can significantly increase leverage without exceeding regulatory limits set by the SEC by financing loans off-balance sheet through affiliated JVLFs and CLOs. The SEC does not require BDCs to consolidate these off-balance sheet entities when calculating leverage, as the BDC shares control with other equity investors and is therefore not liable for their debts. Since 2018, the debt-to-equity ratio limit for BDCs has been 2:1, following the Small Business Credit Availability Act, which relaxed the previous 1:1 constraint. In addition to this leverage limit, BDCs must meet other requirements, including allocating at least 70 percent of their portfolio to qualifying companies and distributing at least 90 percent of their taxable income to shareholders.7
Affiliated JVLFs are financed by equity from the parent BDC and other investors, including affiliated life insurers. The BDC's equity investment contributes to its 30 percent non-qualifying asset limit. The JVLF leverages this equity by issuing debt secured against its assets or cash flows, and it may obtain private credit ratings for some of its debt to attract further investment, such as from affiliated life insurers. Many BDCs have established multiple JVLFs.
Similarly, affiliated CLOs are financed by equity from the parent BDC, which may receive additional support from an affiliated life insurer that invests in both the CLO's equity and debt. This structure satisfies risk retention requirements in the U.S., EU, and Japan, as the parent BDC has 'skin in the game'. 8 As with JVLFs, many BDCs have created multiple CLOs.
While both affiliated CLOs and JVLFs hold loans originated by their parent BDCs, there are at least three key differences between these investment vehicles. First, CLOs must hold rated loans, whereas BDCs and JVLFs can also hold unrated loans. Second, CLOs typically have a first-loss ('equity') tranche equal to about 10 percent of assets, resulting in 10:1 leverage, while JVLFs generally operate with around 3:1 leverage. Third, CLOs usually have more stable liability structures and asset pools compared to JVLFs, which can relatively quickly adjust their asset portfolios and leverage. These differences give BDCs flexibility to optimize their financing strategies based on the types of loans, desired leverage levels, and origination capabilities. They can also combine CLOs and JVLFs to create multiple rounds of unconsolidated leveraged investments in risky corporate loans.9
2.2. Lowering risk-based capital requirements
U.S.- and Bermuda-based insurers can significantly reduce their risk-based capital requirements without changing their underlying asset exposure by swapping corporate loan holdings for CLO investments (Foley-Fisher, Heinrich & Verani 2024).10 This loophole arises because capital charges in these jurisdictions are primarily determined by credit ratings.11 For instance, insurers holding a portfolio of B-rated loans can cut their risk-based capital charges by two-thirds if they package those loans into a CLO and purchase the entire CLO capital stack. The impact is even more pronounced for middle-market loans, as their lower ratings lead to exponentially higher capital charges. An insurer in the U.S. or Bermuda that packages its MM loan holdings into a CLO and invests in the entire CLO capital stack could reduce its capital charge by a factor of 10.
Insurers in these jurisdictions can also cut their capital charges by investing in the capital stack of BDCs or JVLFs rather than directly in the underlying assets.12 Unlike CLOs, these vehicles can invest in both rated and unrated loans, including highly speculative middle-market loans and relatively larger unitranche loans that substitute for bank-originated leveraged loans. We estimate that insurers could achieve a similar reduction in capital charges—by a factor of 10—by replacing their direct loan holdings with investments in BDC or JVLF vehicles containing the same loans.
Finally, two additional features of life insurers' regulatory framework incentivize investments in risky corporate debt. First, the insurance risk-based capital framework assumes a zero correlation between bond and equity risk, neglecting the likely systematic risk associated with BDC, JVLF, and CLO debt and equity, which finance the same pool of risky loans. Second, while the gross capital charge for equity and unrated debt is 30 percent, the effective post-tax charge is likely much lower due to the nonlinearity of capital charges. We estimate that an insurer allocating 1 percent of its general account to these risky assets may effectively face a capital charge of only 10-15 percent.
2.3. Turning insurance obligations into debt
Larger life insurers with investment-grade credit ratings can issue institutional annuities, primarily in the form of funding agreements that transform insurance liabilities into debt.13 Funding agreements (FAs), which have no mortality or morbidity contingencies, simply pay a fixed or floating interest rate for a specified period. FAs offer flexibility, as they can be privately placed, used as collateral for Federal Home Loan Banks (FHLBs), structured as guaranteed interest contracts, or securitized into funding agreement-backed securities (FABS).
FABS effectively transform insurance liabilities into debt. Typically, an insurer issues an FA to a special purpose vehicle, which holds it as collateral and issues FABS. As the FA is backed by general account assets, FABS are senior to—and thus less costly than—debt issued directly by the insurer (Foley-Fisher, Narajabad & Verani 2020). Life insurers can customize their FABS to meet specific investor needs. For instance, they can create FA-backed commercial paper and FA-backed repos targeting institutional investors such as money market funds, banks, and private cash pools through short-term wholesale funding markets.
3. An overview of the burgeoning academic literature
The increasing role of life insurers in the CLO market, particularly their preference for mezzanine tranches, has been a central theme in some recent research. While those studies have advanced our understanding of insurers' involvement in CLO markets, they often fail to account for the endogenous dynamics introduced by insurers' strategic affiliations with CLO managers. Our note underscores the importance of considering these endogenous factors in analyzing insurers' investment behavior.
Foley-Fisher, Heinrich & Verani (2024) emphasize how life insurers have facilitated credit flows to risky firms through their involvement in affiliated CLOs, highlighting the growing importance of insurers' strategic relationships with CLO managers and the higher reliance on fixed annuity liabilities to fund these activities. These relationships and changes in funding structures, complicate the risk exposure of insurers and raise questions about the true level of risk they face. While Bhardwaj, Ge & Mukherjee (2025) argue that positive cash flows shocks lead insurers to increase their CLO purchases, especially from managers from whom they purchased before, their identification strategy overlooks the endogenous nature of these variables. Life insurers' cash flows are a consequence of historical strategies, including asset manager affiliations, and insurers' choice of prices for insurance liabilities, which can vary on a daily or weekly basis to take advantage of changes in asset market conditions (Verani & Yu, 2024). So, cash flow changes, asset portfolio allocations, and insurance liability prices are likely joint outcomes of a complex optimization problem that insurers solve with the help of affiliate asset managers. This note further highlights the complexity of insurers' growing involvement in CLOs and other risky corporate debt markets.
Santos & Fringuellotti (2023) explore the motives driving life insurers' growing preference for CLOs, particularly regulatory capital incentives. While Santos & Fringuellotti (2023) provide valuable insights into life insurers' search for yield behavior, their analysis overlooks the strategic nature of insurers' affiliations with asset managers. Foley-Fisher, Heinrich & Verani (2024) emphasize how life insurers are uniquely positioned to be the ultimate bearers of CLO risk and how these relationships add a layer of complexity to insurers' risk exposure that Santos & Fringuellotti (2023) do not fully address. Our note builds on this insight by demonstrating how insurers' involvement in CLOs is not just yield-seeking behavior, but also reflects pre-existing relationships with asset managers, making investment decisions more complex than simply search for yield.
Lastly, more work is needed to understand the global allocation of risk emanating from bank loan and private credit markets. Kartasheva (2025) shows that European life insurance subsidiaries of U.S. asset managers specializing in risky credit have a different allocation than their U.S. subsidiaries. Studying the interaction of regulation and product market dynamics is essential to understand fully the role of U.S. life insurers in the intermediation chain of public and private credit to risky firms.
4. Concluding remarks
Through innovative financing structures, life insurers have sought to further develop their role in the intermediation chain of public and private credit to risky firms. Life insurers' exposure to below-investment-grade firm debt has boomed and now exceeds the industry's exposure to subprime residential mortgage-backed securities in late 2007. At the same time, the industry's level of wholesale funding is near its 2007 level, shortly after which life insurers experienced runs on their nontraditional funding structures, such as FABS (Foley-Fisher, Narajabad & Verani 2020) and securities lending (McDonald & Paulson 2015, Foley-Fisher, Gissler & Verani 2019).
References
Bhardwaj, A., Ge, S., and Mukherjee, S. (2025). 'Does Loan Securitization Expose Borrowers to Non-Bank Investor Shocks?—Evidence from Insurers', NBER Working Paper No. w33449.
Coaley, J., Tasker, P. & Greenslade, M. (2023), 'Back to basics | funds vs JVs'. https://cms.law/en/int/publication/cms-funds-group-back-to-basics-briefings/funds-vs-jvs
Foley-Fisher, N., Heinrich, N. & Verani, S. (2024), 'US Life Insurers and Systemic Risk' in the Research Handbook of Macroprudential Policy.
Foley-Fisher, N., Narajabad, B. & Verani, S. (2020), 'Self-fulfilling runs: Evidence from the US life insurance industry', Journal of Political Economy 128(9), 3520–3569.
Foley-Fisher, N., Gissler, S., & Verani, S. (2019). 'Over-the-counter market liquidity and securities lending', Review of Economic Dynamics 33, 272-294.
Horowitz, R. & Gaines, J. (2019), 'The growth of private BDCs', The Investment Lawyer: Covering Legal and Regulatory Issues of Asset Management 26(4) https://cms.law/en/int/publication/cms-funds-group-back-to-basics-briefings/funds-vs-jvs
Kartasheva, A. (2025). 'Private Equity Investments in the Life Insurance Industry,' in: Georges Dionne (ed.), Handbook of Insurance, pages 311-336, Springer.
LSTA (2018), 'Middle-market CLO relief'.
LSTA (2024), 'NAIC Update: Risk-Based Capital for CLO Residual Tranches and Notes'.
McDonald, R., & Paulson, A. (2015). AIG in Hindsight. 'Journal of Economic Perspectives', 29(2), 81-106.
Santos, J., & Fringuellotti, F. (2023). Insurance Companies and the Growth of Corporate Loans' Securitization, FRB of New York Staff Report No. 975, Rev. September 2023.
Verani, S., & Yu, P. C. (2024). 'What's Wrong with Annuity Markets?', Journal of the European Economic Association 22(4), 1981-2024.
1. For providing valuable comments, we would like to thank, without implication Ana Arsov, Celso Brunetti, Richard Cantor, Dan Covitz, Max Huber, Mina Lee, Andreas Lehnert, Borghan Narajabad, David Scharfstein, and Matt Walker. The views in this paper are solely the authors' and should not be interpreted as reflecting the views of the Board of Governors of the Federal Reserve System or of any other person associated with the Federal Reserve System. Return to text
2. The representative example is based on a mutual life insurer, which is not publicly traded. The trends described in this note are industry trends and are not linked to a specific ownership structure. Publicly traded insurers as well as PE owned insurers are actively engaged in the intermediation of public and private credit to risky firms. Return to text
3. To preserve confidentiality all the numbers in this section have been reasonably modified. Return to text
4. CLOs are legal entities that purchase loans from banks and nonbanks, financing them by issuing debt and equity in public capital markets. JVLFs resemble credit funds but differ in key ways, particularly regarding investor control. In a JVLF, only a small group of partners, such as the affiliated BDC and life insurer, actively manage the fund's daily operations. This structure can limit regulatory oversight and investor disclosure in Europe. Unlike credit funds, JVLFs are typically not considered alternative investment funds in the EU and therefore are not regulated under the Alternative Investment Fund Managers Directive (Coaley, Tasker & Greenslade 2023). Return to text
5. Not shown in Figure 5, life insurers hold a disproportionately large amount of riskier CLO tranches. Indeed, life insurers have become the largest investors in non-senior CLO tranches, financing about 30 percent of all CLOs' riskier capital. Return to text
6. Regulators are aware of some of these loopholes. See for example, the Moody's Ratings Sector In-Depth report from May 15, 2024 "Regulation contributes to material differences in private credit allocation" available at https://www.moodys.com/research/Life-Insurance-Cross-Region-Regulation-contributes-to-material-differences-in-Sector-In-Depth--PBC_1400886 for an update on the NAIC and the announcement by the BMA available at https://www.bma.bm/viewPDF/documents/2024-08-30-12-53-11-Notice---Bermuda-Long-term-Insurance-Market-Reports-.pdf. Return to text
7. To meet portfolio allocation requirements, BDCs typically invest in loans to U.S.-based SMEs. Larger BDCs are increasingly focusing on unitranche loans of $1 billion or more, which serve as substitutes for bank-originated leveraged loans. BDCs are tax-efficient for U.S. direct lending strategies by blocking Effectively Connected Income and Unrelated Business Taxable Income for tax-exempt investors, as they pay no entity-level tax (Horowitz & Gaines 2019). Return to text
8. In 2018, the SEC issued a no-action letter to Dechert on behalf of Golub Capital that confirmed BDCs could satisfy CLO risk retention rules by purchasing equity interest in affiliated CLOs — see LSTA (2018) and the SEC's no-action letter here: https://www.sec.gov/divisions/investment/noaction/2018/golub-capital-bdc-090718-17d1.htm. Return to text
9. BDCs consolidate only their equity-like investment in the CLOs they create. Return to text
10. Insurers are also attracted to Bermuda by less stringent tax and accounting regimes. Return to text
11. The NAIC recently launched a review of its framework specifically to address this loophole and introduced an interim 45 percent capital charge on CLO equity (LSTA 2024). Insurers can avoid this capital charge using an affiliated BDC. Return to text
12. While BDCs tend to obtain public credit ratings for their debt, JVLFs tend to obtain private credit ratings. Return to text
13. Life insurers' increasing exposures to risky firms have been largely financed by a surge in retail and institutional annuities (Foley-Fisher, Heinrich & Verani 2024). The primary funding source is individual fixed annuities—tax-deferred pre-retirement saving vehicles that are economically similar to bank certificates of deposit—totaling around $2.5 trillion in account balances by 2023. Return to text
Carlino, Sydney, Nathan Foley-Fisher, Nathan Heinrich, and Stéphane Verani (2025). "Life Insurers’ Role in the Intermediation Chain of Public and Private Credit to Risky Firms," FEDS Notes. Washington: Board of Governors of the Federal Reserve System, March 21, 2025, https://doi.org/10.17016/2380-7172.3691.
Disclaimer: FEDS Notes are articles in which Board staff offer their own views and present analysis on a range of topics in economics and finance. These articles are shorter and less technically oriented than FEDS Working Papers and IFDP papers.