FEDS Notes
August 09, 2019
Liquidity Transformation Risks in U.S. Bank Loan and High-Yield Mutual Funds
Kenechukwu Anadu and Fang Cai1
1. Introduction
Net assets in open-end (non-money market) mutual funds (MFs) have increased notably over the past decades. Regulators and researchers have identified liquidity transformation risks as a potential vulnerability arising from the MF structure (see, for example, Carney (2019), Chernenko and Sunderam (forthcoming), Financial Stability Board (2017), Financial Stability Oversight Council (2016), International Monetary Fund (2015)). MFs offer daily redemptions irrespective of the liquidity profiles of their underlying assets.2 In particular, regulators and academics have recently expressed concerns about MFs that invest primarily in relatively illiquid assets, such as bank loans and high-yield bonds (Clayton (2019) and Powell (2019)). One key concern is that large investor redemptions from MFs could lead the funds to sell assets at "fire sale" prices, which could negatively impact other financial markets.
Assessing liquidity transformation risks in MFs is difficult, largely due to a lack of detailed data on fund assets' liquidity. In this note, we identify some indicators of funds' liquidity profiles, and examine them in a sample of bank loan (BL, also referred to as "leveraged loans") and high-yield corporate bond (HY) MFs, which invest in relatively illiquid and riskier assets and, thus, for which vulnerabilities associated with liquidity transformation are generally most salient. We find that the ten largest BL MFs have increased their holdings of the hardest-to-value, generally most illiquid assets over the past decade. Moreover, the average fraction of liquid assets (by our measure) to total assets held by BL MFs have held relatively stable over the same period. This combination of rising hard-to-value, illiquid holdings amid generally stable liquid holdings might indicate rising liquidity risks. We also find that the ten largest HY MFs' relative holdings of the hardest-to-value assets declined modestly in recent years, and liquid assets have held relatively stable, although the range has widened.
The remainder of this note is organized as follows. Sections 2 and 3, respectively, describe the growth in BL and HY MFs and the structural vulnerabilities arising from the MF structure. In section four, we present our high-level analysis of the liquidity profiles of the ten largest BL and HY MFs, including their use of lines of credit and other borrowings, over the past decade. Section five concludes.
2. Growth of BL and HY MFs
Net assets in BL MFs have increased over recent years, albeit with some volatility, driven in part by investors' interest in floating rate instruments. As of March 2019, net assets in BL MFs stood at almost $112 billion, up from about $24 billion at year-end 2009. Of that total, about $91 billion are invested in loans, up from less than $5 billion in 2008 (Figure 1).3 Similarly, net assets in HY MFs have increased significantly over recent years, from about $157 billion in December 2009 to almost $250 billion in March 2019 (Figure 2).4
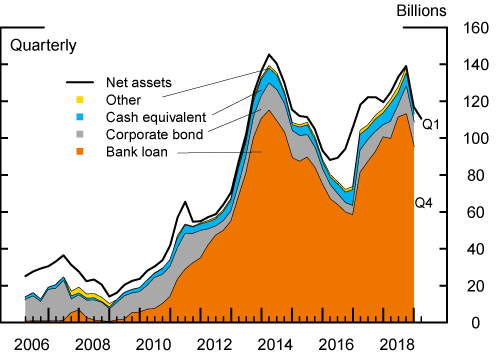
Source: Morningstar Direct.
Holdings detail not reported for all funds, shown uncolored.
Other includes derivatives, domestic and foreign government debt securities, municipal securities, convertible corporate bonds, preferred stock and equity
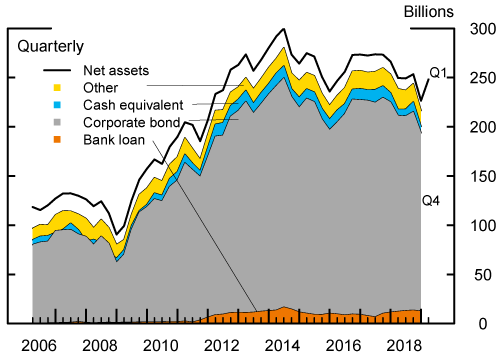
Source: Morningstar Direct.
Holdings detail not reported for all funds, shown uncolored.
Other includes derivatives, domestic and foreign government debt securities, municipal securities, convertible corporate bonds, preferred stock and equity
3. Structural Vulnerabilities of BL and HY MFs
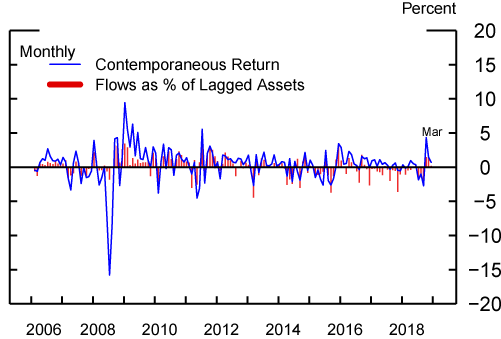
The growth of BL and HY MFs has sparked concerns about the potential risks to financial stability arising from their liquidity transformation activities.5 These funds allow daily redemptions in cash by investors, even though many of their underlying assets are relatively illiquid. Therefore, large redemptions during periods of stress could lead to asset fire sales that disrupt other financial markets; the fact that investors tend to respond to performance (Figures 3 and 4; see generally Goldstein, Jiang and Ng (2017)) makes it even more likely that funds will have outflows during times of stress. BL and HY MFs engage in an especially pronounced form of liquidity transformation, as loans and HY bonds are generally less liquid than equities and investment-grade corporate bonds, all else equal. Moreover, loans also tend to have lengthy settlement periods (usually greater than seven days), which further constrains BL MFs' ability to quickly convert their loans into cash to meet large redemptions.6
To date, large redemptions from BL and HY MFs have not led to broader financial stress. For example, in December 2018, amid heightened financial market volatility, BL MFs experienced record net outflows of $13 billion, or almost ten percent of net assets (Figure 3), while HY MFs experienced net outflows of $6 billion (Figure 4), or almost three percent of net assets. Notwithstanding, both types of MFs appear to have functioned relatively well during this episode.7 However, the relatively short duration of the December event, amid a strong macro-economic backdrop, probably cushioned losses. A more concerning scenario for MFs is one of sharp price declines and large redemptions at a time where economic fundamentals are weaker.
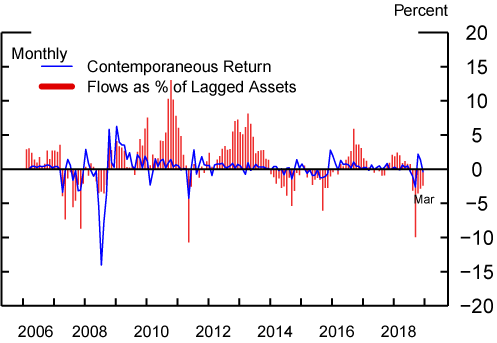
Source: Morningstar Direct.
Source: Morningstar Direct.
4. Indicators of Liquidity Profiles of BL and HY MFs
Assessing the liquidity profile of MF holdings is very difficult, largely due to the scarcity of comprehensive, high frequency market data and the lack of related disclosures by MFs. In June 2018, the SEC delayed and scaled back some provisions of its October 2016 rule to enhance liquidity risk management and disclosure by open-end MFs and ETFs. In particular, the SEC rescinded the requirement that funds publicly disclose aggregate liquidity classification of holdings in the 2016 rule.8 It is too early to tell how the rule would affect liquidity transformation risks among MFs and ETFs.
To get around the aforementioned data limitation, and to develop some tractable monitoring tools for the BL and HY segments of the MF industry, we hand-collected a novel set of data from publicly-available SEC forms N-CSR(S) and N-Q.9 Specifically, we examined data on the largest BL and HY MFs' reported cash and cash equivalents and "Level 3" assets as proxies for the most liquid and hardest-to-value or illiquid assets held by funds, respectively.10 As liquidity risk is positively correlated with credit risk (e.g., Ericsson and Renault (2006)), we also look into the credit profiles of these funds reported in Morningstar and use them as another tool to monitor potential changes in the liquidity profiles of HY and BL MFs (see also Aramonte, Scotti, and Zer (forthcoming) for a return-based measure).
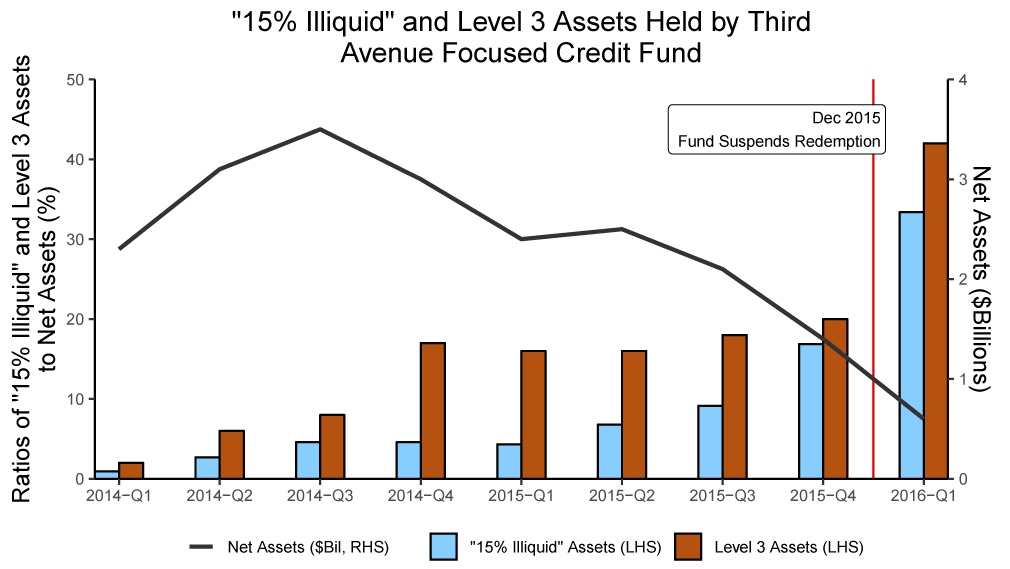
For expositional clarity, our first illiquid asset measure is the fraction of a fund's Level 3 assets to its net assets. Level 3 asset values are based on inputs that are unobservable to other market participants but instead reflect the reporting funds' own assumptions and the best available information under the circumstances. Examples of Level 3 assets include investments in private companies, certain mortgage related assets, loans, and complex derivatives. Given the interplay between Level 2 and Level 3 assets, it is possible that funds may underestimate their Level 3 assets; therefore, for the purposes of our analysis, we view this reporting as most useful for identifying outliers and overall trajectory, rather than reflecting the "true" liquidity profile of any particular MF. (We used Level 3 assets because not all MFs disclose their "15% illiquid assets.")11,12
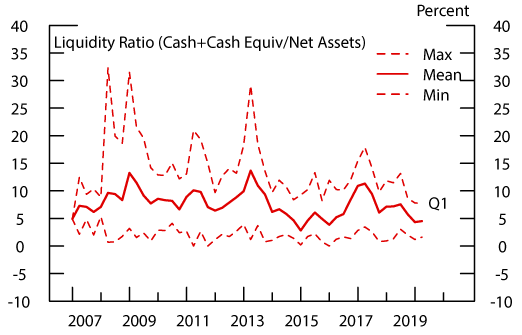
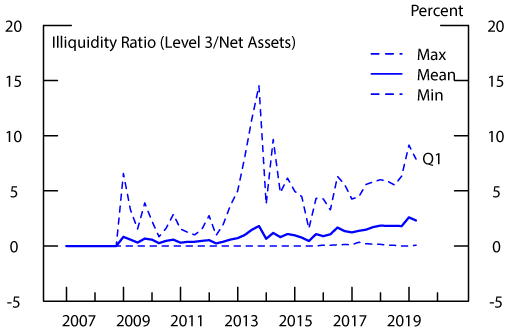
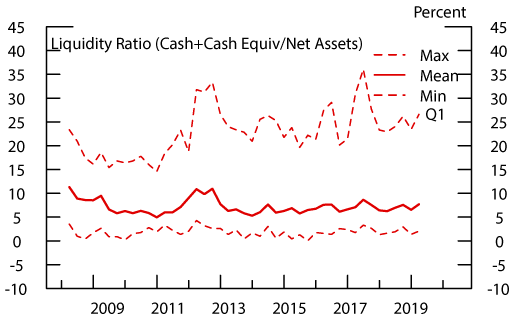
Our results are as follows. Figures 5 and 6 report, respectively, the liquidity ratios (measured as the sum of reported cash and cash equivalents as a percentage of net assets) and the hardest-to-value or illiquidity ratios (Level 3 assets as a percentage of net assets) for the ten largest BL and HY MFs.13 For BL MFs, the liquidity ratio appears relatively stable over the years, on average, although its range has narrowed since 2012, while the illiquidity ratio has trended up, on average, from a low base and its range has widened in recent years.14 These observations might suggest greater liquidity risk for BL MFs, and could indicate growing vulnerabilities from this sector. By contrast, liquidity ratios at HY MFs have been relatively stable (Figure 7), on average, while average illiquidity ratios (Figure 8) have narrowed in recent years.
Source: SEC N-Q, N-CSR, N-CSRS filings and staff calculations.
Source: SEC N-Q, N-CSR, N-CSRS filings and staff calculations.
Source: SEC N-Q, N-CSR, N-CSRS filings and staff calculations.
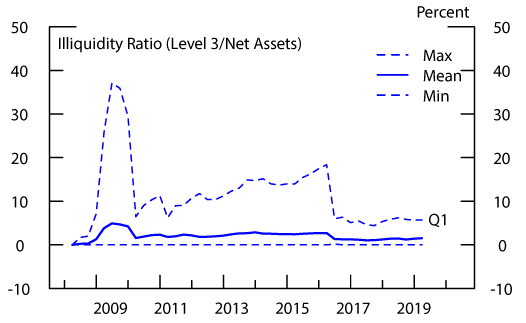
Source: SEC N-Q, N-CSR, N-CSRS filings and staff calculations.
Turning to the credit profiles, as shown in Figures 9 and 10, BL and HY MFs' allocation to the riskiest assets (that is, those rated below B and unrated) has held relatively stable over recent years. However, the relative stability at the aggregate level may mask outliers within the cross-section. Indeed, one such outlier was Third Avenue's Focused Credit Fund (FCF), a $780 million HY MF that collapsed in December 2015.
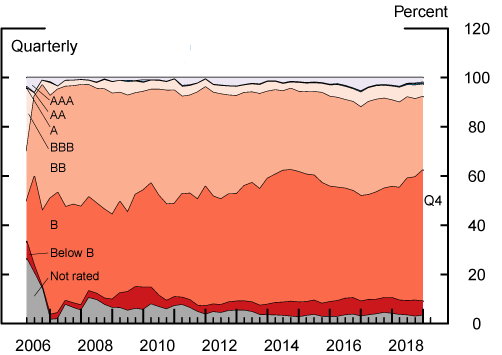
Source: Morningstar Direct
Calculated as a percent of total assets of funds reporting credit rating detail. Cash and equivalents are considered credit AAA.
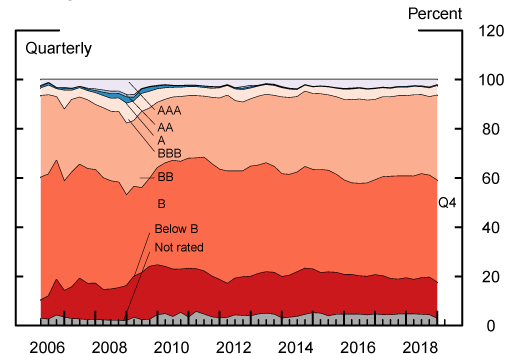
Source: Morningstar Direct
Calculated as a percent of total assets of funds reporting credit rating detail. Cash and equivalents are considered credit AAA.
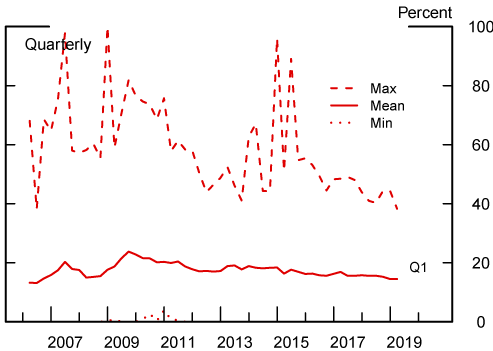
Given the possibility of outliers, we examined the range of the shares of assets rated below B and unrated across the entire BL and HY MF segments of the MF industry. As seen in Figures 11 and 12, there have been no extreme outliers like FCF since 2015.15 At the time of the FCF's collapse, about 90 percent of its bond holdings were assigned a below B rating or unrated, far above the HY MF industry's average of about 18 percent. In addition, the FCF's ratio of Level 3 assets to net assets increased from about 2 percent in January 2014 to 20 percent two months before it collapsed in December 2015. (See appendix 1).
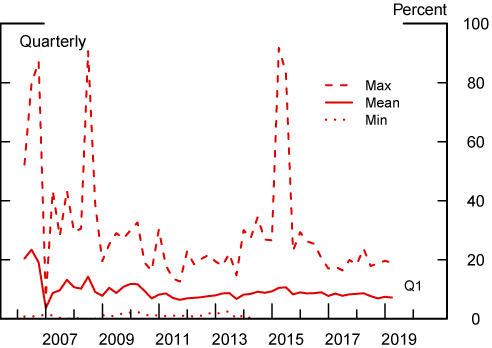
Source: Morningstar Direct
Source: Morningstar Direct
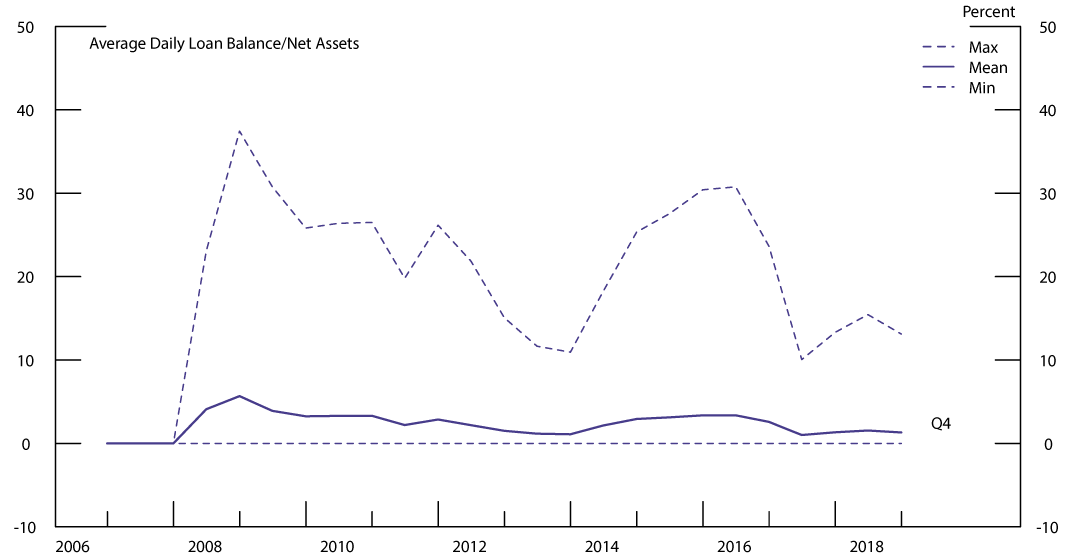
Finally, we examined the ten largest BL MFs' use of lines of credit and other borrowings over the years.16 As reported in Figure 13 below, BL MFs' leverage tends to increase during periods of stress, in particular in 2008 and 2015, which also coincided with large net outflows from the BL MF sector. This suggests that, during such periods of stress, BL MFs look to their borrowing lines to meet increased redemptions and settlement delays, although such borrowing could be used for investment purposes.17 A related concern is that funds may be forced to liquidate assets to repay borrowing commitments if they are unable to renew the lines.
Source: SEC N-CSR, N-CSRS filings and staff calculations.
5. Concluding Remarks
The growth of MFs, and BL and HY MFs in particular, have generated commentary on potential risks to financial stability arising from their liquidity transformation activities. In this note, we examined some useful indicators of funds' liquidity-risk profiles. Our findings suggest that BL MFs' liquidity risks may have risen, in the aggregate, because of increased holdings of the hardest-to-value, typically illiquid assets, amid a relatively stable level of liquid assets. For HY MFs, we find that the average levels of liquid assets have increased, while illiquid assets have declined over the years. An examination of the credit profiles of these funds suggests no extreme outliers like the Third Avenue Focused Credit Fund since 2015.
Our data also suggests that BL MFs tend to increase their borrowing during periods in which the BL MF sector experiences heightened redemptions. A related concern is that the inability to rollover credit agreements, particularly during periods of heightened redemptions, may force a BL MF to liquidate assets to meet its debt obligations, and, simultaneously, increased redemption requests. This scenario could further reinforce fire-sale dynamics.
While these indicators can serve as useful monitoring tools, more detailed data and more empirical work is needed to better understand the degree to which BL and HY MFs' liquidity (and illiquidity) profiles have evolved over the years.
References
Anadu, Kenechukwu, Mathias Kruttli, Patrick McCabe, Emilio Osambela, and Chae Hee Shin, 2018, "The shift from active to passive investing: Potential Risks to Financial Stability?," FEDS paper 2018-060.
Aramonte, Sirio, Chiara Scotti, and Ilknur Zer, forthcoming, Measuring the Liquidity Profile of Mutual Funds, International Journal of Central Banking.
Carney, Mark, 2019, "Pull, Push, Pipes: Sustainable Capital Flows for a New World Order," Institute of International Finance Spring Membership Meeting.
Chernenko, Sergey, Adi Sunderam, forthcoming, "Do Fire Sales Create Externalities? Journal of Financial Economics.
Clayton, Jay, 2019, Interview with David Rubenstein.
Ericsson, Jan, and Olivier Renault, 2006, "Liquidity and Credit Risk," Journal of Finance 61(5), 2219-2250.
Financial Accounting Standards Board, 2011, "Fair Value Measurement (Topic 820)."
Financial Stability Board, 2017, "Policy Recommendations to Address Structural Vulnerabilities from Asset Management Activities."
Financial Stability Oversight Council, 2016, "Update on Review of Asset Management Products and Activities."
Goldstein, Itay, Hao Jiang, and David T. Ng, 2017, "Investor flows and fragility in corporate bond funds," Journal of Financial Economics 126, 592-613.
International Monetary Fund, 2015, "The Asset Management Industry and Financial Stability."
Loan Syndications and Trading Association, 2019, "1Q 2019 LSTA Secondary Trading and Settlement Study."
Powell, Jerome, 2019, "Business Debt and Our Dynamic Financial System," 24th Annual Financial Markets Conference.
Securities and Exchange Commission, 2015, "Use of Derivatives by Registered Investment Companies and Business Development Companies."
Securities and Exchange Commission, 2016, "Investment Company Liquidity Risk Management Programs."
S&P Global, 2019, "Syndicated Loans: The Market and the Mechanics."
Appendix
1. Kenechukwu Anadu (Ken.Anadu@bos.frb.org), Federal Reserve Bank of Boston and Fang Cai (Fang.Cai@frb.gov), Board of Governors of the Federal Reserve System. We thank Charles Horgan, Matthew Hoops, and Shirley Wong for their excellent research assistance, and William Basset, Steffanie Brady, Jie Chen, Christine Docherty, Anna Kovner, Andreas Lehnert, Matthew Lieber, Patrick McCabe, Ralf Meisenzahl, Chiara Scotti, and Min Wei for their helpful comments. The views expressed in this note are ours and do not necessarily reflect those of the Federal Reserve Bank of Boston or Board of Governors. Return to text
2. These vulnerabilities are also salient for exchange-traded funds (ETFs) that redeem primarily in cash, which are less than three percent of the ETF universe (Anadu, Kruttli, McCabe, Osambela, and Shin (2018)). Return to text
3. The entire MF industry's holdings of leveraged loans is even larger. Indeed, as of December 2018, MFs held about $157 billion in leveraged loans. While definitions vary, "leveraged loans" are typically loans that are below investment-grade quality, have floating rates with a spread of at least 125 basis points over London Interbank Offered Rate, and are secured by specific borrower collateral (S&P Global (2019)). Return to text
4. Under normal circumstances, BL and HY MFs would be expected to invest at least 80 percent of their net assets in, respectively, floating rate loans or securities or below investment grade securities. See Investment Company Names rule, https://www.sec.gov/rules/final/ic-24828.htm Return to text
5. Net assets in BL and HY ETFs stood at $9 billion and $45 billion, respectively, as of March 2019. Unlike MFs and BL ETFs, which redeem primarily in-cash and, thus, are engaged in liquidity transformation, HY ETFs are typically redeemed in-kind. Return to text
6. A recent study found the mean par settlement time was approximately 17 business days as of March 2019. (Loan Syndications and Trading Association (2019)). Return to text
7. For BL MFs, redemptions in December 2018 as a share of lagged assets were second only to August 2011, when outflows were almost 11 percent of lagged net assets. Return to text
8. See https://www.sec.gov/rules/final/2018/ic-33142.pdf. Return to text
9. N-CSR is Certified Shareholder Report of Registered Management Investment Companies and N-Q is Quarterly Schedule of Portfolio Holdings of Registered Management Investment Company. Return to text
10. The fair value hierarchy (i.e., Level 1, Level 2, and Level 3) is a market-based measurement issued by the Financial Accounting Standards Board (FASB) in 2011. Level 1 asset values are based on quoted prices in active markets for the same asset, and Level 2 asset values are based on inputs that are significantly observable either directly or indirectly, including quoted prices for similar assets in active markets. Inputs underlying Level 3 assets are typically unobservable (See generally FASB (2011)). Return to text
11. Long-standing SEC guidance—which was codified and modified in 2016's liquidity risk management rule—generally prohibits a fund from investing greater than 15 percent of its net assets in "illiquid assets," defined as an asset that cannot be disposed of within seven days at a value that approximates its holding value. (SEC (2016)) In our examination of MF filings, we found that some funds reported their "15% illiquid assets," while others did not. This variation in disclosures across funds limits the degree to which we can use reported 15% illiquid asset to proxy the sector's holdings of illiquid assets. (See Appendix 1 for an example of a fund that reported its 15% illiquid assets, Third Avenue Focused Credit Fund.) Return to text
12. Of note, the SEC's 2016 liquidity rule permits BL MFs to classify most loans as "less liquid," which is not capped, rather than "illiquid," which cannot exceed 15 percent of a fund's total assets. Most loans are deemed to be able to sell within seven days, even though the settlement period can be significantly longer. Return to text
13. This sample represents, respectively, 62 percent and 45 percent of the BL and HY MF sectors, as of July 2018. Fund filings on N-CSR(S) and N-Q are formatted differently across funds and over time that the data are extremely difficult to collect in an algorithmic fashion (e.g., through text scraping). Return to text
14. It is worth noting that MFs that use derivatives may segregate "liquid assets" to cover the market-to-market or potential future obligations arising from such derivatives usage, which may be unavailable for other uses. See, generally, SEC (2015). Return to text
15. For HY MFs, the last spike in the maximal value corresponds to the FCF in June 2015, the only month it reported its credit rating distribution. FCF appeared to hold a large amount of Level 3 assets well before it became distressed. Specifically, 18 and 20 percent of its assets were classified as Level 3 in October 2014 and October 2015, respectively. For BL MFs, the last spike was caused by a small fund, whose share of risky holdings subsequently subsided. Return to text
16. This data is based on BL MFs' reported averaged borrowings over the reporting period and two observations per year. Therefore, it is limited. To be sure, the examination of the ten largest BL MFs shows usage of over 30 percent of net assets but in most instances utilization has been only a few percent of net assets. Moreover, we caution against drawing too strong a conclusion given the borrowing activity is driven primarily by one large BL MF. Return to text
17. Risks arising from the use of credit lines for meeting redemptions are very different from those coming from using loans to bridge settlement. However we cannot distinguish the two uses in the data. Return to text
Anadu, Kenechukwu, and Fang Cai (2019). "Liquidity Transformation Risks in U.S. Bank Loan and High-Yield Mutual Funds," FEDS Notes. Washington: Board of Governors of the Federal Reserve System, August 9, 2019, https://doi.org/10.17016/2380-7172.2412., https://doi.org/10.17016/2380-7172.2412.
Disclaimer: FEDS Notes are articles in which Board staff offer their own views and present analysis on a range of topics in economics and finance. These articles are shorter and less technically oriented than FEDS Working Papers and IFDP papers.
