FEDS Notes
February 06, 2023
Measurement and Effects of Supply Chain Bottlenecks Using Natural Language Processing1
SCB Sentiment Index (CSV) | Data definitions (TXT) (Updated: January 15, 2026)
Supply chain bottlenecks can have significant impacts on the real economy. When firms experience shortages, shipping delays, or shutdowns, as occurred during the COVID-19 pandemic, they may be unable to produce, transport, and sell their products. This can lead to demand and supply mismatches, potentially resulting in price increases and requiring firms to make difficult decisions regarding their supply chain management or scaling down operations.
Quantifying supply chain bottlenecks can be challenging due to the complexity of a firm's input-output network. While traditional measures such as lead times, freight costs, and backorders provide insight into supply chain performance, new research in economics emphasizes the value of using narratives and anecdotes in forecasting major economic events (Shiller, 2018). This study proposes a novel approach to measuring supply chain bottlenecks by analyzing narratives from the Federal Reserve's Beige Books using machine learning and natural language processing techniques. The Beige Books are a valuable source for such anecdotes due to their predictive power for GDP and employment (Armesto et al., 2009).
This note builds on several notable measures of supply chain disruptions. The Global Supply Chain Pressure Index (GSCPI), created by the Applied Macroeconomics and Econometrics Center at the Federal Reserve Bank of New York (Benigno et al. 2022), uses quantitative transportation and manufacturing survey data to produce a global measure. Young et al. 2021 measure supply chain bottlenecks across firms and industries using quarterly earnings conference calls. Most similar to this note, Kliesen and Werner (2022) develop the Beige Book Supply Chain Disruption Index (BBSCDI) by counting the frequency of supply chain-related words in the Beige Books.2
This study introduces a new measure, the Supply Chain Bottleneck Sentiment (SCB Sentiment) index, which differs in two ways. First, the list of words related to supply chain bottlenecks is generated through unsupervised machine learning and natural language processing (similar to Soto, 2021), rather than being predetermined. For example, one could identify sentences containing "supply chain," "supply chains," or "bottlenecks" as indicative of supply chain bottlenecks. However, these tokens appear 689, 86, and 270 times, respectively, across all Beige Books. Other words referring to supply chain disruptions appear just as frequently or more often, such as "shortages" (2,733 occurrences), "delays" (552 occurrences), and "disruptions" (623 occurrences). Failing to account for other words related to supply chain disruptions may underestimate the attention Beige Books give to bottlenecks. By using unsupervised methods to identify semantically and syntactically similar words to "supply chain bottlenecks," subjectivity in the creation of the lexicon is minimized.
Second, the new index takes into account the sentiment of the supply chain text using deep learning techniques. While supply chain issues are often depicted negatively in media or narratives, it is important to consider instances in which supply chain improvements or resiliencies are mentioned. For example, in the October 2022 Beige Book report, the Federal Reserve Bank of Boston noted that "for retailers as well as manufacturers, supply chain issues appeared to be relenting and inventories approached desired levels." Using deep learning text analysis, the SCB Sentiment index would classify this sentence as positive, as the word "relenting" is used to describe the "supply chain issues." Text measures of supply chain bottlenecks that simply count the presence of supply chain-related words may overestimate the actual level of disruption.
Data
The Beige Book summarizes the economic condition of each of the twelve Federal Reserve districts. The report aggregates narratives that are collected from business contacts.3 I build a dataset where each row includes the month, year, and text of the Beige Book. In addition to the Beige Book text, I also include changes in logs of the levels of the Consumer Price Index, the price of Brent crude, and industrial production for each month-year.
Finding Words Related to Supply Chain Bottlenecks
The first step of creating the measure involves finding sentences related to supply chain bottlenecks. This process is done by estimating word embeddings, which are vector representations of words that preserve their syntactic and semantic nature. That is, a well estimated word embedding model will map words with similar meanings to the same area of the vector space.
I estimate word embeddings for every unique word, also known as a token, used throughout the Beige Books using the Word2Vec algorithm.4,5 Vector arithmetic can be used to validate the fit of Word2Vec models. For example, Mikolov et al. (2013) demonstrated that the sum of the vectors for "capital" and "vietnam" was closest to the word embedding for "hanoi" in their study using the first Word2Vec model trained on internal Google data. Similarly, the following examples show the semantic and syntactic understanding of language by the Beige Book Word2Vec model:
vec(chip)+vec(technology) = vec(semiconductor)
vec(loan)+vec(home) = vec(mortgage)
vec(december)+vec(holiday) = vec(christmas)
Since the sum of two words often yields coherent results (e.g. "chip" and "technology" is most similar to "semiconductor"), it is possible to create a vector representation for a specific theme by adding phrases or words. In this study, the list of words related to supply chain bottlenecks is defined as the set of tokens near the vector, vec("supply chain") + vec("bottlenecks"). Figure 1 presents this list of words, with the size of the word indicating its frequency across the corpus. The list covers various themes related to bottlenecks, such as material and labor shortages, delays, shutdowns, and capacity constraints.
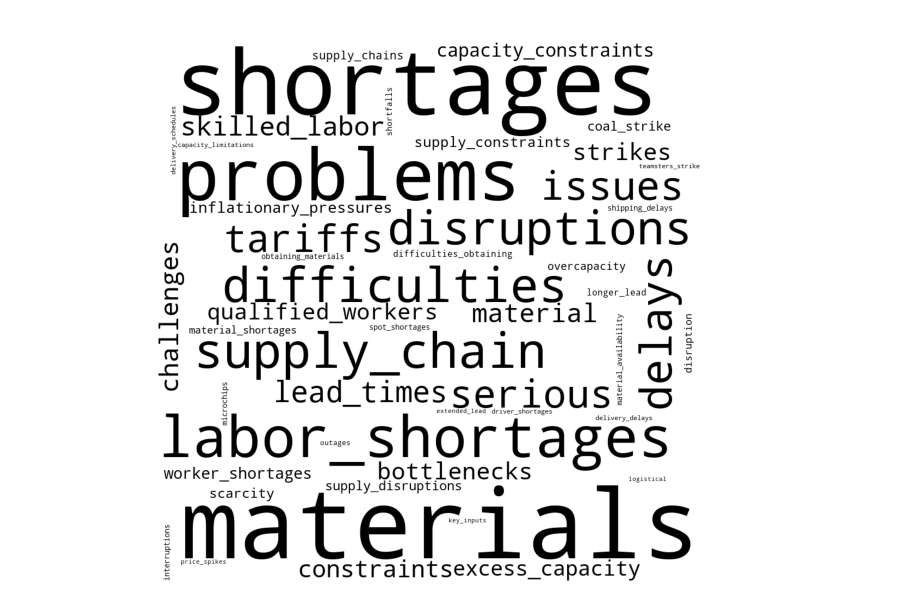
Notes: This table reports the new word list I generate by identifying the word embeddings within the neighborhood of the vec(“supply chain”)+vec(“bottlenecks”). The size of the token corresponds to its frequency over the entire sample of the Beige Books.
Classifying the Sentiment of Sentences Mentioning Supply Chain Bottlenecks
Next, I estimate the sentiment of each sentence containing at least one of the supply chain bottleneck words by applying a BERT sentiment classifier to each sentence (Devlin et al. 2018). BERT models have been demonstrated to capture sentiment more effectively than lexicons, as they account for the complexities of language, such as negation and the range of synonyms for positive and negative sentiment. In addition, BERT models can be fine-tuned to consider the nuances of different domains. One widely available BERT model, FinBERT, was trained on a financial corpus and has been shown to improve the accuracy of sentiment classification for financial texts.6 Given the financial context of the Beige Book, I use FinBERT to classify the sentiment of supply chain bottleneck sentences.
Figure 2 shows the Supply Chain Bottleneck Sentiment Index (SCB Sentiment- total negative sentences minus total positive sentences, divided by total sentences) for each Beige Book publication. Supply chains were stressed in the 1970s after the oil embargo and increases in oil prices. Supply chain issues reappeared at the beginning of the millennium with chip shortages. Most recently, bottlenecks arose during the COVID-19 pandemic. The index suggests that the bottlenecks arising from the pandemic have been ebbing since the latter half of 2021. This is in line with other measures of supply chain bottlenecks, such as supplier delivery times and order backlogs provided by the Institute for Supply Management.
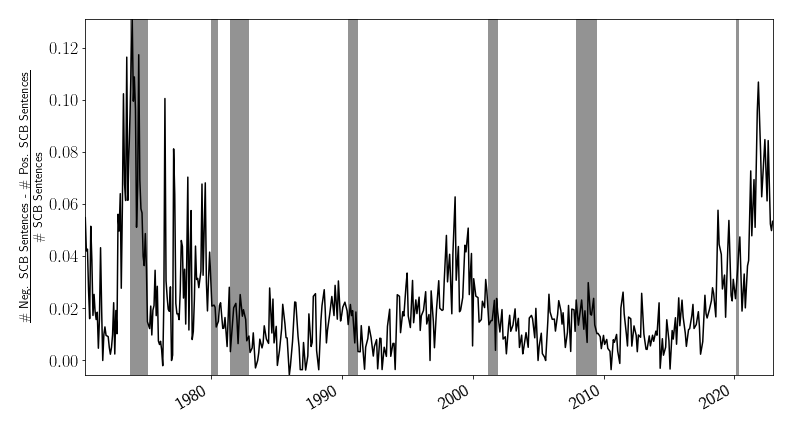
Notes: This chart shows the SCB Sentiment, defined as the total number of negative sentences minus the total number of positive sentences about supply chain bottlenecks, divided by the total number of sentences about supply chain bottlenecks.
Shaded bars indicate periods of business recession as defined by the National Bureau of Economic Research (NBER): December 1969–November 1970, November 1973–March 1975, January 1980–July 1980, July 1981–November 1982, July 1990–March 1991, March 2001–November 2001, December 2007–June 2009, and February 2020–April 2020.
Supply Chain Bottlenecks and Inflation
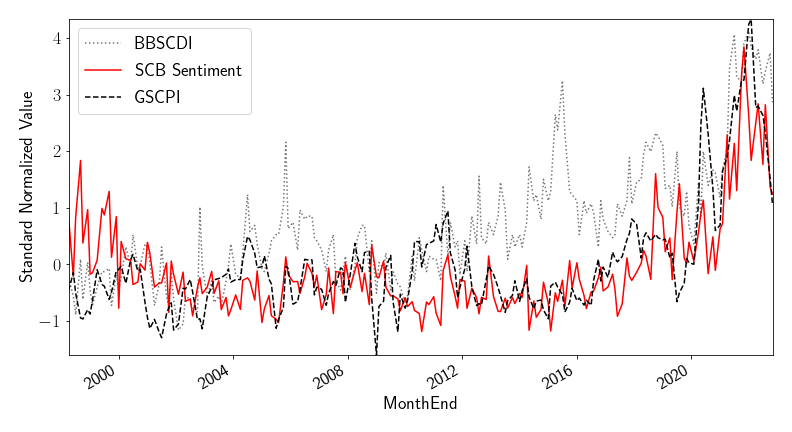
Supply chain bottlenecks can impact the availability of goods and potentially result in higher inflation. I use the SCB Sentiment score to assess the link between supply chain bottlenecks and inflation. Table 1 shows how the new index at time t is associated with monthly inflation growth at t+1. Recall that higher values of the SCB Sentiment index correspond to more negative sentiment about supply chain bottlenecks. In column (1), we see a positive and significant relationship with SCB Sentiment and inflation after accounting for lagged changes in inflation and oil prices. Given that supply chain bottlenecks are related to industrial production, in column (2) I include the lagged changes in industrial production growth. Controlling for lagged CPI, oil, and IP dynamics do not seem to hamper the significance or magnitude of the coefficient on the new index. In columns (3) and (4), I include two prominent supply chain indices, the BBSCDI and GSCPI (available from 1998), resulting in little change to the coefficient. Figure 3 presents the time series of the SCB Sentiment, as well as the BBSCDI and GSCPI. All three indices show a rapid increase during the COVID-19 pandemic, but exhibit different tendencies earlier in the sample.
Table 1: Regressing CPI on Supply Chain Bottleneck Sentiment
| (1) | (2) | (3) | (4) | |
|---|---|---|---|---|
| Dependent Variable: Δlog(CPI)t+1 | ||||
| SCB Sentimentt | 0.162** | 0.181*** | 0.178*** | 0.175** |
| -0.068 | -0.067 | -0.069 | -0.082 | |
| BBSCDIt | 0.003 | 0.022 | ||
| -0.042 | -0.06 | |||
| GSCPIt | 0.137* | |||
| -0.077 | ||||
| CPI Lags | Y | Y | Y | Y |
| Oil Lags | Y | Y | Y | Y |
| IP Lags | N | Y | Y | Y |
| Observations | 261 | 261 | 261 | 198 |
| R-squared | 0.332 | 0.351 | 0.351 | 0.396 |
Notes: SCB Sentimentt is the total number of negative sentences minus the total number of positive sentences about supply chain bottlenecks, divided by the total number of supply chain bottleneck sentences reported in the Beige Book of month t. BBSCDIt and the GSCPIt are the Beige Book Supply Chain Disruption Index (Kliesen and Werner 2022) and the Global Supply Chain Pressure Index (Benigno et al. 2022).
To better understand the dynamics of a shock to supply chain bottlenecks, I estimate a Bayesian Vector Autoregression with IP, oil price and CPI growth. I include two lags for each of the four variables and allow for time-varying coefficients as in (Primiceri 2005).7
$$$$\left[\begin{matrix}SCDisruption_t\\\Delta{IP}_t\\\Delta O i l_t\\\Delta C P I_t\\\end{matrix}\right]=\mathbf{\alpha}_\mathbf{t}+\mathbf{\beta}_{\mathbf{1},\mathbf{t}}\left[\begin{matrix}SCDisruption_{t-1}\\\Delta{IP}_{t-1}\\\Delta O i l_{t-1}\\\Delta C P I_{t-1}\\\end{matrix}\right]+\mathbf{\beta}_{\mathbf{2},\mathbf{t}}\left[\begin{matrix}SCDisruption_{t-2}\\\Delta{IP}_{t-2}\\\Delta O i l_{t-2}\\\Delta C P I_{t-2}\\\end{matrix}\right]+\mathbf{\varepsilon}_\mathbf{t}$$$$
Where $$\mathbf{\alpha}_\mathbf{t}$$ and $$\mathbf{\beta}_{\mathbf{k},\mathbf{t}}$$ are time-varying parameters with $$\mathbf{\alpha}_\mathbf{t}=\mathbf{\alpha}_{\mathbf{t}-\mathbf{1}}+\mathbf{\zeta}_\mathbf{t}$$ and $$\mathbf{\beta}_{\mathbf{k},\mathbf{t}}=\mathbf{\beta}_{\mathbf{k},\mathbf{t}-\mathbf{1}}+\mathbf{\nu}_\mathbf{t}$$. $$SCDisruption_t$$ is one of three supply chain bottleneck measures: the new index, the BBSCDI, and the GSCPI.
In Figure 4, we see that a shock to SCB Sentiment significantly drives up the monthly inflation growth. The slow decay is consistent with the lasting effects of supply chain pressures that buildup and take time to manifest in prices. The BBSCDI does not exhibit similar nor significant movements in inflation, potentially due to the lexicon for supply chain words, or the ambiguity in whether mentions of supply chains is generally positive or negative. The GSCPI shock exhibits a more pronounced impact on inflation, and less swift return to the baseline. Considering that the new index focuses on the U.S. while the GSCPI has a global scope, the slower decay of the GSCPI shock illustrates the intricate nature and enduring effect of bottlenecks in global supply chains.
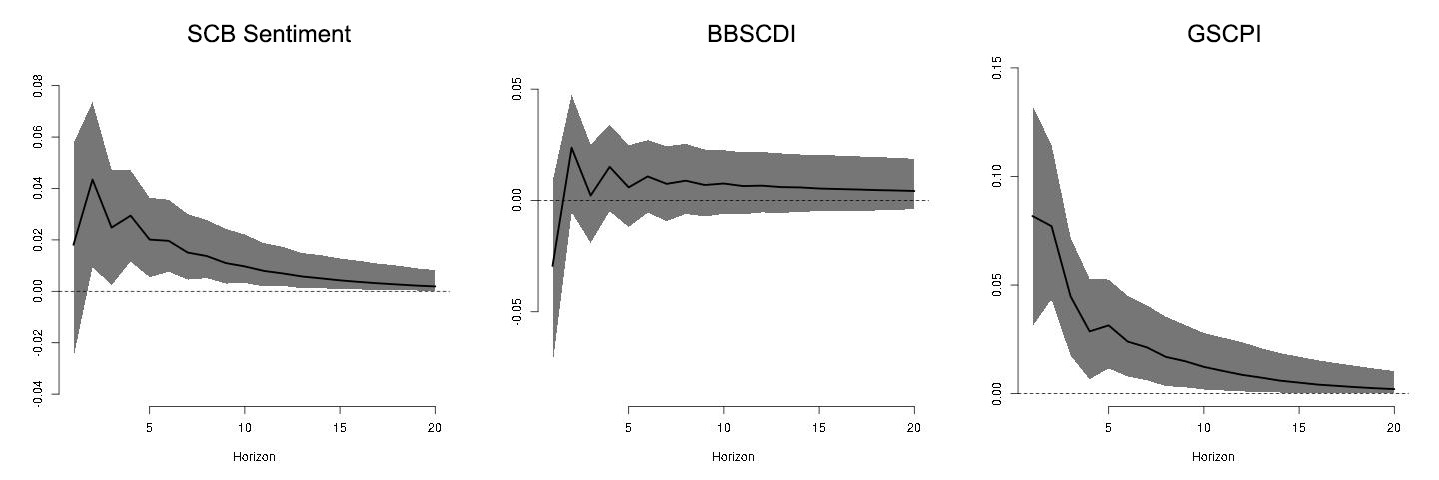
Notes: These figures show the impulse response of inflation using a time-varying parameter Bayesian VAR (Primiceri 2005). The model includes two lags of the following four variables: a supply chain bottleneck measure, the growth rate of industrial production, growth rate of oil prices, and the growth rate of CPI. Each figure corresponds to one of the supply chain bottleneck measures. SCB Sentimentt is the total number of negative sentences minus the total number of positive sentences about supply chain bottlenecks, divided by the total number of supply chain bottleneck sentences reported in the Beige Book of month t. BBSCDIt and the GSCPIt are the Beige Book Supply Chain Disruption Index (Kliesen and Werner 2022) and the Global Supply Chain Pressure Index (Benigno et al. 2022). Shaded areas represent 10-90 percent confidence intervals.
Conclusion
This note presented a new measure of supply chain bottlenecks, the Supply Chain Bottleneck Sentiment (SCB Sentiment) index, which utilizes unsupervised machine learning and natural language processing techniques to identify words related to supply chain bottlenecks in the Federal Reserve's Beige Book and uses deep learning to account for the sentiment of the identified supply chain text. The SCB Sentiment index was found to be positively and significantly associated with future inflation after controlling for lagged changes in inflation, oil prices, and industrial production. This new measure of supply chain bottlenecks adds to the existing literature by providing a more comprehensive and sentiment-aware approach to assessing the impact of supply chain disruptions on the economy.
References
Armesto, M.T., Hernández‐Murillo, R., Owyang, M.T. and Piger, J., 2009. Measuring the information content of the beige book: A mixed data sampling approach. Journal of Money, Credit and Banking, 41(1), pp.35-55.
Benigno, G., di Giovanni, J., Groen, J.J. and Noble, A.I., 2022. The GSCPI: A New Barometer of Global Supply Chain Pressures. FRB of New York Staff Report, (1017).
Devlin, J., Chang, M.W., Lee, K. and Toutanova, K., 2018. Bert: Pre-training of deep bidirectional transformers for language understanding. arXiv preprint arXiv:1810.04805.
Kliesen, K.L. and Werner, D., 2022. Using Beige Book Text Analysis to Measure Supply Chain Disruptions. Economic Synopses, (18).
Mikolov, T., Sutskever, I., Chen, K., Corrado, G.S. and Dean, J., 2013. Distributed representations of words and phrases and their compositionality. Advances in neural information processing systems, 26.
Primiceri, G.E., 2005. Time varying structural vector autoregressions and monetary policy. The Review of Economic Studies, 72(3), pp.821-852.
Soto, P.E., 2021. Breaking the Word Bank: Measurement and Effects of Bank Level Uncertainty. Journal of Financial Services Research, 59(1), pp.1-45.
Shiller, R.J., 2017. Narrative economics. American Economic Review, 107(4), pp.967-1004.
Young, H.L., Monken, A., Haberkorn, F. and Van Leemput, E., 2021. Effects of supply chain bottlenecks on prices using textual analysis.
1. The analysis and conclusions set forth are those of the author and do not indicate concurrence by other members of the research staff or the Board of Governors. I thank Flora Haberkorn and Isabel Kitschelt in the International Finance Division for providing the dataset on the Beige Book text. The note benefited from comments and suggestions by Tomaz Cajner, Christopher J. Kurz and Stacey Tevlin. Return to text
2. The index counts the frequency of the following words: "supply chain-," "bottleneck-," "bottle neck-," "backlog-," "port-," "unfilled order-," "delivery time-," "supply delay-," "truck-," "boat-," or "transportation." Return to text
3. See https://www.federalreserve.gov/monetarypolicy/beige-book-faqs.htm for further information on the Beige Books. Return to text
4. I preprocess the text by applying a sentence tokenizer to isolate individual sentences and remove any non-alphanumeric characters from each sentence. I also include bigrams, defined as any sequence of two words that appear at least five times throughout the corpus. I keep stopwords in the text to assist the Word2Vec algorithm in finding syntactically and semantically similar words. Return to text
5. The word embeddings are estimated using a window size of 10 and a dimension size of 300. For further details on Word2Vec, see Mikolov et al. 2013. Return to text
6. Available at https://github.com/ProsusAI/finBERT Return to text
7. I estimate the Bayesian VAR using MCMC with 30,000 iterations, with 10,000 burn-in and a thinning size of 50. Since the GSCPI is available from 1998 onward, I use the 1998-2022 sample. The priors are estimated using the first 50 observations. Return to text
Paul E. Soto (2023). "Measurement and Effects of Supply Chain Bottlenecks Using Natural Language Processing," FEDS Notes. Washington: Board of Governors of the Federal Reserve System, February 06, 2023, https://doi.org/10.17016/2380-7172.3257.
Disclaimer: FEDS Notes are articles in which Board staff offer their own views and present analysis on a range of topics in economics and finance. These articles are shorter and less technically oriented than FEDS Working Papers and IFDP papers.