FEDS Notes
December 01, 2023
Monetary Policy Tightening and Debt Servicing Costs of Nonfinancial Companies
Yuriy Kitsul, Bill Lang and Mehrdad Samadi1
I. Introduction
Rapid monetary policy tightening in most advanced economies in 2022 and 2023 was accompanied by substantial increases in prevailing interest rates for new credit to businesses and households. In addition to increasing the cost of new borrowing, monetary policy tightening may also be associated with increases in costs of servicing existing debt, potentially leading to the tightening of firms' and households' financial constraints, leaving them with less cash for investment and consumption. Academic studies argue that such transmission from policy rates to costs of servicing existing debt, especially for firms with significant floating rate debt, is an important mechanism through which monetary policy affects firms' economic activity and the broader economy (Ippolito, Ozdagli, and Perez-Orive 2018; and Gürkaynak, Karasoy-Can, and Lee 2022; among others). This note assesses the passthrough of monetary policy tightening to costs of servicing existing debt for publicly traded nonfinancial corporates (NFCs) in select Advanced Economies (AEs) over the current tightening cycle (through 2023:Q1) and compares such passthrough to that for rates on new borrowing, as well as to passthrough over previous tightening cycles.
We show that, as AE central banks were raising policy rates, the cost of existing debt generally increased at a much slower rate than rates on new borrowing. Some observers have argued that policy rate passthrough to existing debt cost over the current tightening cycle could be particularly slow because it was preceded by a period of very low interest rates, as well as unprecedented monetary and fiscal support following the onset of COVID-19 pandemic, allowing companies to secure cheap financing over long horizons and build up their cash reserves.2 Our results through the first five quarters of tightening indicate that the speed of passthrough to existing debt is comparable to historical cycles dating back to 2003: Using firm-cycle panel regressions, we find that estimates of passthrough coefficients over the current cycle are statistically indistinguishable from those over previous tightening cycles. We also find that the strength of passthrough does vary across firms. For example, firms that (1) are less reliant on bank debt, which tend to carry predominately floating rates of interest, and (2) had higher cash holdings, and thus did not need to issue as much new debt, experienced significantly weaker passthrough than firms with a higher proportion of their debt in the form of bank loans and with lower cash holdings during the current tightening cycle. In addition, substantial corporate cash holdings that firms had at the onset of tightening have since declined, and firms experiencing stronger passthrough have seen their ability to service debt payments with current earnings deteriorate.
Looking forward, the aggregate maturity schedule of outstanding NFC corporate bonds is gradually distributed over future horizons, indicating that, at least for nonfinancial firms predominantly relying on issuing fixed-rate corporate bonds, the passthrough from higher policy rates to NFC borrowing costs when these bonds mature and are potentially refinanced will continue to be gradual. That said, if rates remain higher for longer, liquidity positions even for such firms may continue to deteriorate, contributing to worsening of corporate financial vulnerabilities.
II. Monetary policy passthrough to new and existing borrowing costs
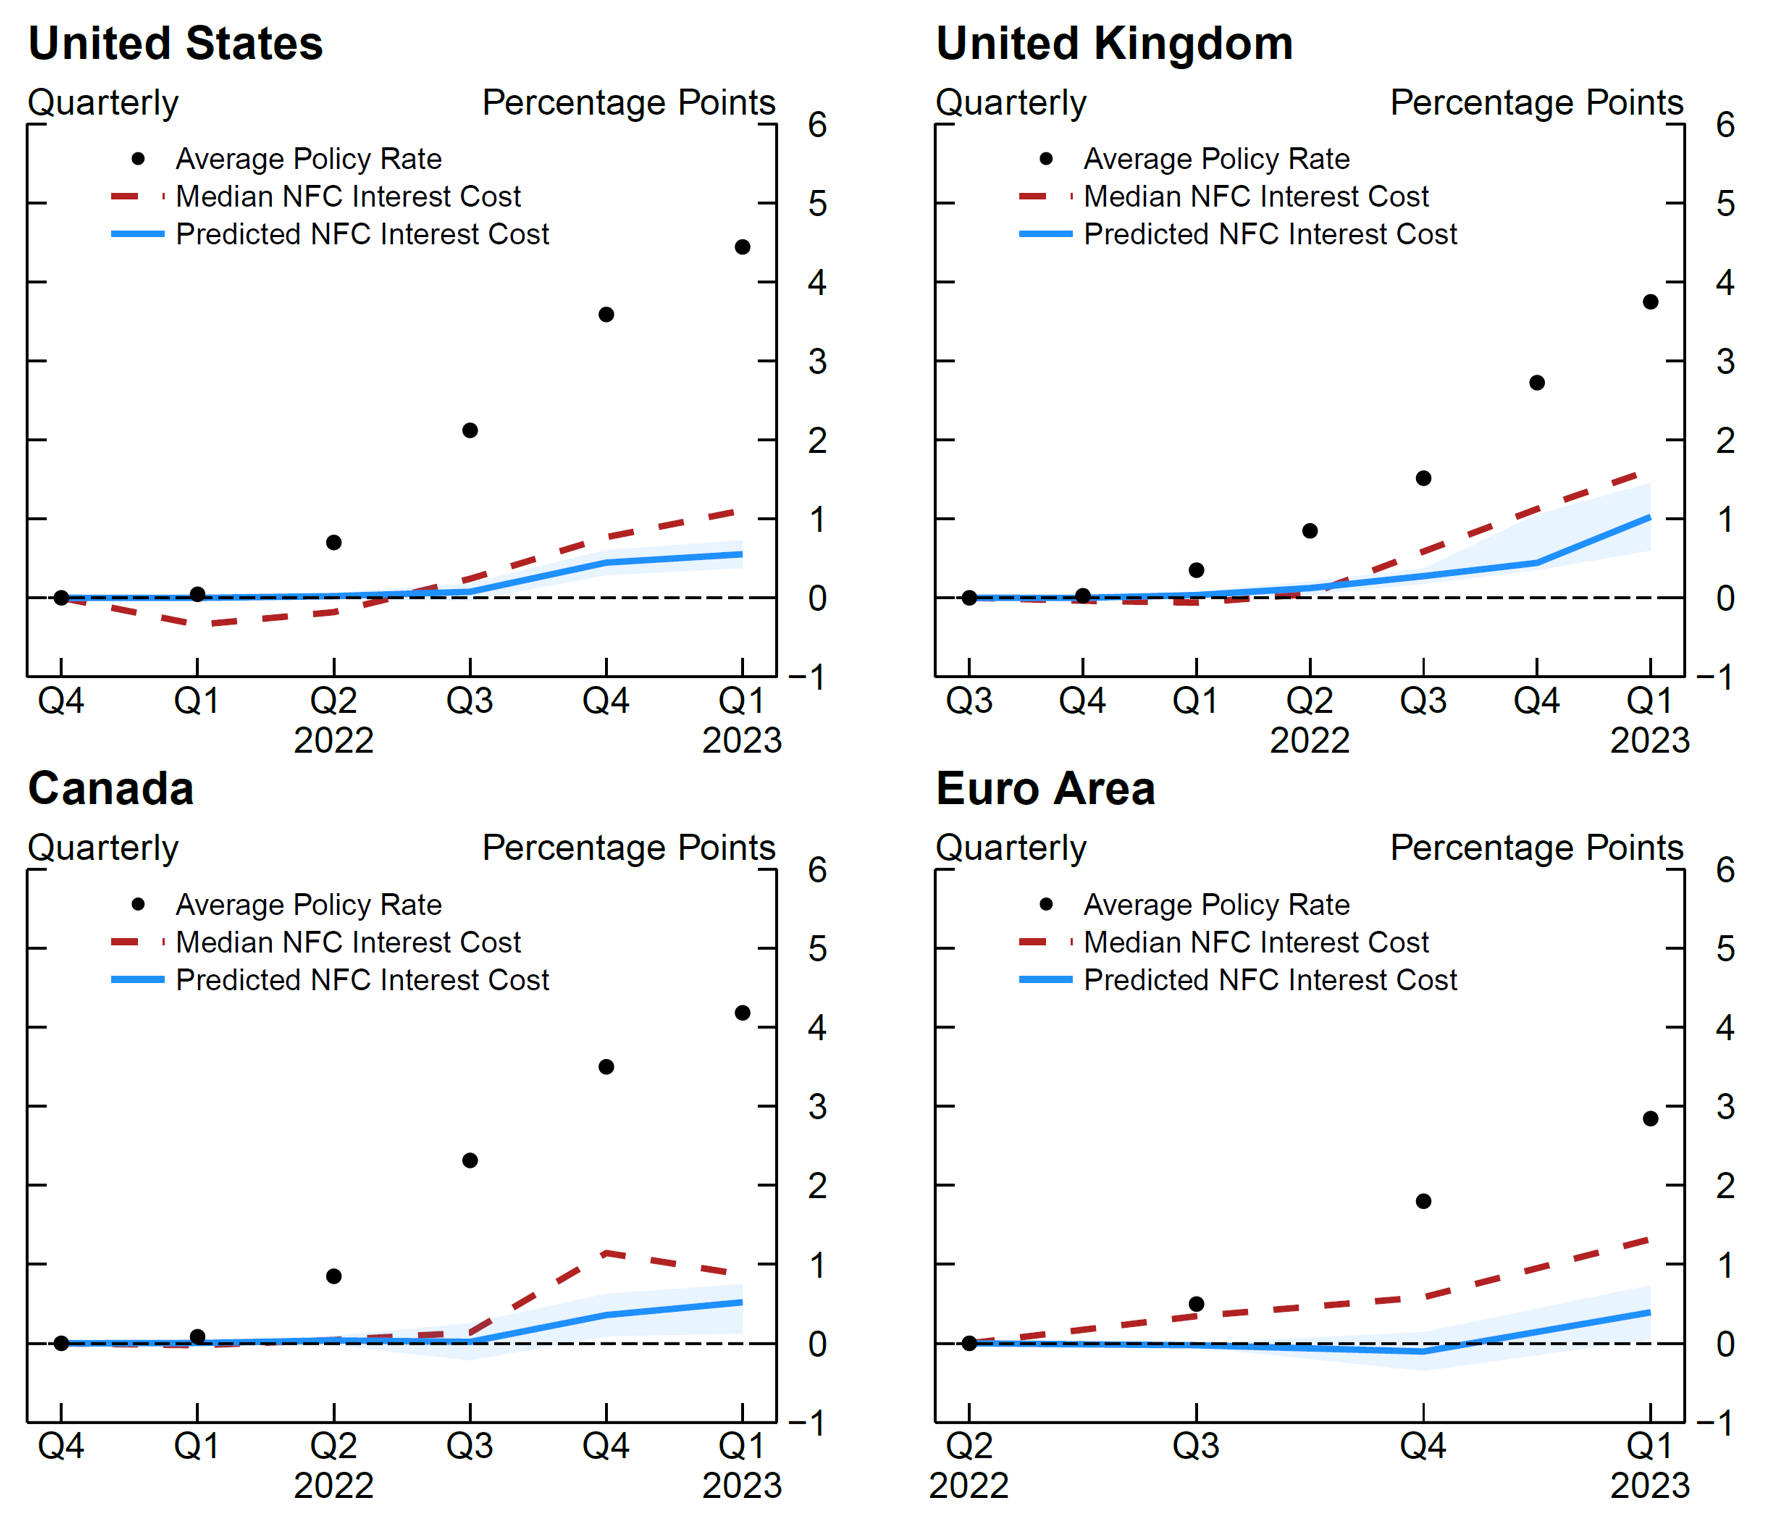
Figure 1 displays the cumulative increases in policy rates, two measures of new borrowing costs, and a measure of existing debt servicing cost for four advanced economies, with the first data point corresponding to the quarter before the current tightening cycle started and the last data point corresponding to 2023:Q1.3 The black dots display the cumulative increases in the quarterly average central bank policy rate. Through 2023:Q1, policy rates increased, respectively, about 4.5, 4, 4, and 3 percentage points in the U.S., U.K., Canada, and the Euro area. Quarterly average rates on new NFC bank loans (yellow dotted lines) closely followed policy rates as bank loans often have reference rates that are tightly linked to policy rates (Ippolito, Ozdagli, and Perez-Orive 2018). Quarterly average 5-year yields on BBB-rated corporate bonds (blue solid lines) have increased more than policy rates, likely reflecting risk premiums embedded in 5-year maturities. Thus, the passthrough to new borrowing costs as reflected by new bank loan rates and corporate bond yields has been robust.

Note: Median NFC Interest Cost is annualized quarterly interest expense to total debt. U.S. New Bank Loan Rates are based on posted prime loan rates.
Source: Federal Reserve H. 15, Bank of England, Bank of Canada, ECB Statistical Data Warehouse, S&P Capital IQ, Bloomberg, Board staff calculations.
By contrast, the cumulative increases in the cost of servicing existing NFC debt (red dashed lines), defined as the annualized interest expense scaled by total debt (interest cost) for the median firm, has been significantly smaller than increases in the costs of new borrowing.4 If a firm's debt capital structure was comprised entirely of bank loans, we would expect passthrough to the cost of servicing existing debt to be much higher as loan reset dates typically occur every one to three months for bank loans to NFCs.
III. Is passthrough to NFC debt servicing costs slower in the current cycle?
Market commentaries have suggested that firms extending the maturity of their fixed rate debt during the COVID-19 pandemic taking advantage of low rates could have led to slower passthrough to NFC debt servicing costs in the current tightening cycle. Figure 2 compares median interest costs of firms during the current tightening cycle (red dashed lines) to interest costs predicted by historical passthrough in previous tightening cycles.5 We use the mean evolution in previous tightenings of historical firm-cycle-level ratios of the cumulative increase in interest cost to cumulative increase in policy rates to predict how much NFC interest costs would rise given the increase in policy rates during the current tightening cycle. We also compute a confidence interval around these predictions. The blue solid lines and shaded areas represent predicted interest cost implied by mean and 95% confidence interval of historical firm-cycle-level passthrough estimates, respectively. While over the first two quarters of tightening, monetary policy passthrough in the U.S. visually appeared slightly slower than that of previous cycles, passthrough in AEs through 2023:Q1 generally is comparable to, and even somewhat faster than, that over historical experience since 2003.
Note: Predicted NFC Interest Costs are obtained by multiplying the quarterly cumulative increase in policy rates during the current tightening cycle by the quarterly mean and 95% confidence interval of historical firm-level passthrough estimates through each quarter of tightening. We use historical tightening cycles that began in 2004:Q2 and 2015:Q4 for the U.S., 2003:Q4 and 2006:Q3 for the U.K., 2004:Q3 and 2017:Q3 for Canada, and 2005:Q4 for the Euro area. Median NFC Interest Cost is annualized quarterly interest expense to total debt. Shaded areas represent NFC Interest Cost implied by 95% confidence interval of historical firm-level passthrough.
Source: Bloomberg; S&P Capital IQ; Board Staff Caclulations.
To quantitatively compare passthrough during the current tightening cycle to similar points of 6 historical tightening cycles across the U.S., U.K., and Canada, we use a regression for firm i and the first five quarters of each tightening cycle t:t-5.
$$$$ \frac{\Delta INTCOST_{i,t:t-5}}{\Delta POLICYRATE_{i,t:t-5}} = \alpha + \beta_1 1_{cc} + \epsilon_{i,t:t-5} $$$$
The dependent variable is the ratio of the cumulative increase in interest cost to cumulative increase in policy rates though five quarters of monetary policy tightening, which we label the cumulative passthrough beta.6,7 On the right hand side, $$ 1_{cc} $$ is an indicator variable equal to one for the current tightening cycle and equal to zero otherwise. The coefficient of interest is $$ \beta_1 $$ which measures the difference in passthrough between the current tightening cycle and recent historical tightening cycles. If there was no difference $$ (\beta_1 = 0) $$ and additionally if $$ \alpha = 1 $$ this would indicate that interest costs increased by the same magnitude as policy rates. The results are presented in Table 1.
Despite reports of firms extending their debt maturity during the post-pandemic bond issuance boom, passthrough to the cost of existing debt is statistically indistinguishable from previous tightening cycles through five quarters, as we cannot reject the null hypothesis that $$ \beta_1 = 0 $$ . The estimate of the constant term also corroborates the visual evidence shown in Figure 2 suggesting that over early stages of recent policy tightening cycles, interest costs increased significantly less than policy rates.8
Table 1: Is Passthrough to NFC Debt Servicing Costs Slower in the Current Cycle?
| Cumulative Passthrough Beta | |
|---|---|
| Constant ($$\alpha$$) | 0.217*** |
| (0.028) | |
| Current Cycle Indicator ($$\beta_1$$) | 0.016 |
| (0.035) | |
| Observations | 4,020 |
| R2 | 0.001 |
*p<0.1; **p<0.05; ***p<0.01
Note: We use historical tightening cycles that began in 2004:Q2 and 2015:Q4 for the U.S., 2003:Q4 and 2006:Q3 for the U.K., 2004:Q3 and 2017:Q3 for Canada.
Source: S&P Capital IQ, Bloomberg, Board staff calculations.
IV. Firms with more cash, less bank debt experienced slower passthrough
There may be heterogeneity in monetary tightening passthrough across firms with different capital structures and balance sheet positions, which we examine for the current tightening cycle using the following firm-level regression:
$$$$ \frac{\Delta INTCOST_{i,t:t-5}}{\Delta POLICYRATE_{i, t:t-5}} = \alpha_{country} + \beta_1 Cash_{i,t-5} + \beta_2 BankDebt_{i,t-5} + Controls + \epsilon_{i,t:t-5} $$$$
For the same dependent variable, the regression now includes country fixed effects and several explanatory variables that are measured as of the quarter preceding each tightening cycle. The first explanatory variable is the ratio of cash and short-term investments to assets (Cash). Harford, Klasa, and Maxwell (2014) find that firms mitigate refinancing risk by increasing their cash holdings; firms with large cash holdings can delay obtaining new financing at prevailing market rates to finance new investment. Bank loans are predominately floating rate obligations whose debt servicing costs should reflect increases in policy rates in contrast to fixed rate obligations such as corporate bond issuances; we use the ratio of bank debt to total debt (Bank Debt) to capture this effect. Additional control variables include Net Leverage, the ratio of the difference between total debt and cash, and short-term investments to assets. While debt levels reached an all-time high during the COVID-19 pandemic, Benmelech (2021) argues that low interest rates led firms to hoard cash, resulting in less pronounced increases in net leverage. The controls also include an Investment Grade indicator variable equal to one for investment grade debt and zero otherwise and the book value of assets. Standard errors are clustered by industry. Table 2 presents the results.
Table 2: Empirical Determinants of NFC Passthrough during Current Tightening Cycle
| Cumulative Passthrough Beta | |
|---|---|
| Cash | -0.221*** |
| (0.079) | |
| Bank Debt | 0.435*** |
| (0.044) | |
| Net Leverage | 0.001 |
| (0.001) | |
| Investment Grade | -0.024 |
| (0.043) | |
| Size | 0.022*** |
| (0.008) | |
| Country Fixed Effects | Yes |
| Observations | 3,830 |
| R2 | 0.062 |
*p<0.1; **p<0.05; ***p<0.01
Note: Cash is the ratio of cash and short term investments to assets, Bank Debt is the ratio of bank debt to total debt, Net Leverage is the ratio of difference between total debt and cash and short term investments to assets, Investment Grade is an indicator variable equal to one for investment grade debt and zero otherwise, and Size is log of the book value of assets. Standard errors (in parentheses) are clustered by industry.
Source: S&P Capital IQ, Bloomberg, Board staff calculations.
We find that firms that entered the current tightening cycle with more cash holdings and less bank debt experienced significantly slower passthrough to their cost of servicing existing debt. When sorting firms into terciles based on their pre-tightening cash holdings and bank debt, we find that for a one percentage point increase in policy rates, firms in the top tercile of bank debt (bottom tercile of cash holdings) experienced an additional 32 (19) basis point increase in their interest cost relative to firms in the bottom tercile of bank debt (top tercile of cash holdings) during the current tightening cycle.9
V. Liquidity positions of firms with strong passthrough have degraded
We next examine the relationship between firms' liquidity positions and the strength of passthrough from higher policy rates to debt servicing costs. To assess liquidity positions, we examine firms' interest coverage ratios (ICRs), which are defined as the ratio of earnings before interest, taxes, depreciation, and amortization (EBITDA) to interest expense, and measures the ability of firms to service debt payments with internal cash flows.10 The figure below groups firms into terciles by the strength of passthrough to their existing stock of debt in the current tightening cycle and reports the cumulative change in firm median ICRs since the start of each country's tightening cycle.
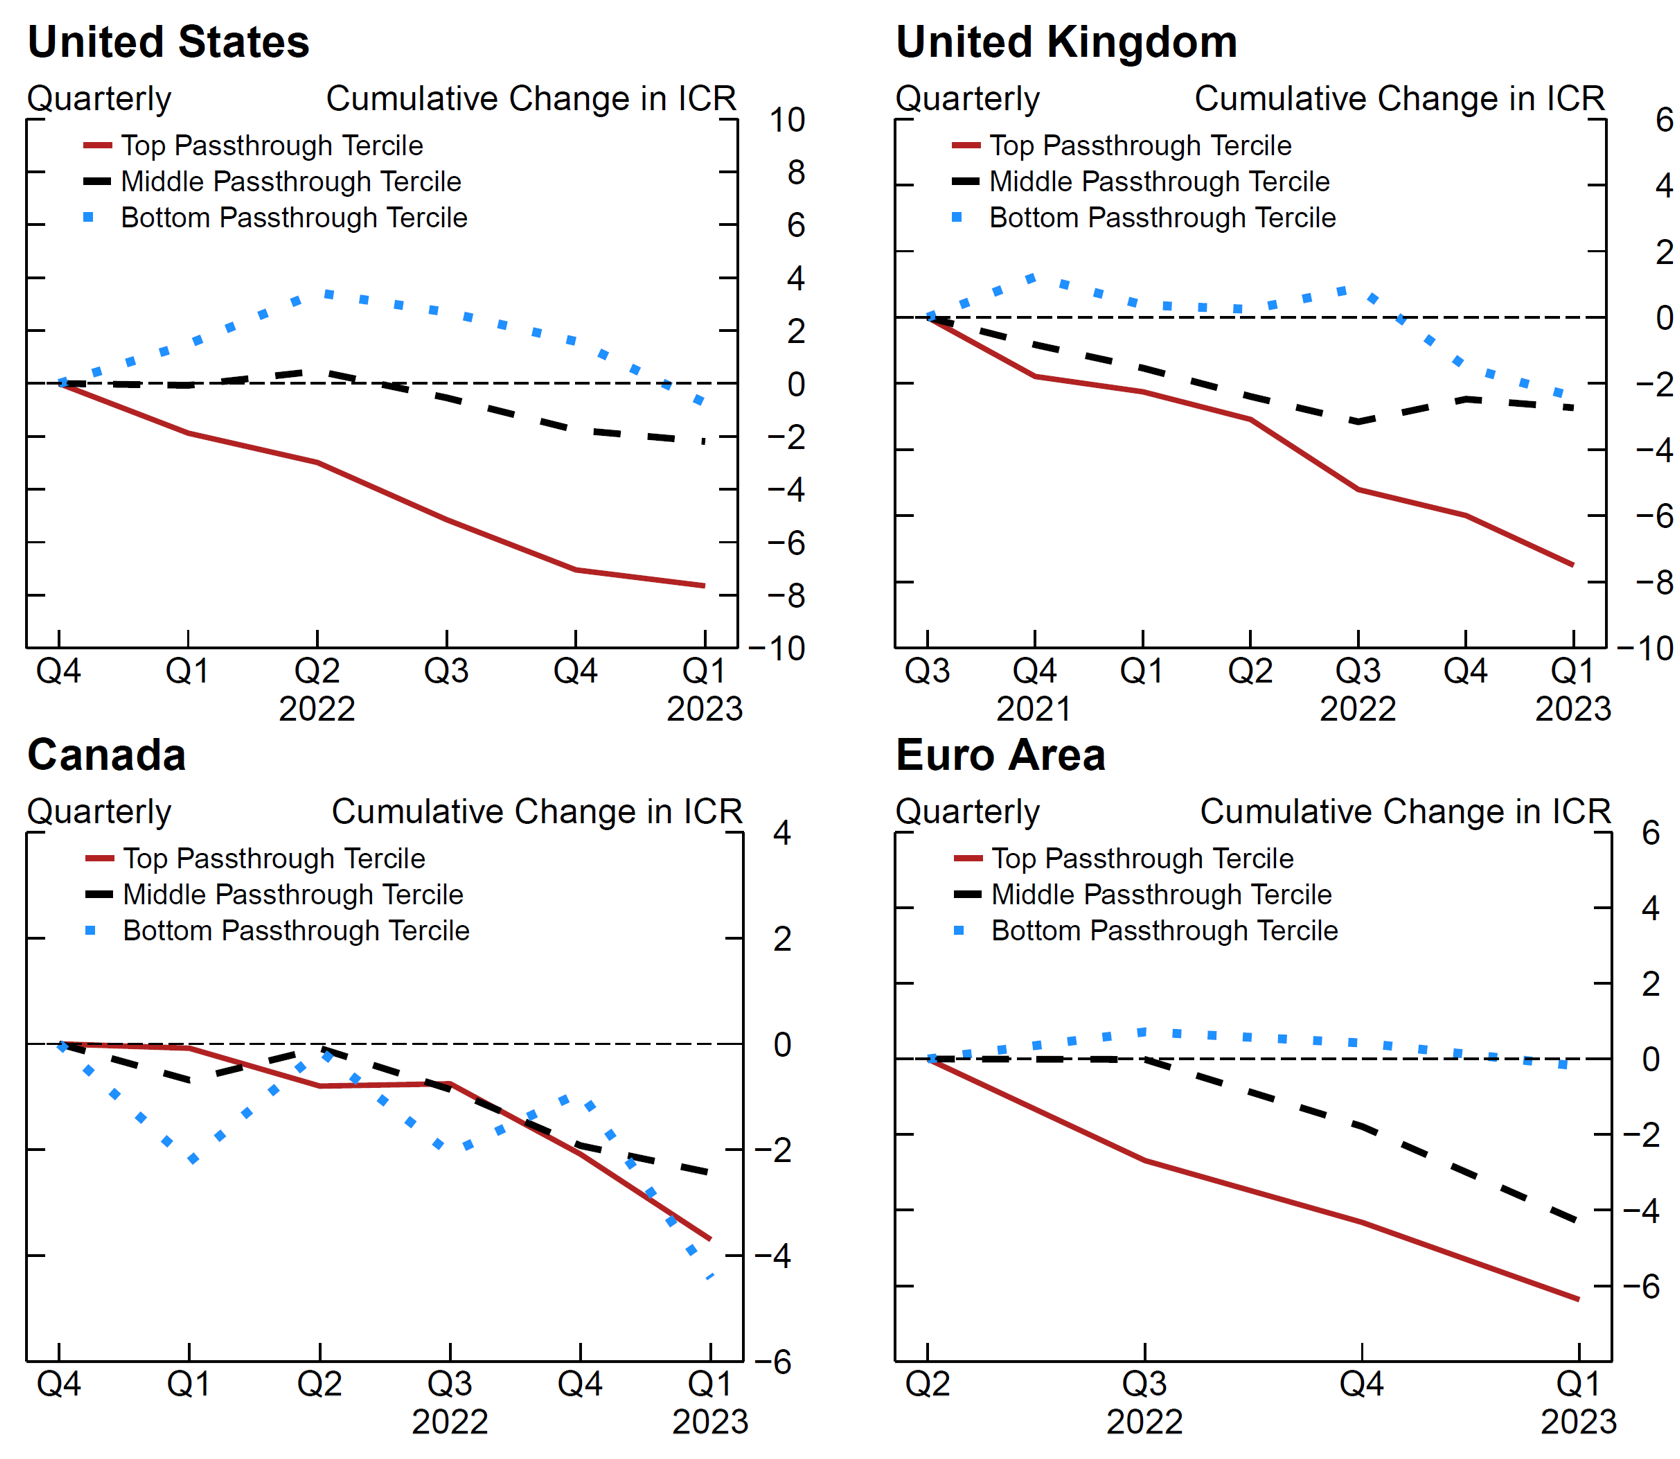
Note: Interest coverage ratio is calculated as EBITDA/Interest Expense.
Source: S&P Capital IQ, Bloomberg, Board staff calculations.
While firms in the weakest passthrough tercile (blue dotted lines) did not experience a degradation in ICRs since on onset of tightening, the liquidity position of firms with relatively stronger passthrough (red solid lines) deteriorated significantly as evidenced by the cumulative decline in ICRs. While ICRs have declined for some firms, in unreported analysis we find that ICRs have largely not reached critical levels suggested by Beltran and Collins (2018) and Palomino et al. (2019) in aggregate through the end of 2023:Q1.
VI. Substantial cash buffers at the onset of tightening have declined
Firms that are unable to service debt with earnings can still draw from existing cash buffers. To further assess liquidity positions of NFCs, we also examine the evolution of NFC cash and short-term investments scaled by total assets for firms in select percentiles through 2023:Q1, reported in the figure below.
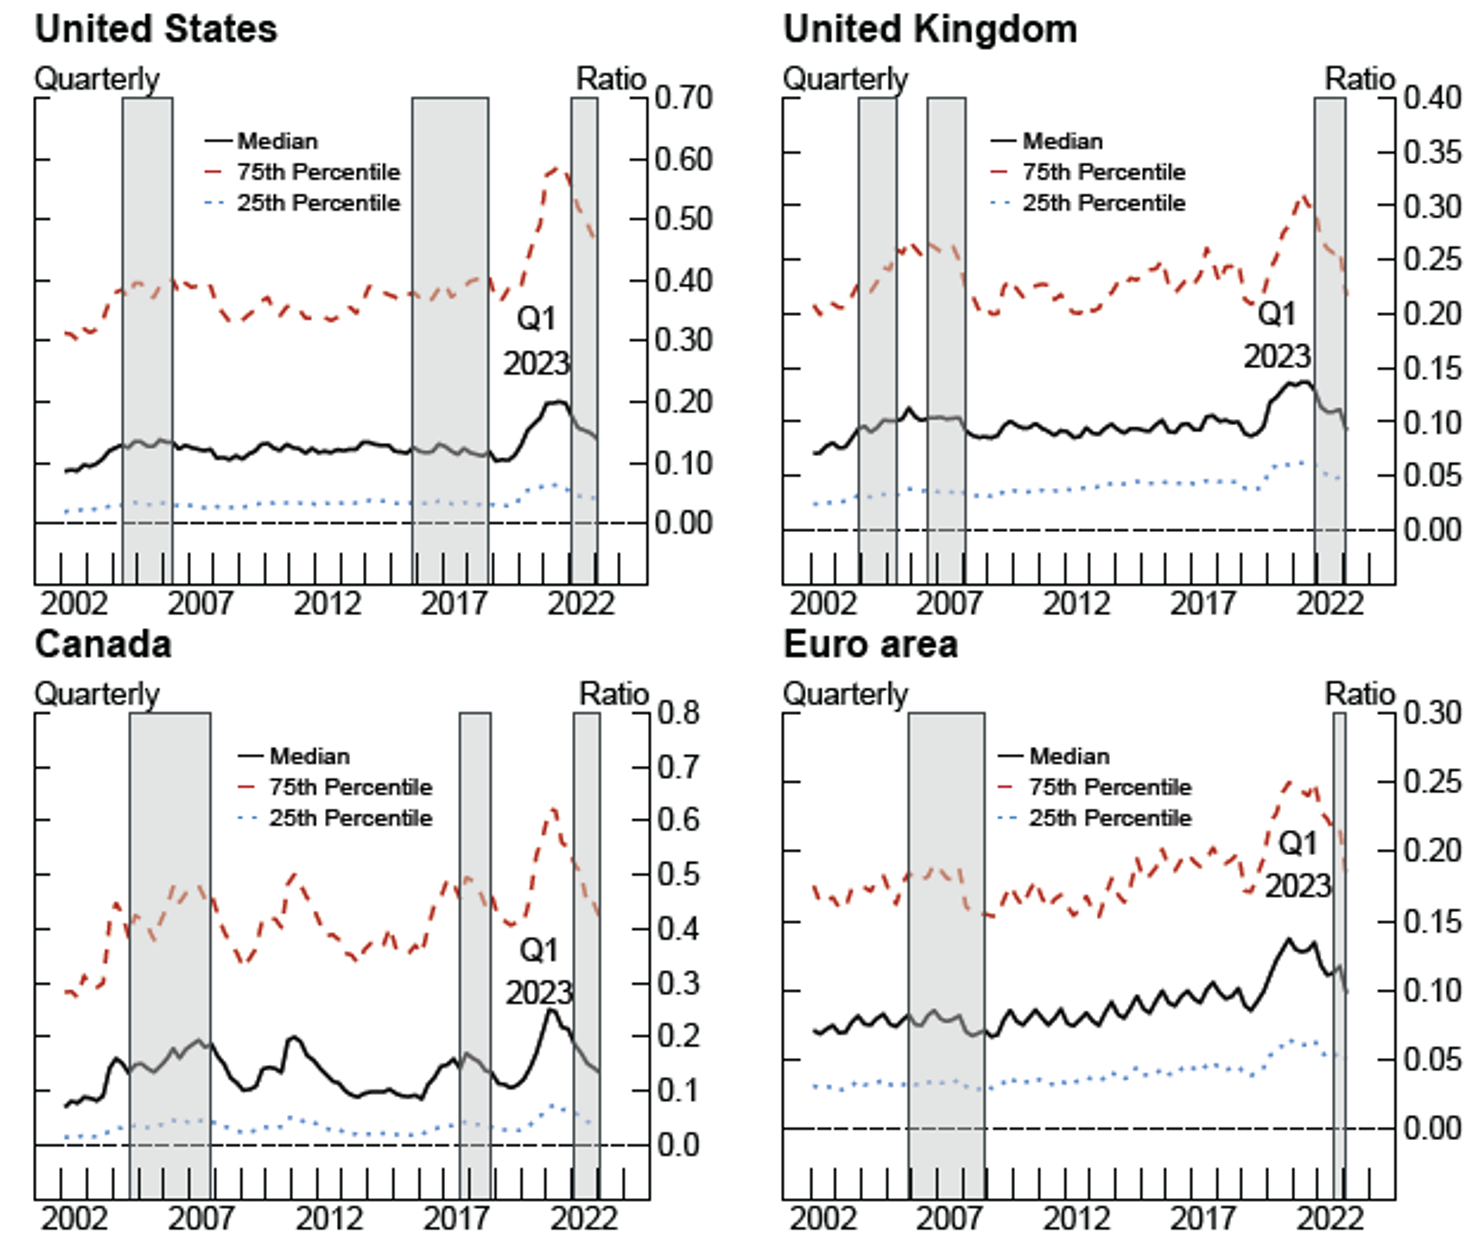
Note: Last quarter is Q1 2023. Cash holdings is defined as the ratio of cash and short term investments to assets. Shaded regions are periods of policy rate increases. United States: 2004:Q2-2006:Q2, 2015:Q4-2018:Q4, and 2022:Q1-2023:Q1. United Kingdom: 2003:Q4-2005:Q2, 2006:Q3-2008:Q1, and 2021:Q4-2023:Q1. Canada: 2004:Q3-2007:Q4, 2017:Q3-2018:Q4, and 2022:Q1-2023:Q1. Euro area: 2005:Q4-2007:Q3 and 2022:Q3-2023:Q1.
Source: S&P Capital IQ.
NFC cash holdings increased significantly during the COVID-19 pandemic amid reports of strong debt issuance activity. That said, the substantial cash buffers that firms had at the onset of tightening have declined significantly throughout the tightening cycle.
VII. Looking ahead, no spike in NFC maturity profile, gradual passthrough likely
To get a partial view into how the passthrough to NFC debt servicing costs may evolve over coming quarters, we examine the NFC bond maturity profile by quarter as of the end of 2023:Q1. When NFC bonds mature, firms may have to refinance debt at prevailing market rates which will result in higher debt servicing costs. In aggregate, NFC bond maturities are dispersed smoothly, with about 16% (Canada) to 32% (Euro area) of total NFC bonds outstanding maturing by the end of 2025. To the extent that firms refinance their debt at maturity, these results suggest that, at least for firms with predominantly fixed-rate-bond liabilities, passthrough to debt servicing costs will continue to be gradual.11
We also present Bloomberg survey forecasts as of November 2023 for policy rates through the end of 2024 as debt servicing costs of bank-debt reliant firms are tightly linked to policy rates (Figure 5). Policy rates have increased further since the end of our sample, with survey forecasts predicting that policy rates will decline in 2024, even though they will remain higher than their pre-tightening levels.12 In absence of further policy rate increases, the passthrough to existing bond-interest servicing costs will probably continue to be gradual. That said, if rates remain higher for longer, the deterioration in NFC liquidity positions and cash buffers that we document may continue, worsening corporate financial vulnerabilities, especially if there is a concurrent decline in corporate earnings. Certain segments may prove to be particularly vulnerable, including smaller businesses (which tend to rely more heavily on bank loans), high-yield issuers (which may experience larger increases in their credit spreads and debt servicing costs), and firms with significant refinancing needs. In addition, our analysis does not consider the increasingly important private capital segment.13
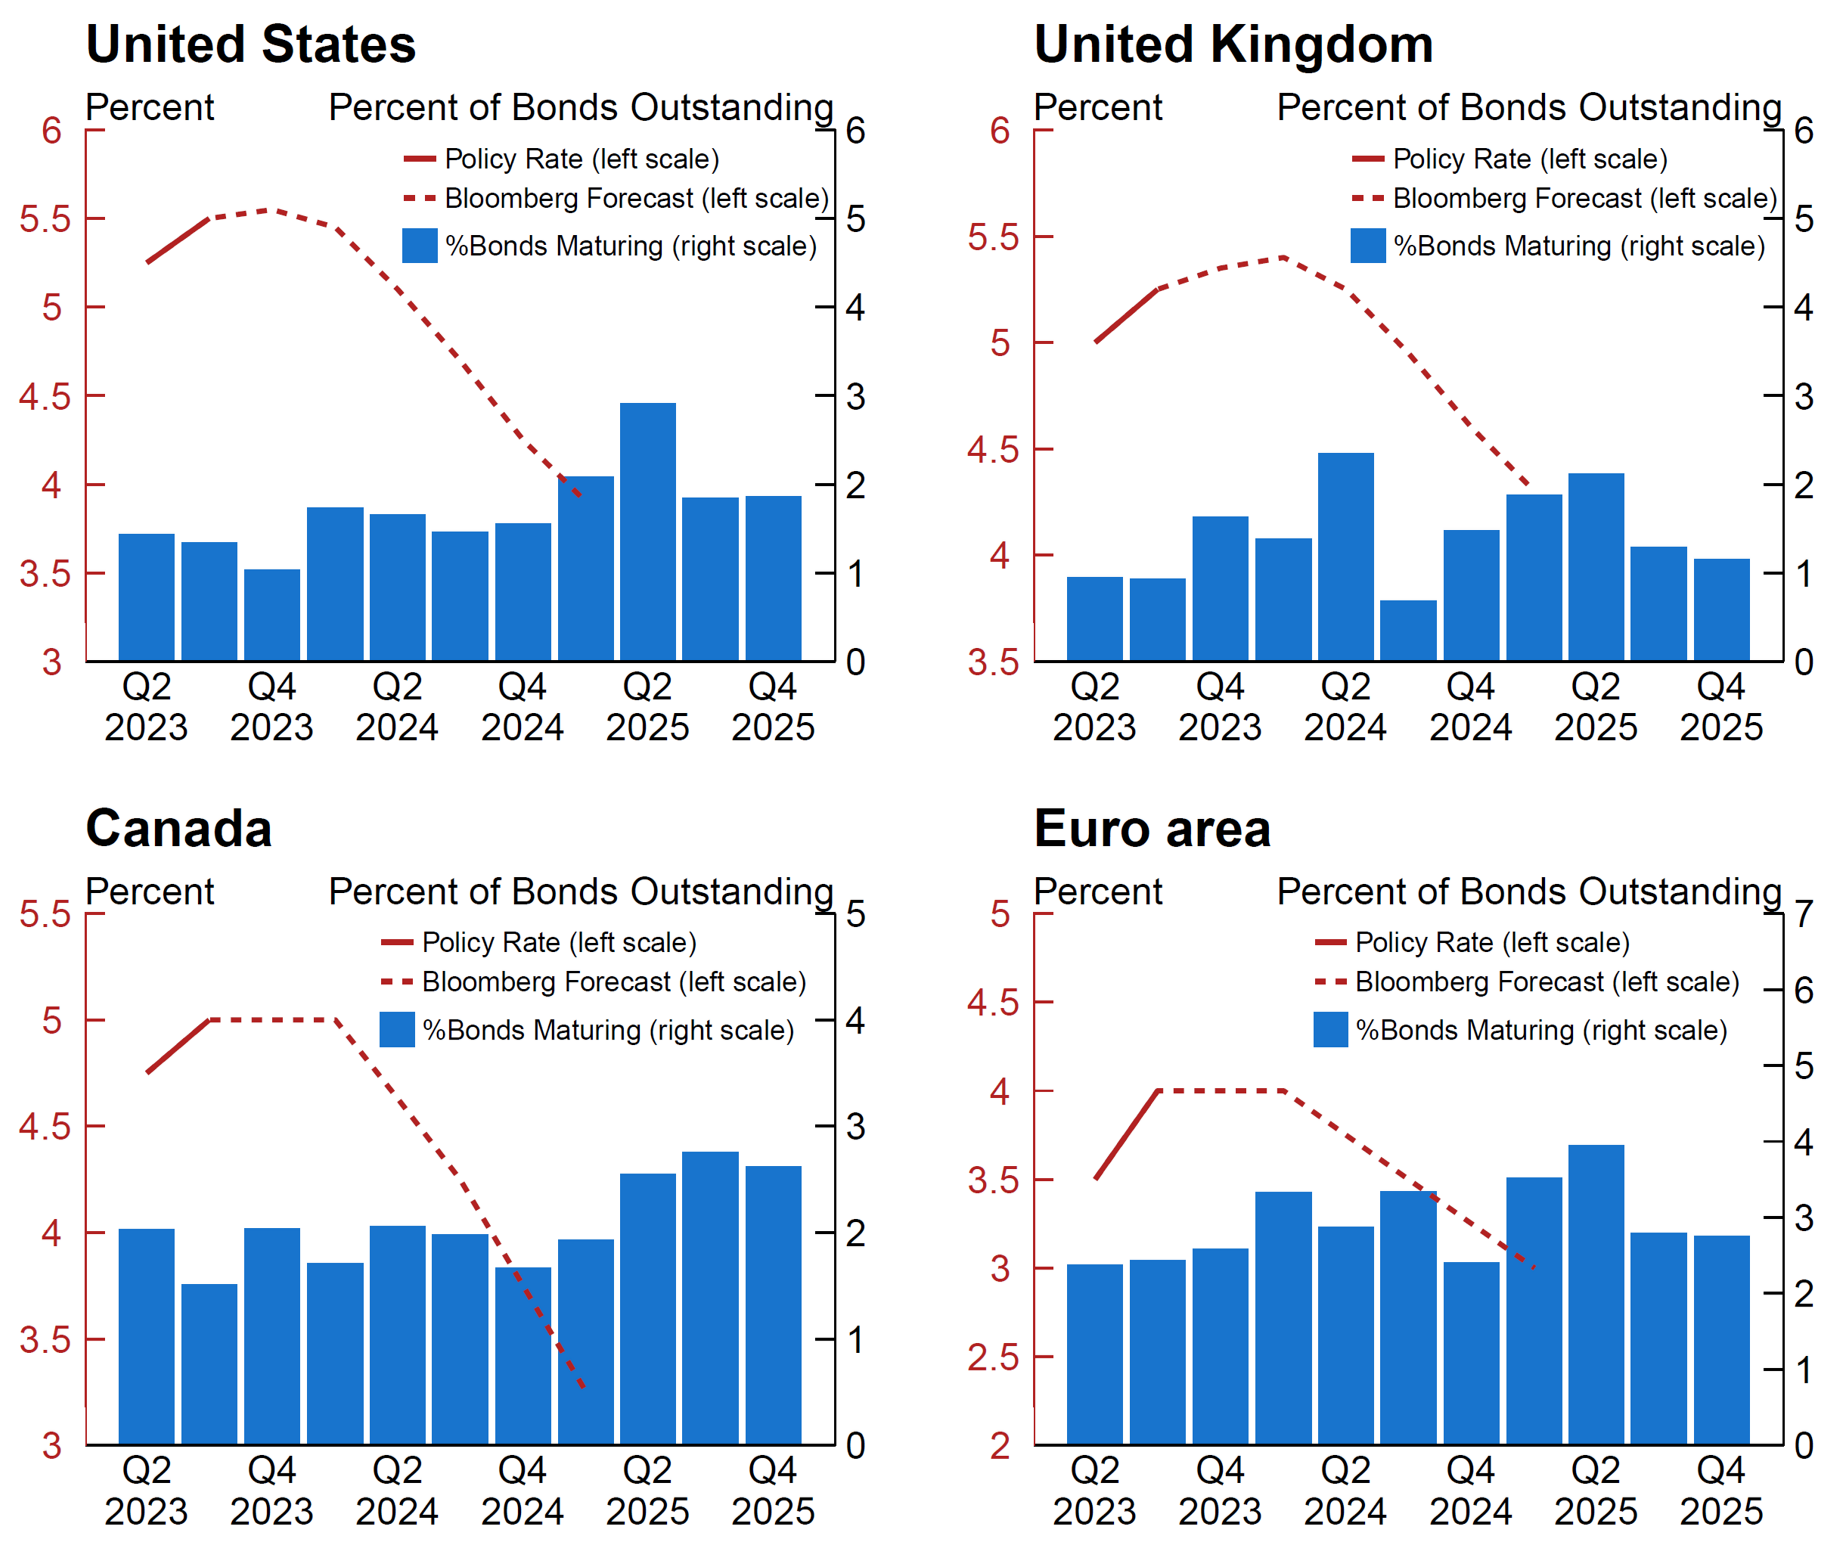
Source: Bloomberg, Board staff calculations
References
Beltran, Daniel O. and Christopher G. Collins (2018). "How Vulnerable are EME Corporates?" IFDP Notes. Washington: Board of Governors of the Federal Reserve System, June 2018, https://doi.org/10.17016/2573-2129.46.
Benmelech, Efraim, 2021. Leverage and the Macroeconomy: Implications of Low Interest rates for Corporate Debt, Working paper.
Choi, J., Hackbarth, D. and Zechner, J., 2018. Corporate debt maturity profiles. Journal of financial economics, 130(3), pp.484-502.
Gürkaynak, R., Karasoy‐Can, H.G. and Lee, S.S., 2022. Stock market's assessment of monetary policy transmission: The cash flow effect. The Journal of Finance, 77(4), pp.2375-2421.
Harford, J., Klasa, S. and Maxwell, W.F., 2014. Refinancing risk and cash holdings. The Journal of Finance, 69(3), pp.975-1012.
Hong, G.H. and Lucas, D., 2023. COVID credit policies around the world: Size, scope, costs, and consequences. Brookings Papers on Economic Activity.
Ippolito, F., Ozdagli, A.K. and Perez-Orive, A., 2018. The transmission of monetary policy through bank lending: The floating rate channel. Journal of Monetary Economics, 95, pp.49-71.
McCoy, Jack, Francisco Palomino, Ander Perez-Orive, Charles Press, and Gerardo Sanz-Maldonado (2020). "Interest Coverage Ratios: Assessing Vulnerabilities in Nonfinancial Corporate Credit," FEDS Notes. Washington: Board of Governors of the Federal Reserve System, December 3, 2020, https://doi.org/10.17016/2380-7172.2779.
Mian, A. and Santos, J.A., 2018. Liquidity risk and maturity management over the credit cycle. Journal of Financial Economics, 127(2), pp.264-284.
Palomino, Francisco, Stephen Paolillo, Ander Perez-Orive, and Gerardo Sanz-Maldonado (2019). "The Information in Interest Coverage Ratios of the US Nonfinancial Corporate Sector," FEDS Notes. Washington: Board of Governors of the Federal Reserve System, January 10, 2019, https://doi.org/10.17016/2380-7172.2290.
Waller, Christopher J. (2023), "Big Shocks Travel Fast: Why Policy Lags May Be Shorter Than You Think" speech delivered to the Money Marketeers of New York University, New York, New York., March 13.
Xu, Q., 2018. Kicking maturity down the road: early refinancing and maturity management in the corporate bond market. The Review of Financial Studies, 31(8), pp.3061-3097.
1. Federal Reserve Board of Governors, Division of International Finance. The views in this paper are solely the responsibility of the authors and should not be interpreted as reflecting the views of the Board of Governors of the Federal Reserve System or any other person associated with the Federal Reserve System. We thank Shaghil Ahmed, Daniel Beltran, Carol Bertaut, Stephanie Curcuru, Michele Dathan, Andrea De Michelis, Luca Guerrieri, Benjamin Kay, Niklas Kroner, Beth Anne Wilson, and Emre Yoldas for helpful comments. Return to text
2. See Goldman Sachs: "The Corporate Debt Maturity Wall: Implications for CAPEX and Employment", August 6, 2023 (https://www.gspublishing.com/content/research/en/reports/2023/08/07/d2ab6cef-d9ea-453f-b4fa-912d22ab09ee.html) among others. Hong and Lucas (2023) summarize interventions in credit markets during the COVID-19 pandemic. Return to text
3. Financial statement information is reported with a lag and quarterly financial reporting is not mandatory in the euro area and United Kingdom (see https://www.irmagazine.com/reporting/europeans-weigh-quarterly-reporting). 86% and 75% of U.K. and Euro area firms existing as of 2022:Q4 have reported financials for 2023:Q1, representing 97% of each region's NFC debt outstanding as of 2022:Q4. For some firms, the interest cost line sometimes reflects semiannually reported interest expenses divided equally across quarters. Results are qualitatively similar when we restrict attention to firms which elect to report quarterly. Return to text
4. Waller (2023) highlights a role for forward guidance in the speed of monetary policy transmission. Cumulative increases in new borrowing costs are larger when measured from the point in time when 2-year sovereign yields started to post significant increases during the current tightening cycle, indicative of investors anticipating increases in policy rates. However, costs of servicing existing debt do not exhibit a significant response prior to the quarter of initial policy rate increase. Return to text
5. We use historical tightening cycles that began in 2004:Q2 and 2015:Q4 for the U.S., 2003:Q4 and 2006:Q3 for the U.K., 2004:Q3 and 2017:Q3 for Canada, and 2005:Q4 for the Euro area. Return to text
6. We require that each firm have at least one historical tightening cycle for comparison. Standard errors are clustered by industry. In the regression results, we omit the euro area due to only having 3 quarters of tightening as of 2023:Q1. Return to text
7. Total debt is a stock variable which reflects end of reporting period values. Interest expense is a flow variable which reflects expenses over the entire reporting period. To address potential non-synchronicity between interest expense and total debt, we remove firms with an absolute value of cumulative passthrough beta greater than 3. Return to text
8. This result is consistent with prior research that uses past historical samples and finds that firms proactively refinance corporate debt when credit conditions are favorable to manage refinancing risk (Xu 2018; and Mian and Santos 2018). Return to text
9. Another firm characteristic that could affect the passthrough from policy rates to existing debt costs which we do not examine due to data limitations, is the extent to which firms are engaged in hedging of floating rate liabilities. Under hedge accounting rules, well-constructed hedges against the interest rate risk associated with floating rate liabilities can be reflected in reported interest expense of NFCs. Return to text
10. ICRs are a commonly used metric when assessing NFC vulnerabilities (Beltran and Collins 2018; Palomino et al. 2019; and McCoy et al. 2020). Return to text
11. This finding is consistent with the results from a recent literature that examines debt maturity structure and suggests that firms often distribute maturities across time to manage refinancing risks (Choi, Hackbarth, and Zechner 2018). Return to text
12. Due to data-reporting lags, our analysis does not consider post-2023:Q1 changes in existing debt costs. Return to text
13. See EY: "Are you harnessing the growth and resilience of private capital?", August 21, 2023 (https://www.ey.com/en_gl/private-business/are-you-harnessing-the-growth-and-resilience-of-private-capital), among others. Return to text
Kitsul, Yuriy, Bill Lang, and Mehrdad Samadi (2023). "Monetary Policy Tightening and Debt Servicing Costs of Nonfinancial Companies," FEDS Notes. Washington: Board of Governors of the Federal Reserve System, December 01, 2023, https://doi.org/10.17016/2380-7172.3410.
Disclaimer: FEDS Notes are articles in which Board staff offer their own views and present analysis on a range of topics in economics and finance. These articles are shorter and less technically oriented than FEDS Working Papers and IFDP papers.