FEDS Notes
March 28, 2025
Monitoring Reserve Scarcity Through Nonbank Cash Lenders
Stefan Gissler, Sam Hempel, Jay Kahn, Patrick McCabe, and Borghan Narajabad1
In this note, we show that nonbank lenders' behavior as cash lenders can help discern early informative signals about the scarcity of reserves. Reserves, which are deposits that banks and other financial institutions hold at the Federal Reserve, are the most liquid asset on banks' balance sheets and hence play a central role in banks' liquidity management. The aggregate supply of reserves tends to decline when the Federal Reserve's balance sheet shrinks, for instance, through quantitative tightening.2 As reserves decline, banks may conserve liquidity by limiting their lending in overnight money markets, including secured (repo) and unsecured (federal funds) markets.3 With banks less eager to lend, nonbanks' role as cash providers in these markets tends to increase, and their supply of liquidity can provide useful early signals for reserve scarcity.4 These early signals are valuable because reserve scarcity can lead to disruptions in funding markets, such as the sudden spikes in overnight rates seen in September 2019.5
We focus on two critical nonbank suppliers of liquidity to money markets: money market funds (MMFs), the largest providers of cash in repo markets, and the Federal Home Loan Banks (FHLBs), the largest providers of cash in the federal funds market. Our institution-based approach complements approaches that use aggregate market-based indicators for monitoring scarcity.6 We show that four new indicators based on these institutions' cash supply can help discern early informative signals about reserve scarcity:
- The proportion of MMF repo lending above the interest rate on reserve balances (IORB);
- The elasticity of MMF repo spreads to the balance in Treasury General Account (TGA);
- Volume and rates in the "true" domestic interbank fed funds market (i.e., transactions that do not involve FHLBs as lenders);
- FHLBs' lending in the fed funds market at rates below their repo rates.
These measures are based on the driving factors for MMFs' and FHLBs' supply of cash to repo and fed funds markets. We focus on these institutions based on two key insights:
- MMFs become an increasingly important marginal source of funding to dealers and banks through the repo market when reserves become scarce, which, all else equal, reduces banks' willingness to lend in money markets. As dealers bid up rates to draw cash in from MMFs, the share of MMF repo at rates above IORB rises (indicator 1) while MMF repo spreads become more sensitive to movements in reserves driven by the TGA (indicator 2).
- The dominance of FHLBs as lenders in the fed funds market limits the value of the effective federal funds rate (EFFR) and aggregate fed funds volume statistics as indicators of reserve scarcity, given that borrowing from FHLBs mostly satisfies non-reserve-related motives. Focusing on one component of the fed funds market – bank-to-bank (unsecured) lending (indicator 3) – provides greater insight into potential funding shortfalls among banks that could be associated with reserve scarcity. FHLBs also diminish the extent to which the fed funds market reflects pressures that may exist in the repo market arising from possible reserve scarcity, as FHLBs are willing to lend fed funds below their repo rates (indicator 4).
As early as 2019:Q1, all four of our indicators began to show rising pressures we would associate with approaching reserve scarcity – well in advance of the turmoil in overnight money markets in September 2019. While individual indicators may occasionally provide conflicting signals regarding reserve scarcity, analyzing them together enhances the accuracy of our assessment and reduces the likelihood of false positives. Our indicators currently show that reserves remain abundant. However, a couple of our indicators provided some potential signs of emerging scarcity in the fourth quarter of 2024. Although these signals appear to have been temporary, they suggest that close monitoring of our indicators is warranted.
Background on reserve scarcity and largest cash providers in overnight markets
The quantity of reserves affects the cost and composition of funding in financial markets. Although the Federal Reserve effectively eliminated formal reserve requirements for depository institutions in 2020, banks still need reserves for liquidity management, including as buffers to meet settlement needs arising from payments and securities flows.7 When reserves are abundant, interest rates in short-term funding markets do not react to small changes in cash demand. Banks with sufficient reserve buffers are willing to provide funding to other banks and nonbanks, such as securities dealers, at rates near IORB – that is, the interest rate banks would otherwise receive on reserves. As aggregate reserves decrease, banks increasingly conserve reserves for liquidity management and become less willing to extend short-term funding, prompting borrowers to bid up lending rates in the broader funding markets to attract cash from nonbanks.
Reserve scarcity can lead to large fluctuations in key short-term funding rates and can potentially disrupt normal functioning of repo and fed funds markets. Repo markets are vital sources of funding for systemically important financial institutions, for example, securities dealers. Meanwhile, the Federal Open Market Committee (FOMC) uses EFFR, a reference rate based on the federal funds market, as its target rate for monetary policy. When reserves are scarce, rates in these markets can become highly sensitive to even small changes in cash supply and demand, potentially leading to spikes in rates and associated market turbulence, such as the surge in volatility in money markets in mid-September 2019.
In this note, we focus on two sets of nonbank cash providers – MMFs, the main cash providers in repo markets, and FHLBs, the main cash providers in the federal funds market – to construct indicators of early signs of reserve scarcity and associated liquidity pressures. As reserves become scarce and banks become less eager to lend in repo markets and increase their demand for fed funds, the capacity of MMFs and FHLBs to supply cash becomes increasingly significant in shaping funding costs.
MMFs play a key role as repo lenders, and their importance grows as reserves become scarce. Repo lending by MMFs provides cash to dealers, which enables dealers to finance their securities portfolios and extend funds to leveraged entities such as hedge funds. MMFs currently account for approximately half of total lending in the tri-party repo market.8 As reserves decrease, dealers bid up repo rates.9 Higher repo rates, in turn, draw in additional cash from MMFs, increasing the allocation of MMFs towards private repo as a share of their overall investment.10 In light of MMFs' increasing importance as a marginal source of repo funding amid declining reserves, we construct indicators for reserve scarcity based on MMFs' repo activity.
Next, we consider FHLBs, the main cash lenders in the fed funds market. We will argue below that the dominance of FHLBs and their lending practices in the fed funds market diminish the extent to which that market reflects pressures that can develop in the repo market when reserves are becoming scarce. Hence, FHLB practices limit the value of the EFFR and aggregate fed funds volumes as early indicators of reserve scarcity. While FHLBs' core business is providing collateralized loans to their members, FHLBs lend in the fed funds market because fed funds loans are highly liquid assets that help FHLBs meet their regulatory liquidity requirements.11,12 FHLBs account for over 90 percent of federal funds lending. They lend cash mostly to foreign banking organizations (FBOs) and to mid-sized to large domestic banks that are subject to the liquidity coverage ratio (LCR).13 The motives behind almost all of these transactions are unrelated to banks' basic need for liquidity and reserves. Our indicators, therefore, isolate dynamics in another segment of the fed funds market that better reflects such needs for reserves and show how activities in this segment evolve as aggregate reserves become scarce.
Indicators for early warning signs of reserves scarcity
Our first indicator is the proportion of MMF repo lending at rates above IORB, which tends to rise as reserves become scarce. When reserves are abundant, dealers can generally secure funding through affiliated banks that can draw down on their large reserve buffers at the cost of foregoing IORB. During these times, banks can account for a significant share of total tri-party repo lending, exceeding 40 percent (see Appendix Indicator 1), while dealers generally turn to MMFs only if they offer rates below IORB.14 As discussed earlier, when aggregate reserves decline, thinner reserve buffers at banks leave them less willing to lend cash, and banks' share of tri-party repo lending can fall below 20 percent as dealers become more reliant on borrowing from MMFs. Hence, dealers bid up repo rates above IORB to secure additional cash from MMFs.15
The chart of Indicator 1 shows that the proportion of MMF repo lending at rates above IORB has provided an informative early signal of reserve scarcity in the past. As shown by the blue line in the chart, the proportion of MMF repo lending above IORB began increasing in 2018 and reached near 100 percent by early 2019, well before the September repo spike. In contrast, after the expansion of reserves in late 2019, this series dropped to near zero, indicating abundant reserves in the system. It remained near zero for most of 2024, as reserves declined modestly while the Federal Reserve's balance sheet shrank considerably. However, the share of MMF repo rates exceeding the IORB rate rose at year-end 2024, in an indication of potential pressure that was not evident in this measure at the ends of the previous three years.16 This measure has since decreased (and is likely to decline in the near term as the 30-day rolling window moves past year-end) but bears careful monitoring in the months ahead.
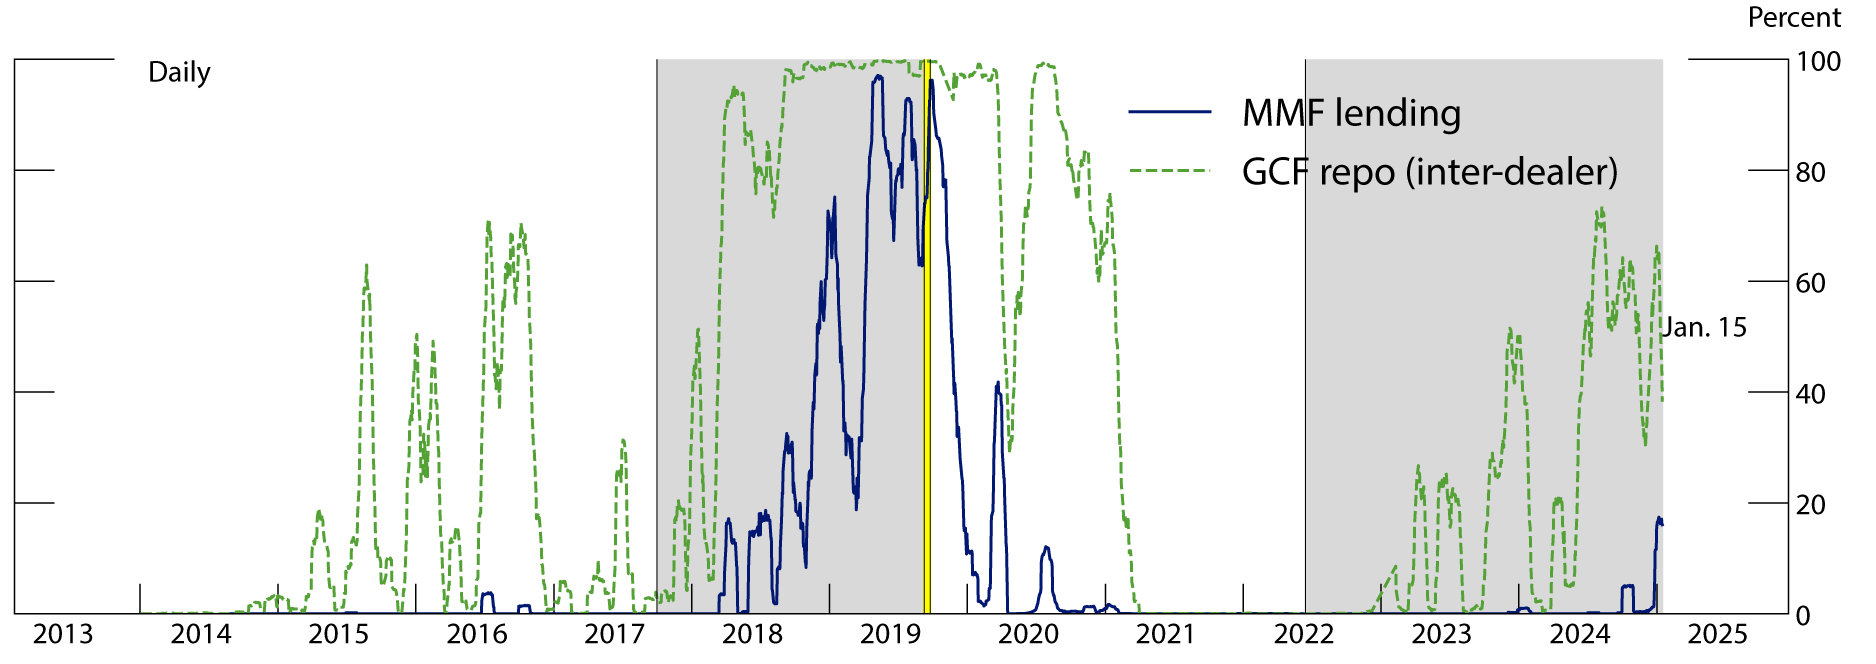
Note: The vertical yellow shaded area spans the month of September 2019. Gray shaded areas denote periods of quantitative tightening. All series are 30-day rolling averages. "GCF" stands for the GCF Repo service of the Fixed Income Clearing Corporation (FICC), a blind-brokered inter-dealer segment of the repo market that is centrally cleared through FICC and settled on a tri-party basis. Money market fund lending is the share of tri-party lending by MMFs above the IORB rate (or IOER rate prior to July 29, 2021). Inter-dealer is the share of GCF lending above the IORB rate.
Sources: Federal Reserve tri-party repo transactions data, DTCC Solutions LLC (an affiliate of The Depository Trust & Clearing Corporation), Federal Reserve Policy Rates release.
Our measure is a logical extension of existing measures based on broader repo rates. In particular, the green line in the chart of Indicator 1 reproduces a measure based on inter-dealer repo rates above IORB proposed in Afonso et al. (2024a). This measure is derived from transactions in the cleared tri-party market (GCF), but similar patterns can be seen in comparable measures based on the cleared bilateral market. Measures of inter-dealer transactions are valuable for analyzing a wide variety of issues that impact dealers' repo market activities.17 Our indicator builds on the insights of these existing measures by helping to isolate the effect of reserve scarcity from other factors affecting inter-dealer rates. Since MMFs do not serve as intermediaries in repo markets, the rates they are willing to accept are affected only indirectly by constraints on dealer intermediation such as balance sheet costs, which have more substantial impacts on inter-dealer rates. And because repo is simply a means for MMFs to invest cash, the rates they accept do not reflect demand for specific securities as collateral, which affects cash-lending rates received by dealers and hedge funds.
The second indicator we present is the elasticity of MMF repo spreads to the balance in the TGA. The TGA is the U.S. Department of the Treasury's deposit account held at the Federal Reserve. Increases in the TGA balance mechanically and exogenously reduce reserves, placing more pressure on banks' buffers.18 As reserves become less abundant and dealers rely more on MMFs for repo lending, this elasticity is expected to increase. This is because the repo rates dealers offer to MMFs become more sensitive to fluctuations in reserves that change the availability of funding from banks. The chart of Indicator 2 shows this elasticity as derived from 90-day rolling regressions of the change in MMF repo spreads on the change in TGA balances.19 Rather than reflecting information about the level of rates, as in Indicator 1, the elasticity measure reflects how rates change with small changes induced in reserves.20 As the blue line in chart shows, this measure began increasing in mid-2018 and was significantly elevated prior to the September 2019 repo spike. Like our first indicator, this measure recently increased slightly, particularly in the fourth quarter of 2024. However, throughout this period it remained well below levels reached in 2018, and the measure has since fallen back to roughly zero. Still, these moves reinforce that close monitoring of repo market conditions is warranted.21
In contrast, the elasticity of the EFFR spread to changes in the TGA, shown in orange, did not exhibit substantial sensitivity to TGA changes in 2019 until right before the September spike. The relative sensitivity of repo market rates makes this elasticity a particularly useful early warning signal of reserve scarcity. Below, we discuss factors that may make repo rates more informative than the EFFR in detecting early signals of reserve scarcity.
Indicator 2. Coefficient of 90-day rolling regression of changes in spreads on changes in TGA balances
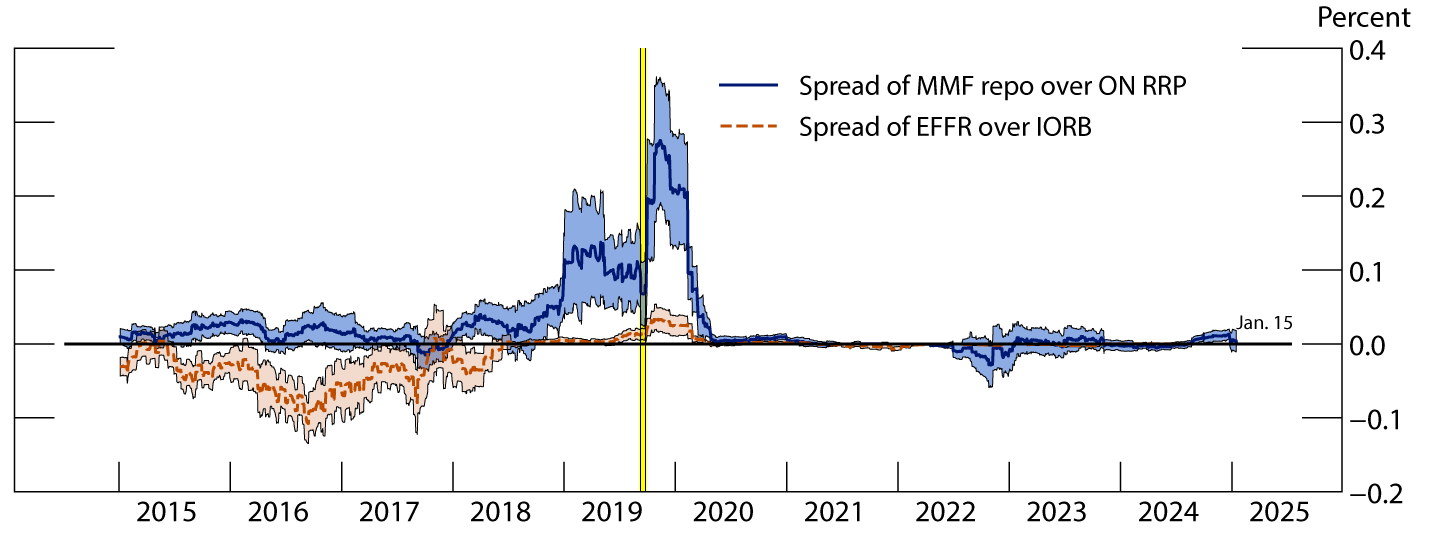
Notes: The vertical yellow shaded area spans the month of September 2019. The blue and orange shaded areas, respectively, represent the 95% confidence intervals around the elasticity estimates for MMF repo spreads and EFFR spreads.
Sources: Federal Reserve tri-party repo transactions data, Federal Reserve Bank of New York Reference Rates release, Federal Reserve Policy Rates release.
To extract more precise signals from the fed funds market about reserve scarcity, our next indicator focuses on the volume and rates in the "true" domestic interbank market—that is, the segment which excludes transactions between banks and FHLBs. This segment of the fed funds market, where domestic banks not subject to the LCR regulation borrow from other domestic banks, is usually small in volume and in the number of participating banks, most of which are not suitable fed funds counterparties for FHLBs.22 However, the borrowing in this small segment is mostly driven by banks' basic needs for liquidity and reserves, and interest rates and volumes increase as reserves become scarce.23
Our indicator refines measures based on the aggregate federal funds market. This market is critical in monetary policy implementation, but it also reflects trading motives that are unrelated to banks' basic needs for liquidity and reserves. The largest segment of the market is dominated by demand from FBOs that borrow in the fed funds market for arbitrage and large domestic banks that seek to improve their LCRs.24 Because most of the fed funds volume comprises these two types of transactions, the EFFR, the volume-weighted median rate, does not reflect early signs of reserve scarcity.25
FHLBs, the crucial counterparties for FBOs and LCR banks, can suddenly change their lending behavior and, when reserves are scarce, this change may lead to sudden jumps in the EFFR. If FHLBs anticipate high demand for advances from their members, FHLBs may hold onto cash by withholding lending in the fed funds market on very short notice. If so, rate-sensitive borrowers that do not need reserves for liquidity purposes—that is, FBOs and LCR banks—would likely reduce their fed funds borrowing.26 In their absence, domestic non-LCR banks in need of reserves would become the dominant borrowers, and the EFFR may spike if reserves become scarce, as this volume-weighted median rate would shift to reflect scarcity that had been obscured by FHLBs' lending.
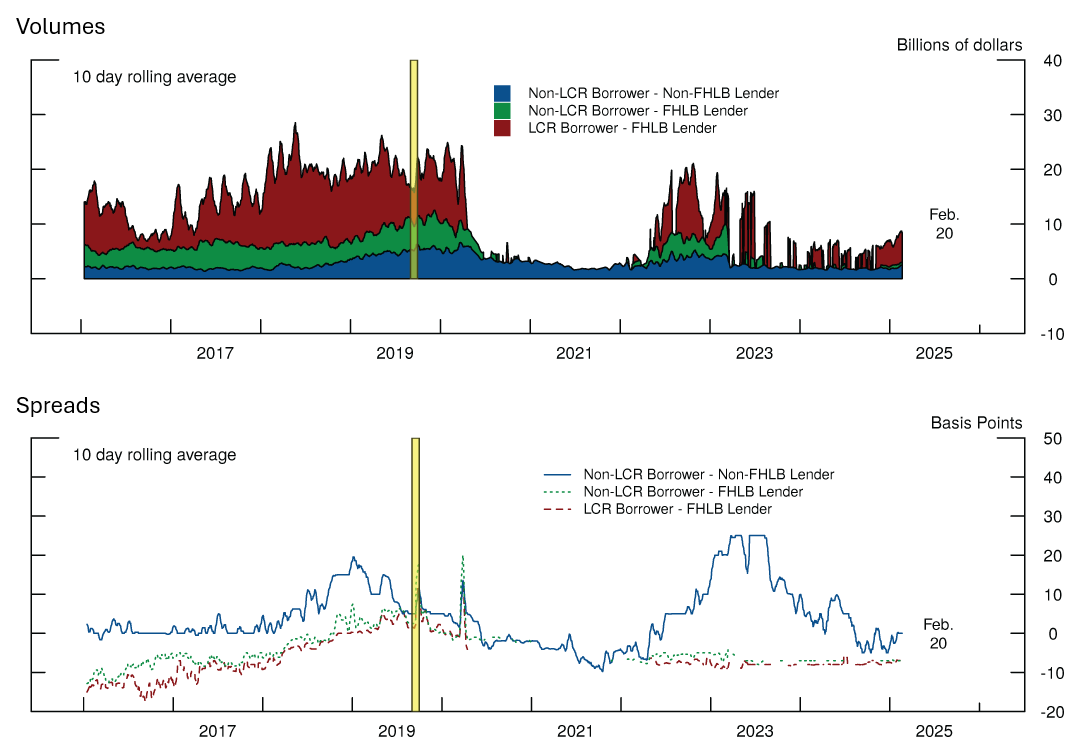
Note: For volumes in the top panel, “Non-LCR Borrower – Non-FHLB Lender” (blue region) is the bottom shaded area, and “LCR Borrower – FHLB Lender” (red region) is the top shaded area. The vertical yellow shaded area spans the month of September 2019. Spreads in the bottom panel are calculated relative to IORB. FHLB series may include negligible amount of non-FHLB GSEs. The "LCR-Borrower – Non-FHLB Lender" category had negligible volume and was excluded. For confidentiality reasons, data was omitted on days when there were few observations in the underlying data.
Sources: FedWire, FR 2420.
The chart of Indicator 3 shows the volume borrowed by domestic non-LCR banks from domestic banks (first panel, blue area) and the spreads over IORB paid in those transactions (second panel, blue line). The volume and spreads signaled steadily rising reserve scarcity as early as 2018 and then clearly over the first nine months of 2019.27 In contrast, measures including borrowing by FBOs and LCR banks did not show significant early signs of reserve scarcity.28
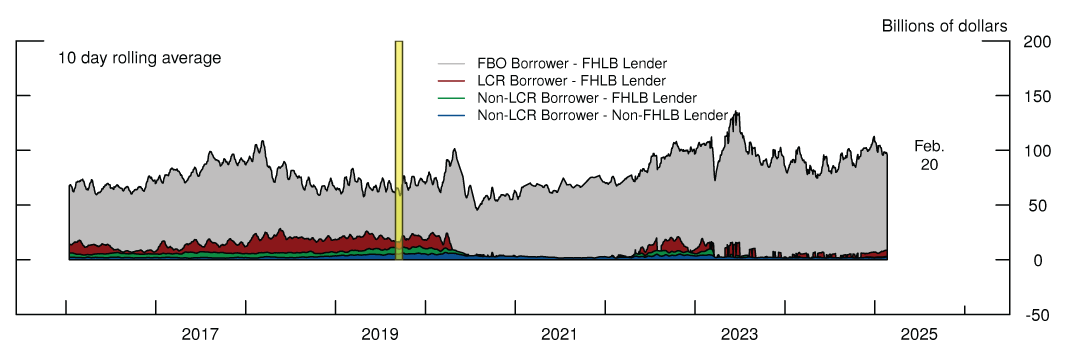
The last indicator shows FHLBs' lending in the fed funds market at rates below their repo rates. This indicator measures the extent to which FHLBs prevent the fed funds rate from reflecting upward pressure on repo rates that may arise from reserve scarcity. The first panel of our chart for Indicator 4 shows the daily volume of FHLB lending in fed funds at rates below the repo rates that FHLBs receive on the same day (in black and grey), as well as the corresponding spreads between the fed funds rates and repo rates that FHLBs receive (in red and blue). A large and sustained volume of fed funds lending done below repo rates will limit how informative fed funds rates are for reserve scarcity. Moreover, given the rate sensitivity of FHLBs' fed funds borrowers, a gap between repo rates and fed funds rates signals the potential for sharp adjustments in the EFFR as described above.
The potential for a sharp adjustment in the EFFR may be exacerbated if FHLBs not only lend below repo rates but also at stale rates in the fed funds market to highly rate-sensitive borrowers, as shown in the second panel of Indicator 4.29 FHLBs maintain a well-defined set of counterparties which borrow a steady amount of cash each day at the same rate. FHLBs may continue to lend at the same rates despite rising repo rates and forego a higher-yielding investment in return for stability because their counterparties are highly rate sensitive.30 Lending at stale rates may cause a disconnect between the rates in the repo and funds markets. However, if FHLBs stop lending in the fed funds market to have cash ready to meet demand for advances to their members, the repo and fed funds rates may reconnect abruptly. As discussed above, this can lead to a sharp spike in the EFFR as rate-sensitive FBOs and LCR banks leave the fed funds market.
Our federal funds market-based measures of reserve scarcity probe beyond the EFFR—an aggregate measure—to uncover upward pressures in the overnight money markets. Both panels of Indicator 4 show prolonged FHLB lending below repo rates starting in March 2018, well in advance of September 2019. They indicate that as reserves became more scarce, fed funds lending rates were less informative about banks' cash demand than repo rates, highlighting the importance of the repo measures we introduced above. Currently, the indicators based on the fed funds market do not show signs of reserve scarcity.
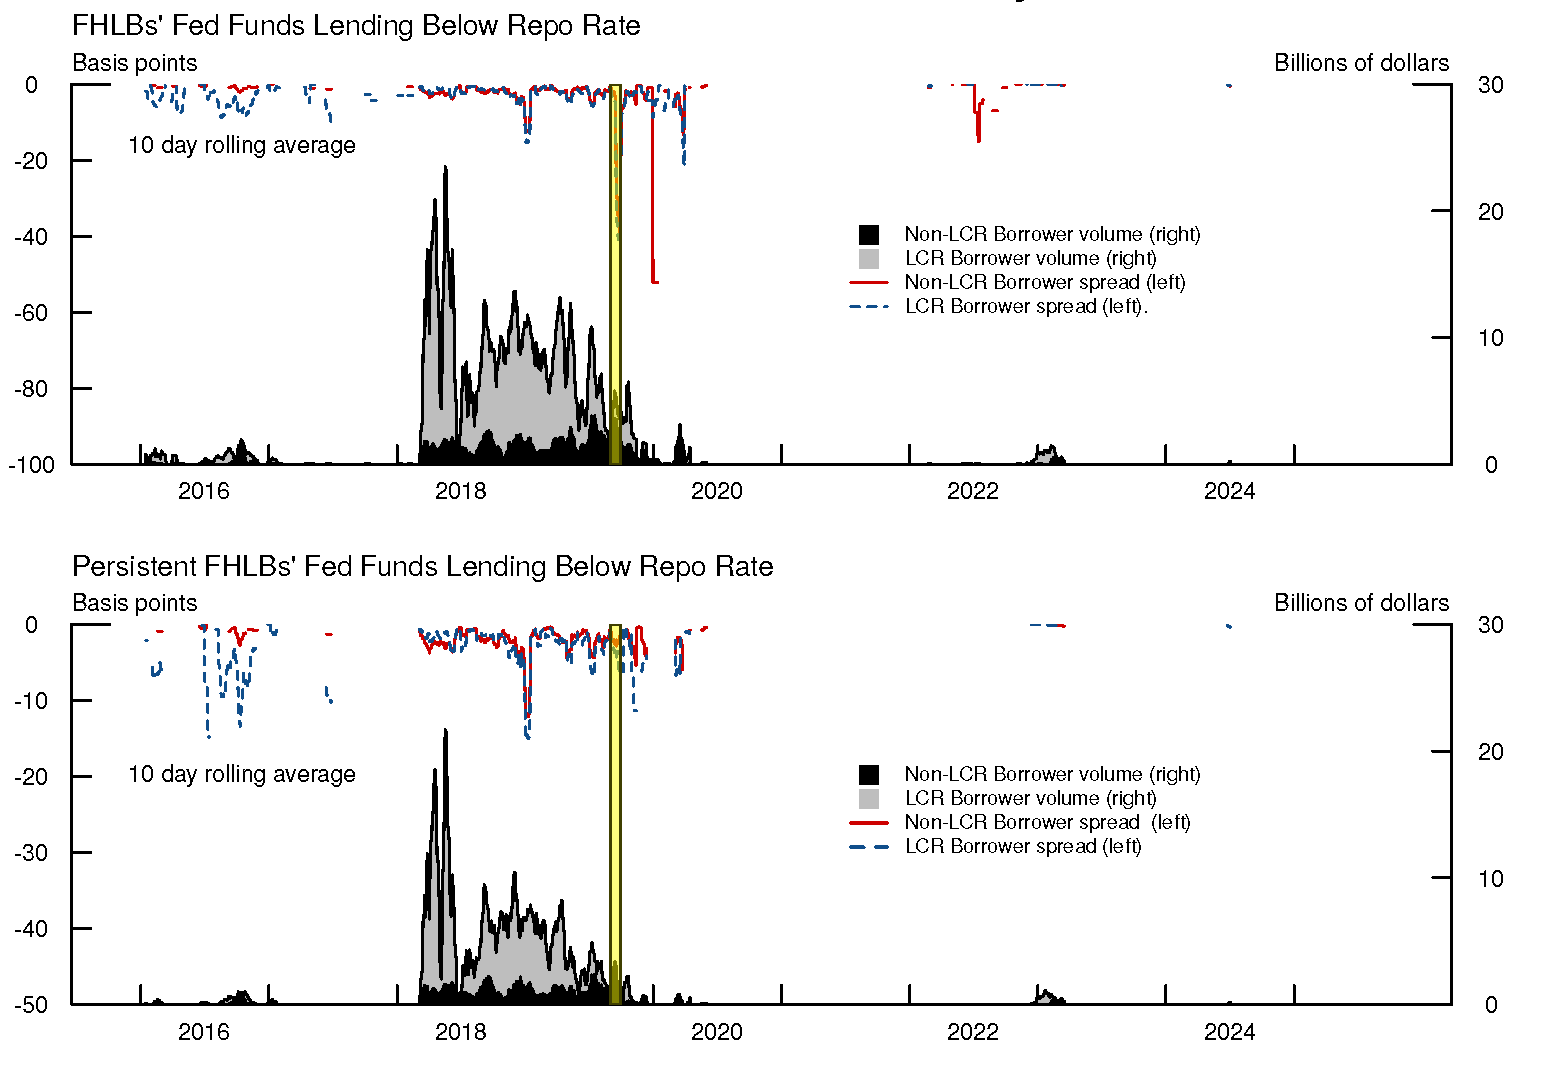
Note: The vertical yellow shaded area spans the month of September 2019. For confidentiality reasons, data was omitted on days when there were few observations in the underlying data. Data extend through November 26, 2024.
Sources: Federal Reserve tri-party repo transactions data, FedWire, FR 2420.
Overall, by considering the factors that influence the supply of cash from MMFs and FHLBs, our indicators offer timely and precise signals of reserve scarcity that complement measures that others have introduced. In the runup to the September 2019 money market turmoil, all of our indicators showed signs of approaching reserve scarcity by 2019:Q1 or earlier. Despite some potential signals of emerging scarcity from a couple of our indicators in the fourth quarter of 2024, none of them signals immediate pressure. Still, the small recent moves suggest that monitoring our indicators, as well as broader developments among these critical cash lenders, will be crucial in coming months.
References
Afonso, Gara, Marco Cipriani, Adam Copeland, Anna Kovner, Gabriele La Spada, and Antoine Martin, 2021. "The Market Events of Mid-September 2019," Economic Policy Review, Federal Reserve Bank of New York, 27(2), August, pp. 1-26, http://dx.doi.org/10.2139/ssrn.3915127.
Afonso, Gara, Kevin Clark, Brian Gowen, Gabriele La Spada, JC Martinez, Jason Miu, and Will Riordan, 2024a. "A New Set of Indicators of Reserve Ampleness," FRBNY Liberty Street Economics, August 14.
Afonso, Gara and Ricardo Lagos, 2015. "Trade Dynamics in the Market for Federal Funds." Econometrica, 83(1), pp. 263–313, https://doi.org/10.3982/ECTA10586.
Afonso, Gara, Gabriele La Spada, and John Williams, 2024b. "Measuring the Ampleness of Reserves," FRBNY Liberty Street Economics, October 5.
Anbil, Sriya, Alyssa Anderson, and Zeynep Senyuz, 2020. "What Happened in Money Markets in September 2019?" FEDS Notes. Washington: Board of Governors of the Federal Reserve System, February 27.
Anderson, Alyssa and Dave Na (2024). "The Recent Evolution of the Federal Funds Market and its Dynamics during Reductions of the Federal Reserve's Balance Sheet," FEDS Notes. Washington: Board of Governors of the Federal Reserve System, July 11.
Baklanova, Viktoria, Adam Copeland, and Rebecca McCaughrin, 2015. "Reference guide to U.S. repo and securities lending markets," Staff Reports 740, Federal Reserve Bank of New York.
Gowen, Brian, Roberto Perli, Julie Remache, and Will Riordan, 2025. "Monitoring Money Market Dynamics Around Year-end," FRBNY Teller Window, January 16.
Hempel, Samuel J., Calvin Isley, R. Jay Kahn, and Patrick E. McCabe, 2023, "Money Market Fund Repo and the ON RRP Facility," FEDS Notes. Washington: Board of Governors of the Federal Reserve System, December 15.
Ihrig, Jane E., Zeynep Senyuz, and Gretchen C. Weinbach, 2020, "The Fed's 'Ample-Reserves' Approach to Implementing Monetary Policy," Finance and Economics Discussion Series 2020-022, Board of Governors of the Federal Reserve System.
Kahn, R. Jay, Matthew McCormick, Vy Nguyen, Mark Paddrik, and H. Peyton Young, 2023, "Anatomy of the Repo Rate Spikes in September 2019," Journal of Financial Crises, Yale Program on Financial Stability (YPFS), 5(4), July, pp. 1-25.
Poole, William, 1968. "Commercial Bank Reserve Management in a Stochastic Model: Implications for Monetary Policy." The Journal of Finance, 23(5), pp. 769–91, https://doi.org/10.2307/2325906.
Appendix
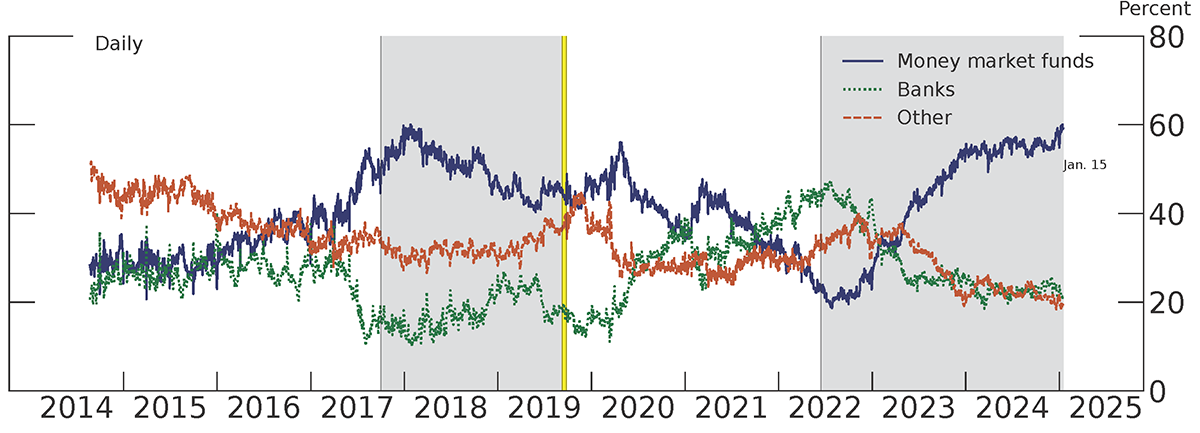
Note: The vertical yellow shaded area spans the month of September 2019. "Other" series includes non-MMF asset managers and other lenders.
Source: Federal Reserve tri-party transactions data.
Appendix Indicator 2: MMF Repo Rates vs. Bank Reserves (left) and MMF Private Repo Allocation (right)
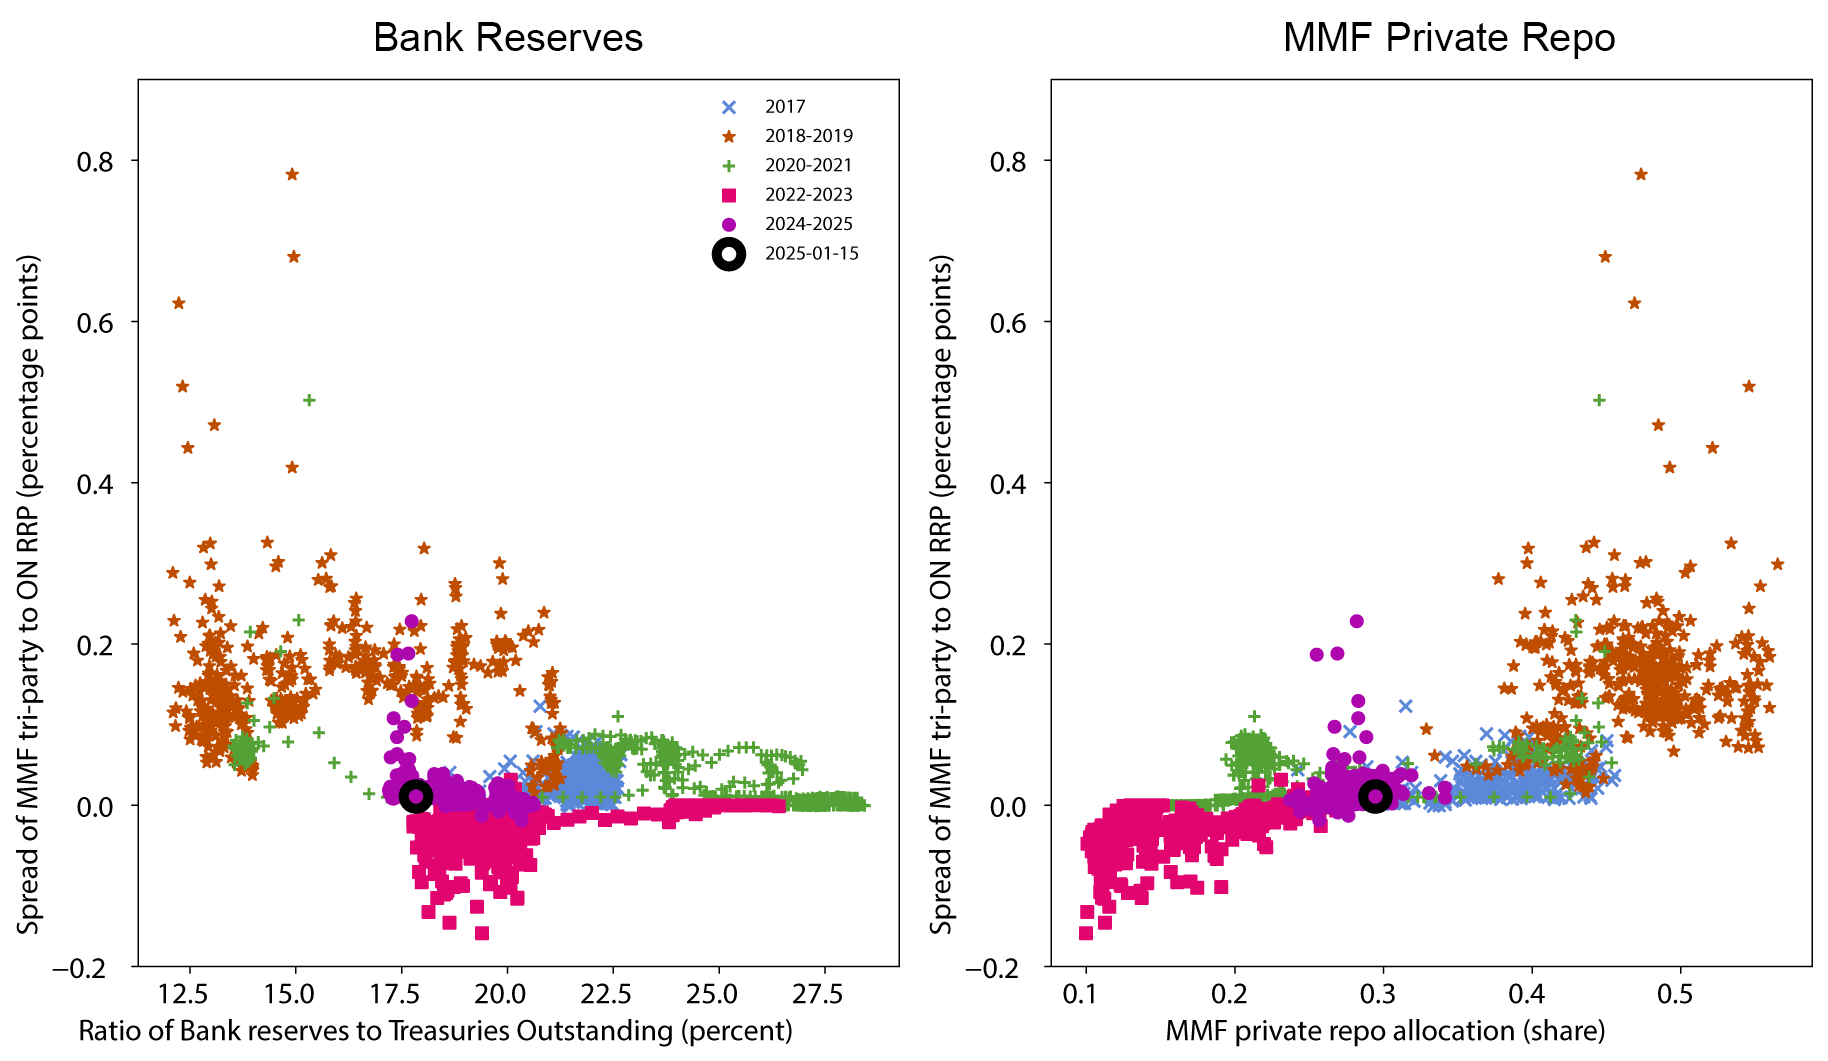
Note: Ratio of bank reserves to treasuries outstanding are calculated as 10-day rolling averages. MMF private repo allocation is defined as the quantity of MMF private repo investments divided by the sum of MMF private repo, MMF investments in the Federal Reserve overnight reverse-repo facility, and estimated MMF holdings of Treasury bills.
Sources: Federal Reserve tri-party transaction data, Reserve Central-Reserve Account Administration data, Treasury Direct.
Note: Key identifies in order from top to bottom. The vertical yellow shaded area spans the month of September 2019. FHLB series may include negligible amount of non-FHLB GSEs. The "FBO-Borrower – Non-FHLB Lender" and "LCR Borrower – Non-FHLB Lender" categories had negligible volume and were excluded. For confidentiality reasons, data was omitted on days when there were few observations in the underlying data.
Sources: FedWire, FR 2420.
1. We thank Celso Brunetti, James Clouse, Dan Covitz, Diana Hancock, Michael Palumbo, Zeynep Senyuz, and Ashley Wang for their comments and suggestions, and David Bowman and Sebastian Infante for helpful conversations. We also thank Jonathan Dall and Patrik Bauer for excellent charting assistance. Return to text
2. For more, see Ihrig et al. (2020). Return to text
3. For background on the repurchase agreement (repo) market, see Baklanova et al. (2015) for a broad overview and Hempel et al. (2023) for more detail on the role of money market funds. For background on recent developments in the fed funds market, see Anderson and Na (2024). Return to text
4. We use "reserve scarcity" to describe a state in which aggregate reserves are below the level needed to satisfy the definition of "ample" provided by the Federal Open Market Committee (FOMC). The FOMC has stated that "an ample supply of reserves ensures that control over the level of the federal funds rate and other short-term interest rates is exercised primarily through the setting of the Federal Reserve's administered rates, and in which active management of the supply of reserves is not required" (Statement Regarding Monetary Policy Implementation and Balance Sheet Normalization, January 30, 2019, emphasis ours). Return to text
5. See Anbil et al. (2020), Afonso et al. (2021) and Kahn et al. (2023). Return to text
6. For example, the Federal Reserve Bank of New York (FRBNY) has published indicators of reserve ampleness; see, for example, Afonso et al. (2024a,b). Return to text
7. The elimination of reserve requirements was accomplished in March 2020 by amending Regulation D to set reserve requirements at zero percent. Return to text
8. In the tri-party repo market, the Bank of New York Mellon provides collateral management and other services as a tri-party custodian. Among all segments of the repo market, tri-party is the largest net source of funds for dealers. The blue line in Appendix Indicator 1 shows that over the past decade, MMFs on average represent about 40 percent of tri-party repo lending. Return to text
9. See Appendix Indicator 2, left panel. Return to text
10. See Appendix Indicator 2, right panel. Return to text
11. FHLBs also invest in the repo market but prefer fed funds to repo because the intraday timing of the fed funds market is more suitable for liquidity management. Return to text
12. On September 30, 2024, FHFA proposed a rule to allow FHLBs invest more in interest bearing deposit accounts (IBDAs). This is the most flexible form of liquidity management and some substitution from fed funds toward IBDAs could follow the implementation of such a rule. Return to text
13. See Appendix Indicator 3. Return to text
14. MMFs are willing to lend below IORB as they are ineligible to hold reserves and therefore cannot earn IORB themselves. Return to text
15. Other factors may affect the repo rates dealers offer to MMFs, such as the supply of alternative investments (like Treasury bills) and monetary policy uncertainty. Even so, dealers generally will not be willing to pay more than IORB to borrow from MMFs unless funding at IORB is unavailable from banks. Return to text
16. For a discussion of repo market conditions over year-end 2024, see Gowen (2025). Return to text
17. Such issues include cash demand, demand for specific securities, and regulatory constraints on dealers' repo lending. For instance, increased Treasury issuance from the middle of 2023 to 2024 may have contributed to strains on dealer intermediation capacity, elevating GCF repo rates over this period. Return to text
18. The TGA is a liability of the Federal Reserve. Cash moves in and out of the TGA on a day-to-day basis, while the size of the Federal Reserve's balance sheet does not change as frequently. Changes in the TGA therefore are typically offset by equal and opposite changes in other liabilities of the Federal Reserve like reserves. TGA moves are effectively exogenous as they are driven by the inflows and outflows of cash to the Treasury associated with the Treasury's security issuance and expenditures, as well as its receipts of tax payments, rather than by bank or dealer needs for liquidity. Return to text
19. Repo spreads are measured relative to the Federal Reserve's overnight reverse repo facility rate (ON RRP). We exclude the week of the September 17, 2019 repo spike and the month of March 2020 from these regressions to illustrate that these regressions have power outside of extreme episodes of scarcity or stress. Including these episodes leads to qualitatively similar results. Additionally, shortening the rolling regression window from 90 days to 30 days makes the indicator noisier but does not materially change our results. Return to text
20. Usually, inflows and outflows from the TGA on any given day are small, so that we can approximate a marginal effect of changes in reserves. However, this analysis should not be extrapolated to predict the effects of large changes in TGA balances, including those related to debt-ceiling dynamics, or to large changes in reserves, such as those over a tightening cycle. Return to text
21. See Gowen et al. (2025). Return to text
22. Using fed funds as their main liquid asset, FHLBs prefer to maintain a well-defined set of highly rated counterparties which borrow a steady large amount of cash each day at the same rate. Thus, FHLBs do not lend as much to domestic banks not subject to the LCR regulation ("non-LCR" banks) in the fed funds market. Return to text
23. Although empirical evidence points to segmentation in the fed funds market (see, for example, Anderson and Na (2024)), most theoretical studies do not incorporate segmentation (see, for example Poole (1968) or Afonso and Lagos (2015)). In those theoretical studies, banks trade to manage their liquidity and the EFFR reflects the marginal liquidity value of reserves, interest paid on reserves by the central bank, and balance sheet or search costs. Empirically, the rates paid in the true domestic interbank market reflect these theoretical models more closely than the (aggregate) EFFR. Supportive evidence for this claim is provided on days when interest on excess reserves (IOER) was adjusted relative to the fed funds target range (so-called "technical adjustments"). On such days, the rates paid in the true interbank market adjusted and the spread to IOER remained stable. In contrast, the transmission to the EFFR was muted, affecting the spread between EFFR and IOER. Return to text
24. FBOs profit by borrowing from FHLBs at rates below IORB and earning IORB on their reserves. FHLBs are willing to lend at rates below IORB because they cannot earn IORB. Differences in rates across FBOs mainly reflect balance-sheet and other costs related to their arbitrage strategies. This arbitrage trade is not profitable for domestic banks, in part because they are subject to the FDIC fees. Meanwhile, LCR banks borrow fed funds from FHLBs because this borrowing receives a favorable run-off rate and thus boosts these banks' LCRs. Although most LCR banks are domestic, some FBOs subject to the LCR also borrow to manage their LCRs. Return to text
25. In contrast to a volume-weighted average which reflects a muted response to even small changes in volumes in the tails of the rate distribution, the volume-weighted median does not reflect such changes. Return to text
26. Borrowing from non-FHLB lenders is unattractive for most FBOs and LCR banks. Return to text
27. Note that volume and spreads increased again in 2022 and 2023, as these measures reflect not only liquidity pressures due to reserve scarcity but also other factors. Return to text
28. Appendix Indicator 3 shows the total volume of the fed funds market, which did not show any early signal of reserve scarcity in 2018-2019. This contrasts with the top panel of Indicator 3, which is a subset of Appendix Indicator 3. Although the spread of EFFR over IORB did increase slightly during 2018, some of this increase was due to two technical adjustments in which the Federal Reserve lowered the IORB without changing the target range for the EFFR. As such, the increase cannot be attributed clearly to a less abundant supply of reserves. Return to text
29. We define a rate to be stale if it is the same as on the previous trading day. Return to text
30. As fed funds are FHLBs' main liquidity management tool, FHLBs are mainly concerned about investing a stable amount of cash at the end of each day and receiving it back early in the morning on the next day. Return to text
Gissler, Stefan, Sam Hempel, R. Jay Kahn, Patrick McCabe, and Borghan Narajabad (2025). "Monitoring Reserve Scarcity Through Nonbank Cash Lenders," FEDS Notes. Washington: Board of Governors of the Federal Reserve System, March 28, 2025, https://doi.org/10.17016/2380-7172.3699.
Disclaimer: FEDS Notes are articles in which Board staff offer their own views and present analysis on a range of topics in economics and finance. These articles are shorter and less technically oriented than FEDS Working Papers and IFDP papers.