FEDS Notes
August 02, 2024
Oil Price Shocks and Inflation in a DSGE Model of the Global Economy
Ignacio Presno and Andrea Prestipino
The 2022 inflation surge has renewed interest in the drivers of inflation, with special attention on the role of oil and other commodity prices given the large increase in these prices post-pandemic. In this note, we use a DSGE model of the global economy to quantify the impact on U.S. inflation and output of the oil shocks that drove oil prices up by about $45 per barrel in the first half of 2022, around Russia's invasion of Ukraine. We first describe the effects on the U.S. economy of an increase in oil prices triggered by a drop in the supply of oil from foreign economies, highlighting the key transmission channels. Next, we hit the model with oil supply shocks sized to generate an increase in oil prices as large as observed in the first half of 2022. According to the model, these oil price shocks noticeably affected headline inflation, adding almost one percentage point to it upon impact, while the effects on core inflation and economic activity were fairly small.
Our model enriches the two-country framework in Bodenstein et al. (2023a) by expanding it to three blocks—the U.S., the advanced foreign economies, and the emerging market economies—and by incorporating an oil sector subject to oil supply and demand shocks, modeled following Bodenstein et. al (2011). It includes a set of standard features that have been found to be important to capture the data, including nominal and real rigidities and financial frictions. We next describe the model-implied effects on the U.S. economy of an increase in global oil prices originated by exogenous oil production cuts abroad.
Effects of Oil Supply Shocks
The model assumes that oil is used both as part of households' final consumption basket and as an input in goods production. The final consumption good, $$ C_t $$, is a composite of a non-oil consumption good, $$ C_{Nt} $$, and oil, $$ O_{Ct} $$
$$$$ C_t=\left[\left(1-\omega_C\right)^\frac{1}{\theta}{C_{Nt}}^\frac{\theta-1}{\theta}+{\omega_C}^\frac{1}{\theta}{O_{Ct}}^\frac{\theta-1}{\theta}\right]^\frac{\theta}{\theta-1}, $$$$
where $$ \omega_C $$ is the weight on oil consumption, calibrated to match the end-use ratio of oil in final consumption. The non-oil consumption good is in turn a composite of domestic and foreign final goods. In this setting, headline inflation corresponds to the percent change in the price of $$ C_t $$, and core inflation to the percent change in the price of $$ C_{Nt} $$.
In the U.S. and abroad, firms produce final goods, $$ Y_t $$, using labor, capital, and oil as factor inputs, which are combined by operating the following production technology:
$$$$ Y_t=\left[\left(1-\omega_Y\right)^\frac{1}{\eta}{V_t}^\frac{\eta-1}{\eta}+{\omega_Y}^\frac{1}{\eta}{O_{Yt}}^\frac{\eta-1}{\eta}\right]^\frac{\eta}{\eta-1}, $$$$
where $$ \omega_Y $$ is the oil weight on production calibrated to match the end-use ratio of oil in production, $$ O_{Yt} $$ is the oil input, and $$ V_t $$ is a measure of value-added produced with labor $$ N_t $$ and capital inputs,
$$$$ V_t=e^{\zeta_t^A}{K_t}^\alpha{N_t}^{1-\alpha}, $$$$
where $$ e^{\zeta_t^A} $$ is the aggregate productivity level, subject to exogenous shocks. The oil elasticities of substitution in consumption and production, given by parameters $$ \theta $$ and $$ \eta $$, are set to 0.1 and 0.2, respectively. These parameter values, both significantly below unity, imply strong complementarities with oil in both consumption and production, consistent with the estimates of the oil elasticities found in Gagliardone and Gertler (2023).
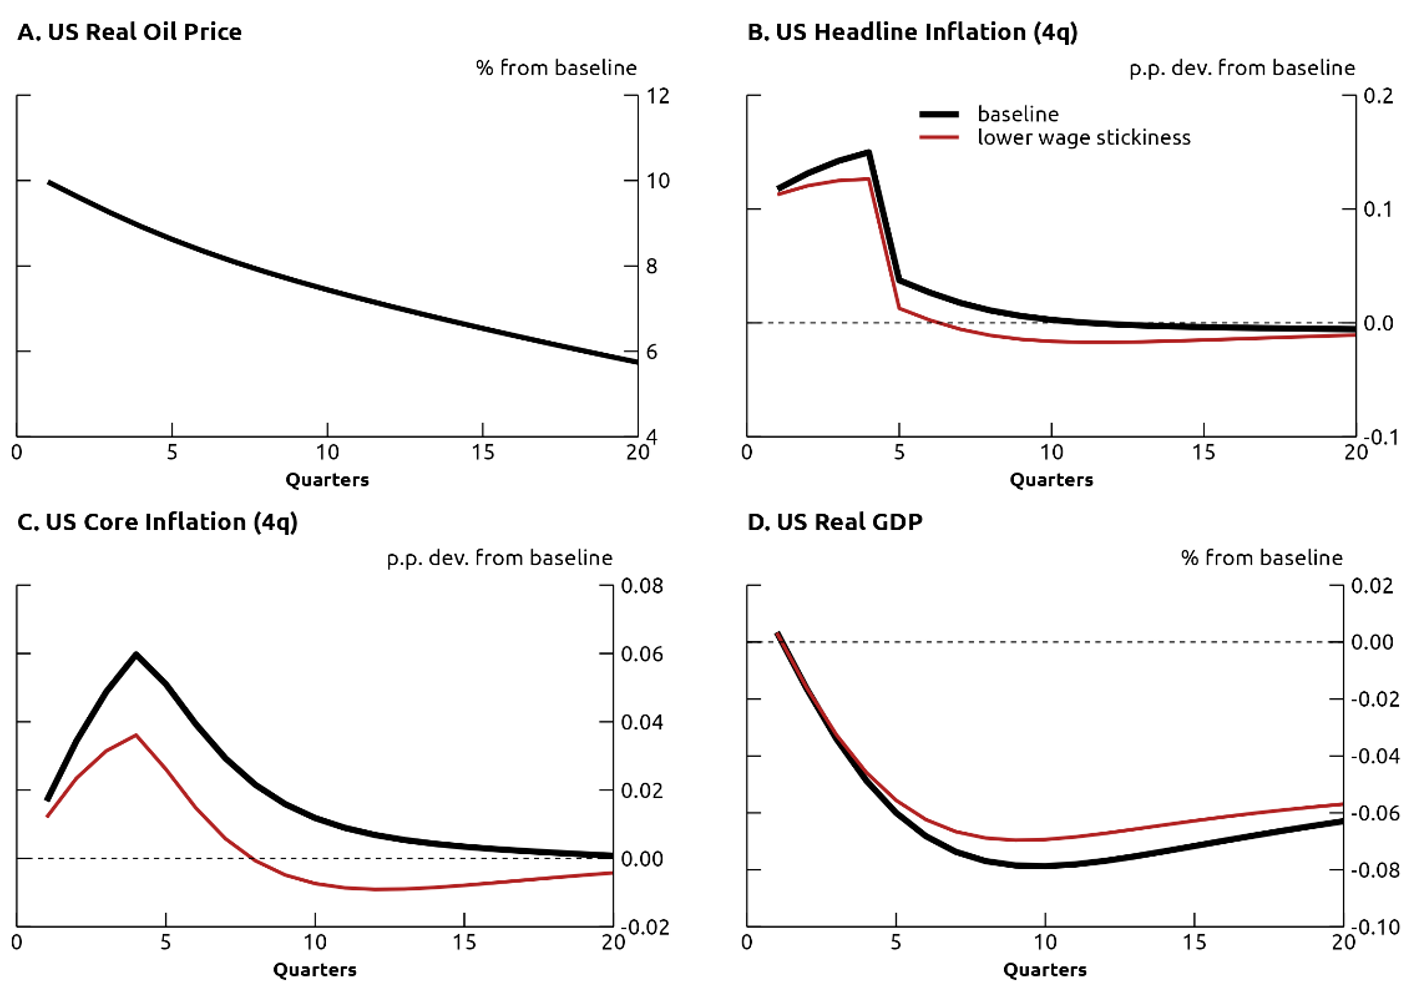
The black lines in Figure 1 show the impulse response of U.S. inflation and GDP to an adverse foreign oil supply shock in our model, calibrated to generate an increase in real oil prices of 10 percent (panel A). The shock causes headline inflation to rise 0.15 percent in the first year (panel B). In addition to the direct effect on headline inflation of higher oil prices, "second-round" effects on core prices also contribute to the overall rise in headline inflation, with core inflation increasing 0.06 percent (panel C). The increase in core prices is driven mainly by rising domestic goods prices and, to a lesser extent, import prices. The reason is that marginal costs of production go up, and these higher costs are passed to consumers through higher prices, both in the U.S. and abroad.
To provide further detail, consider that in the model, as in standard New Keynesian frameworks, a Phillips curve links domestic goods inflation to current and expected future real marginal costs. In this simulation, domestic firms' real marginal costs increase 0.1 percent, as shown in panel A of Figure 2. To understand the drivers of real marginal costs, we can express their log-deviation from steady state, $$ {mc}_t $$, as the sum of four terms, as follows:
$$$$ mc_{t} = \gamma_{0} \underbrace{p_{0t} - mpo_{t}}_{\text{real oil price gap}} + \gamma_{1} (1 - \alpha) \underbrace{(w_{t} - mpl_{t})}_{\text{real wage gap}} + \gamma_{1} \alpha \underbrace{(r_{Kt} - mpk_{t})}_{\text{real capital rate gap }} - \gamma_{1} \zeta_{t}^{A} $$$$
where $$ p_{Ot},\ w_t,r_{Kt} $$ are the log-deviations of the real oil price, the real wage, and rental rate of capital, respectively. Similarly, $$ {mpo}_t $$, $$ {mpl}_t $$, and $$ {mpk}_t $$ denote the log-deviations of the marginal product of oil, labor, and capital, respectively. The constants $$ \gamma_0 $$ and $$ \gamma_1 $$ are functions of the production technology parameters and are close to $$ \omega_Y $$ and $$ {1-\omega}_Y $$, respectively. Each of the first three terms is associated with a different factor input and captures a scaled gap between the factor price and its marginal product.
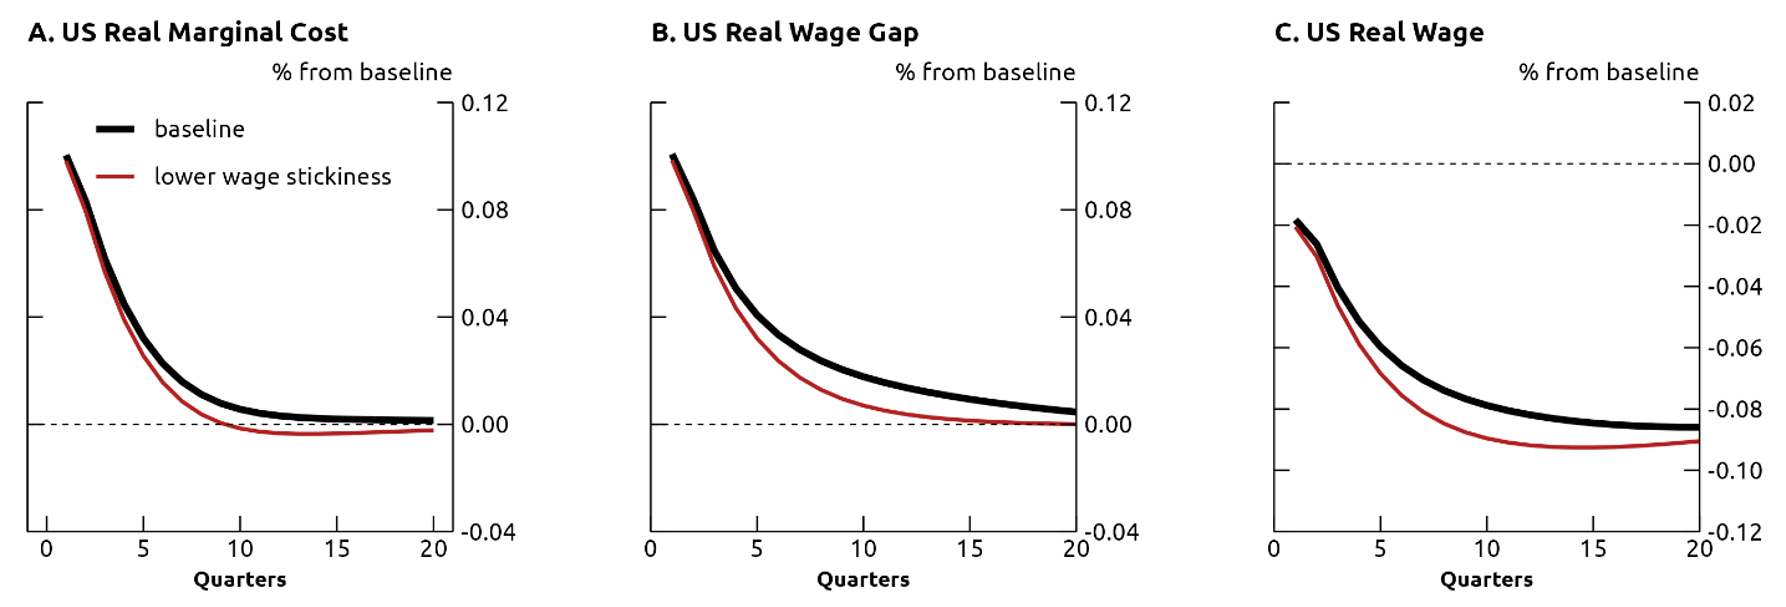
Interestingly, only a modest fraction of the increase in total real marginal costs is driven by the gap from higher real oil prices (represented by the first term), given the very small oil weight in production and the absence of price rigidities in the oil sector. The bulk of the increase in real marginal costs is attributed to a gap that opens between the real wage and the marginal product of labor, labeled the "real wage gap" and captured by the second term (panel B of Figure 2). While both the real wage and the marginal product of labor fall in the simulation, the latter falls faster than the former, leading to a positive gap that pushes up real marginal cost. The marginal product of labor falls because firms, facing higher oil prices, shift away from the oil input. The lower use of oil input depresses the marginal product of all other inputs, including labor.
Due to wage-setting frictions, the adjustment of real wages unfolds at a slow pace, preventing real wages to adjust downwardly to match the lower marginal product of labor. As a result, real wages end up being "too high" over the initial years, translating into elevated labor marginal costs and inducing domestic firms to raise prices.
As suggested by the previous discussion, a critical feature for the model to generate a positive pass-through of oil prices into core prices is the degree of wage stickiness in the economy. As shown by the red lines in Figure 1, when wages are less sticky, they adjust downwardly towards the marginal product of labor at a faster pace, getting close to zero after quarter 10, while in the baseline case it remains elevated much longer. Lower wages for households in turn dampen aggregate demand, and the increase in core inflation is smaller than in our baseline economy.
In addition to the rise in domestic prices, an increase in import prices also feeds into higher core U.S. inflation. Import prices rise because the rise in the price of oil also boosts production costs of foreign firms, in a way similar to the discussion above. An additional channel through which the oil price shock could affect import prices is through an endogenous response in the dollar exchange rate, though those effects are quantitatively very small in our simulation.1
As inflation increases, real incomes decline and U.S. consumption, investment, and output fall (shown in panel D of Figure 1). The contraction in output is gradual, as real rigidities prevent an immediate adjustment in domestic absorption. After 10 quarters, the level of GDP reaches its trough of around 0.08 percent below baseline. The modest share of the oil component in both production and consumption limits the extent to which economic activity declines.
Effects of the 2022H1 Surge in Oil Prices on the U.S. Economy
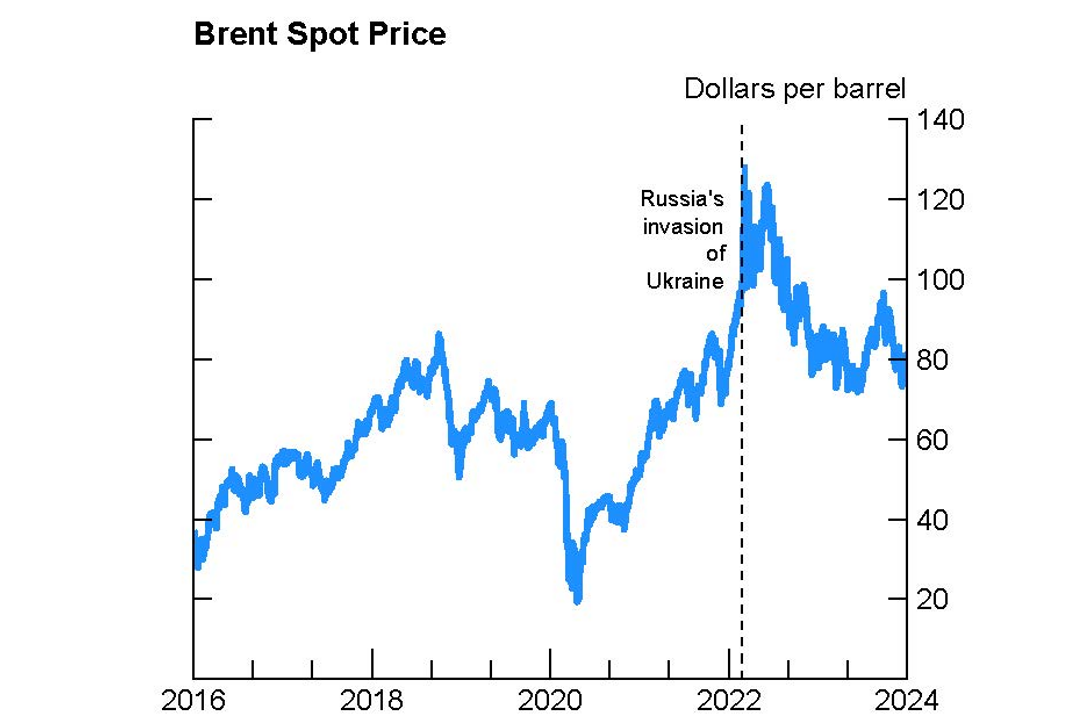
In February 2022, Russia launched an invasion of Ukraine after amassing troops near Ukraine's border. In response, many countries imposed broad economic sanctions on Russia, and the European Union announced a phased embargo on Russian oil exports to Europe. These geopolitical developments roiled global markets and drove up energy prices. Oil prices climbed from about $80 per barrel to almost $125 within the first two quarters of 2022, as shown in Figure 3 for the Brent spot price taken from Bloomberg.
Using our model, we next quantify the effect on U.S. inflation and GDP from such an increase in oil prices. We feed the model two consecutive shocks to the foreign supply of oil in 2022Q1 and 2022Q2 sized so that the real oil price increases by 30 percent in the first half of 2022, as in the data (after taking quarterly averages). We then plot in Figure 4 the model-implied effects against the actual outcomes. Looking at headline inflation in the left panel, higher oil prices accounted for almost one percentage point of the increase in headline in 2022Q1 (in annualized rates), and about half a percentage point of the increase in headline for 2022 overall. Turning to core, shown in the right panel, the contribution of the oil supply shocks was less front-loaded than for headline inflation, with only 0.17 percentage points of the increase in core in 2022 attributed to the oil supply shocks. As for GDP, our model implies that higher oil prices dampened U.S. output growth by 0.13 percentage points in 2022. Thus, while the energy shock impacted noticeably U.S. headline inflation in 2022, it had modest effects on U.S. core inflation and GDP.
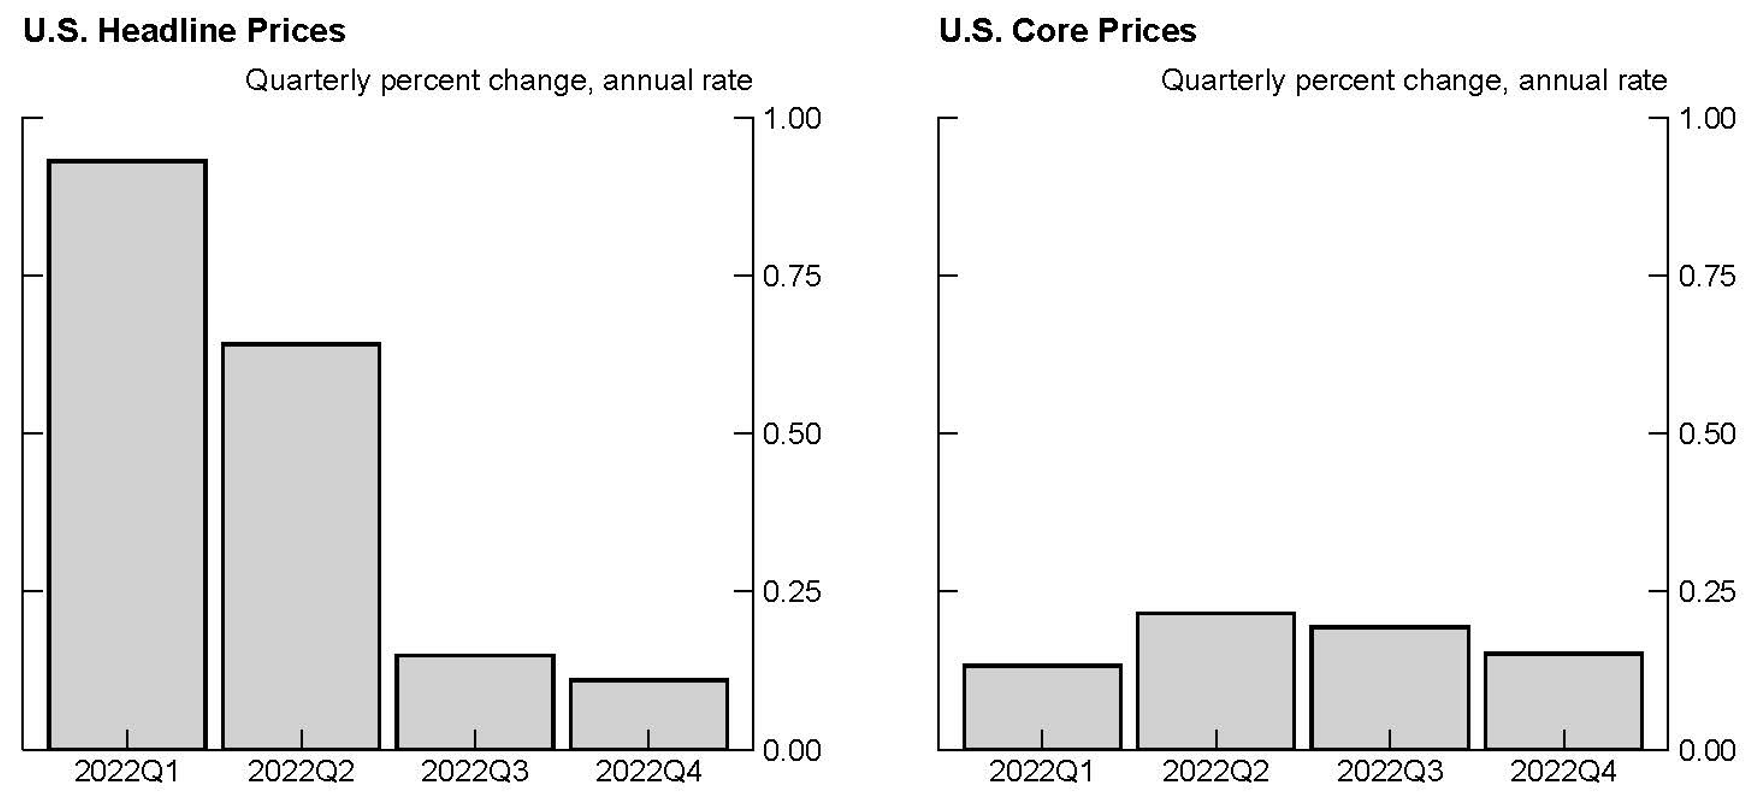
Note: The grey bars show the contribution to US headline (core) inflation from foreign oil supply shocks in 2022H1 using the model.
References
Bodenstein, M., C. Erceg, L. Guerrieri, 2011. "Oil Shocks and External Adjustment", Journal of International Economics, vol. 83, pages 168-184.
Bodenstein, M., L. Guerrieri, L. Killian, 2012. "Monetary Policy Responses to Oil Price Fluctuations", IMF Economic Review, International Monetary Fund, vol. 60, pages 470-504.
Bodenstein, M., P. Cuba-Borda, A. Queralto, 2023. "The Transmission of Global Risk," FEDS Notes. Washington: Board of Governors of the Federal Reserve System, June 2023.
Bodenstein, M., P. Cuba-Borda, N. Gornemann, I. Presno, A. Prestipino, A. Queralto, A. Raffo, 2023. "Global Flight to Safety, Business Cycles, and the Dollar." Mimeo
Erceg, C.; L. Guerrieri, and C. Gust, 2006. "SIGMA: A New Open Economy Model for Policy Analysis", International Journal of Central Banking, March 2006 issue, vol. 2, pages 1-50.
Gagliardone, L., M. Gertler, 2023. "Oil Prices, Monetary Policy and Inflation Surges", NBER Working Paper Series, Working Paper 31263. May 2023.
Itskhoki, O., and D. Mukhin, 2021. "Exchange Rate Disconnect in General Equilibrium," Journal of Political Economy, University of Chicago Press, vol. 129(8), pages 2183-2232.
1. Bodenstein et. al (2011) examine the response of the dollar to oil price shocks and find that it strongly depends on whether the U.S. is a net oil importer or exporter in the long run. Return to text
Presno, Ignacio, and Andrea Prestipino (2024). "Oil Price Shocks and Inflation in a DSGE Model of the Global Economy," FEDS Notes. Washington: Board of Governors of the Federal Reserve System, August 02, 2024, https://doi.org/10.17016/2380-7172.3570.
Disclaimer: FEDS Notes are articles in which Board staff offer their own views and present analysis on a range of topics in economics and finance. These articles are shorter and less technically oriented than FEDS Working Papers and IFDP papers.