FEDS Notes
February 28, 2025
Predicting Credit Card Delinquency Rates
Kayleigh Barnes, Connor Bopst, and John Driscoll
Introduction
Consumer credit card delinquency rates, after having rapidly fallen to record-low levels in the early stages of the pandemic, increased sharply, reaching their pre-pandemic levels by 2023:Q1. Since then, delinquencies have risen further, albeit at a diminishing rate, and as of 2024:Q3 stand about 125 basis points above those early 2023 levels (Figure 1). These continued increases could reflect factors that were, before the pandemic, believed to affect household credit quality. They could also be attributable to something unusual related to the pandemic that might indicate a more consequential deterioration in households' financial positions.

Note: Fraction of balances at least 30 days past due, excluding severely derogatory balances.
Source: Federal Reserve Bank of New York Consumer Credit Panel/Equifax.
In this note, we report results from estimating a simple model to predict credit card delinquency rates, using as explanatory variables factors commonly believed to affect household credit performance: interest rates, the unemployment rate, the level of indebtedness, and measures of credit availability to riskier borrowers. We estimate the model over the period from 2000:Q1–when credit-bureau based measures of delinquency rates become available to us–to 2019:Q4–just before the pandemic. As our results are broadly similar over the choice of variables and model specifications, for brevity we report only our preferred specification. It uses the prime rate, the unemployment rate, revolving credit balances adjusted for inflation, the net fraction of banks reporting on the Senior Loan Officer Opinion Survey (SLOOS) that they had tightened credit card loan underwriting standards over the past three months, lagged [four] quarters, and the share of nonprime credit card balances, lagged four quarters. The model has high goodness of fit–with an adjusted R-squared of .97–and it closely matches the in-sample contour of credit card delinquency rates. We use the model to predict the behavior of delinquency rates out-of-sample from 2023:Q1 to 2024:Q3. The model shows an increase in delinquencies of about 120 basis points, slightly below the actual change in delinquency rates over that period. With the caveat that the explanatory variables can all affect one another, so that we cannot make causal inferences, we find that changes in credit availability to riskier borrowers and to the level of real debt account for the majority of these increases, with the unemployment rate and prime rate playing smaller roles.
The model notably underpredicts the delinquency rate in levels in the post pandemic period. This underprediction could be due to upward "credit score migration" during the pandemic in which many borrowers saw an increase in their credit scores sufficient to move them out of subprime and near-prime categories to prime even though their underlying risk remained unchanged.1 To examine this possibility, we recalculate the share of nonprime credit card balances after fixing the credit score distribution at its 2019:Q4 level, and find that doing so considerably reduces the difference between the predicted and actual delinquency rates between 2023:Q1 and 2024:Q3.
Since the observed increase in the delinquency rate is close to that predicted by our simple model, the scope for unusual pandemic-related factors to have large effects on that rise is reduced. That said, we emphasize that as the model is not causally estimated, it certainly remains possible that unmeasured variables are driving the results, or that pandemic-related factors are affecting our predictors.
In the remainder of this note we discuss our model choice, the data, and results from estimating the model.
Model Choice
Our goal is to determine how well a simple model—linear, with a few variables—that fits pre-pandemic delinquency rates can account for the rise in such rates over the post-pandemic period. To do this, we estimate our model over the period from 2000:Q1 to 2019:Q4. We then compare predictions of that model over the pandemic (2020:Q1 to 2022:Q4) and post-pandemic (2023:Q1 to 2024:Q3) periods. To motivate variable choices, we argue that aggregate consumer delinquency rates should rise when the cost of credit increases, when there is job loss, when borrowers take on more debt, and when there are increases in debt-holding households with lower credit scores. Each of these factors can affect each other–for example, job loss is likely to increase when interest rates rise–so the regression coefficients will not capture the causal impact of a change in any one of these factors. Although we used a range of variables for each of these factors, we found results to be broadly similar, with most specifications having relatively strong goodness-of-fit measures, but some greater variation in their ability to match the contour of delinquency rates. In our preferred model specification, we capture the cost of credit through the prime rate (most credit cards have floating rates that are fixed markups over prime), labor market conditions through the unemployment rate, and the level of debt through real revolving credit. We also capture two aspects of credit availability: the net fraction of banks reporting tightening credit card loan underwriting standards on the SLOOS and the nonprime share of credit card balances. We provide details and summary statistics in the next section, but first discuss some aspects of the credit availability and quality measures below.
While we expect that SLOOS tightening should eventually lead to a decline in the delinquency rate, as new cards issued will be to higher credit-score borrowers, this effect could take some time, as balances from existing accounts far exceed those of new accounts. Banks may also tighten when they see borrower credit quality begin to deteriorate, leading to a positive association between the delinquency rate and SLOOS tightening. Hence the correlation between SLOOS tightenings and delinquency rate rises could, on net, be positive. To help reduce this second effect, we lag SLOOS tightening by [four] quarters. We believe this allows adequate time for SLOOS changes to be reflected in card issuance and borrowers on newly-issued cards to become delinquent.
The share of nonprime balances likely affects both borrower demand for credit card debt and supply by lenders, though effects on supply may be smaller in the short term due to limitations imposed by Dodd-Frank and the Federal Reserve's Regulation Z in changing credit card terms after issuance. Since becoming delinquent has a large impact on credit scores, there is a mechanical relationship between delinquency rates and the share of nonprime balances. To account for this, we lag the credit score distribution by four quarters, though borrower behavior leading up to full delinquency can still reduce credit scores.
Data
Our data is quarterly, and spans the period from 2000:Q1 through 2024:Q3. For credit card delinquency rates, we draw from the Federal Reserve Bank of New York's Consumer Credit Panel/Equifax (hereafter CCP), an anonymized 5 percent random sample of consumers with a US credit file, reporting the fraction of sampled credit card balances that are at least 30 days past due in a quarter. We exclude severely derogatory balances — those paired with a charge-off. As delinquency rates are highly seasonal, we seasonally adjust using ARIMA X-13.
For the variables in our preferred specification, we average daily data on the prime interest rate, defined as the upper end of the target range for federal funds rate plus 300 basis points, and the monthly unemployment rate from the Bureau of Labor Statistics (BLS). Nominal monthly revolving credit balances from the Federal Reserve's Statistical Release G.19, "Consumer Credit", are averaged and adjusted using the BLS Consumer Price Index to get our measure of real revolving credit in trillions of 2024:Q3 dollars.2
We include two measures of credit availability. The first is the net fraction of banks reporting on the Federal Reserve's Senior Loan Officer Opinion Survey that they had tightened underwriting standards on credit card loans over the past three months, weighted by bank credit card balances and lagged [four] quarters. The second is the fraction of credit card balances (seasonally adjusted, and excluding severely derogatory balances) held by borrowers with nonprime credit card ratings four quarters prior. Table 1 presents the summary statistics.
Table 1: Summary Statistics
| Statistic | $$N$$ | Mean | Std. Dev. | Min | Max |
|---|---|---|---|---|---|
| Delinquency Rate | 80 | 4.21 | 1.34 | 2.4 | 7.16 |
| Prime Rate | 80 | 4.86 | 1.88 | 3.25 | 9.5 |
| Unemployment Rate | 80 | 5.88 | 1.81 | 3.6 | 9.93 |
| Real Revolving Balances | 80 | 1.29 | 0.1 | 1.15 | 1.5 |
| Nonprime Balance Share | 80 | 0.5 | 0.08 | 0.42 | 0.68 |
| SLOOS | 80 | 0.11 | 0.33 | -0.64 | 0.99 |
Source: Federal Reserve Bank of New York CCP/Equifax, Federal Reserve Board, Bureau of Labor Statistics, Federal Reserve Board Statistical Release G.19.
Results
Table 2 presents the results of our preferred specification. The model explains substantial amounts of the variation in delinquency rates, with an adjusted R-squared of .97. All coefficients, except for the prime rate coefficient, are statistically significant at the 1 percent level.
Table 2: Delinquency Rate Prediction Estimates
| Dependent Variable: Credit Card Delinquency Rate |
|
|---|---|
| Prime Rate | -0.02 |
| (0.02) | |
| Unemployment Rate | 0.45*** |
| (0.02) | |
| Real Revolving Credit | 6.21*** |
| (0.34) | |
| SLOOS | 0.64*** |
| (0.42) | |
| Nonprime Balance Share | 11.42*** |
| (0.45) | |
| $$N$$ | 80 |
| Adjusted $$R^2$$ | 0.97 |
Note: This table presents results from estimating quarterly linear regressions of seasonal adjusted quarterly delinquency rate on the prime interest rate (in percentage points), the unemployment rate (percentage points), real revolving credit card balances (billions of dollars), SLOOS standards for consumer credit card loans lagged one year (percent) and the non-prime share of credit card balances lagged one year (percent). The data spans 2000 to 2019. All variables except the prime rate and SLOOS are seasonally adjusted. Standard errors are reported in parentheses.
Source: Authors' calculations, from Federal Reserve Bank of New York CCP/Equifax, Federal Reserve Board, Bureau of Labor Statistics, Federal Reserve Board Statistical Release G.19.
Though our model is not causally identified, we can still interpret the general associations between the explanatory variables in our model and the delinquency rate. The prime rate effect is near zero and is not statistically significant. Because the cost of debt should affect the delinquency rate, this implies that the prime rate is likely collinear with the other variables in our model. A 100 basis point increase in the unemployment rate is associated with about a 45 basis point increase in the delinquency rate. A $10 billion increase in level of real revolving consumer credit in specification 1 is associated with about a 6 basis point increase in the delinquency rate. For every 10 percentage point increase in the net fraction of banks tightening credit card loan underwriting standards in the SLOOS, delinquency rates rise by about 6 basis points. This positive relationship between tightening and delinquencies implies that banks tighten as delinquencies begin to rise and that this effect outweighs the negative relationship from tightening credit standards leading to lower future delinquencies. Finally, a one percentage point increase in non-prime balance share is associated with an increased delinquency rate by about 11 basis points.
Figure 2 plots model fitted values (the red line) with a 95 percent confidence interval (the shaded area, bounded by dotted black lines) against the realized data (the thick black line). The figure plots the entire sample, including the out-of-sample prediction interval, shown shaded in blue. The model does a good job of explaining the contour of delinquency rates over the 2000:Q1 to 2019:Q4 period. The spike in the unemployment rate at the beginning of the COVID-19 pandemic leads the model to far over-predict the level of delinquency rates. For the post-2023:Q1 period, the model very slightly underpredicts the actual rise, with a rise of 120 basis points – slightly smaller than the observed increase of about 125 basis points.
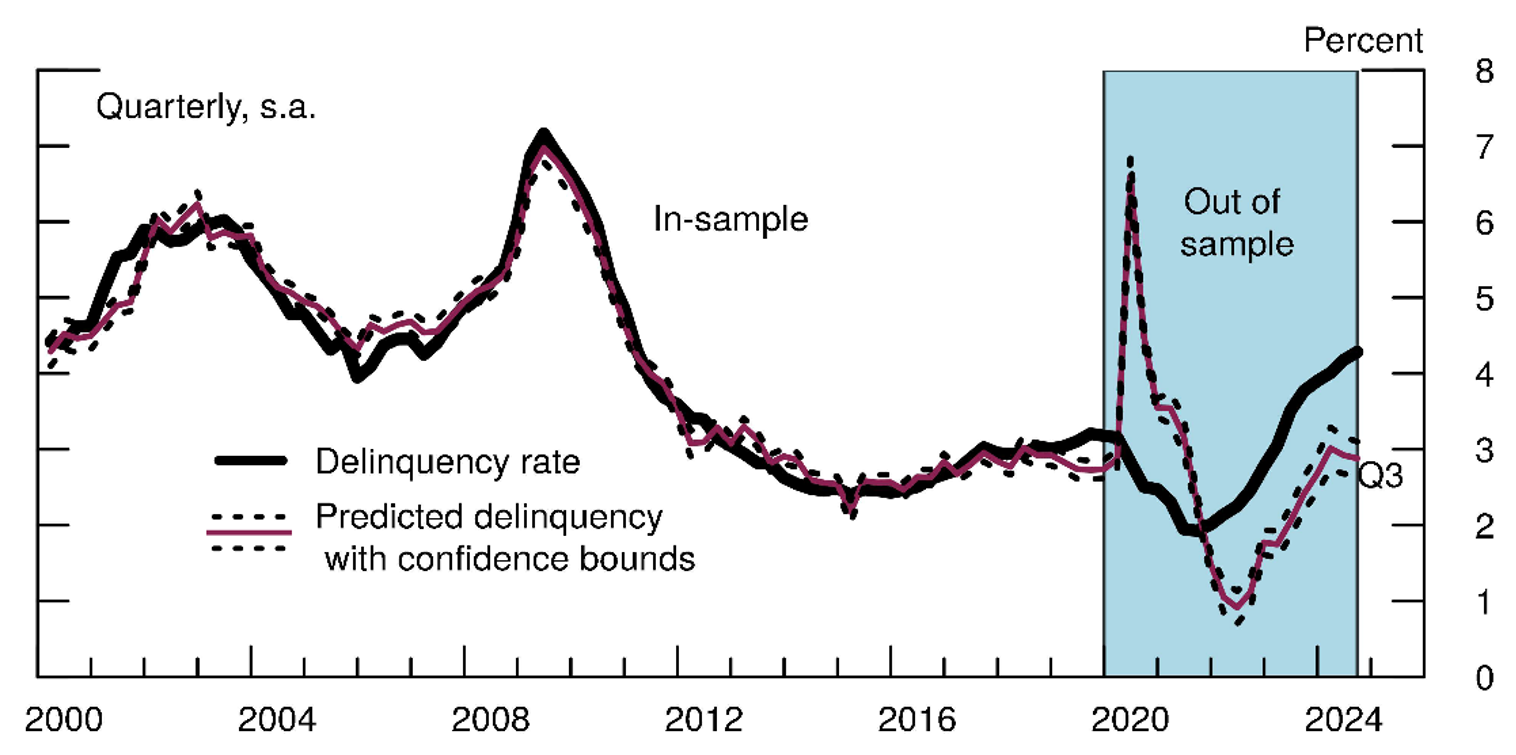
Note: Figure plots fitted values from a regression of quarterly delinquency rate on the prime rate, unemployment rate, real revolving credit, the SLOOS fraction of banks reporting tightening, lagged one year, and the nonprime share of balances. Fitted values are plotted in red, with dotted black lines denoting the 95% confidence interval. The realized delinquency rate is plotted in the black line. The models are trained on quarterly data from 2000:Q1 through 2019:Q4; the model's performance in the out of sample period of 2020:Q1 through 2024:Q3 is highlighted in blue.
Source: Authors' calculations, from Federal Reserve Bank of New York CCP/Equifax, Federal Reserve Board, Bureau of Labor Statistics, Federal Reserve Board Statistical Release G.19.
Figure 3 plots the contribution of each predictor included in our preferred specification over the course of the in-sample and out-of-sample periods.3 Over the whole sample, most of the levels of delinquency rates are attributable to real revolving balances, and the share of nonprime balances. Over 2003:Q1 to 2024:Q3, the increases in the contributions of the SLOOS and nonprime balance share, followed by real credit card balances, led to the increase in delinquency rates, while the contributions of the unemployment rate and prime rate were little changed over the period.
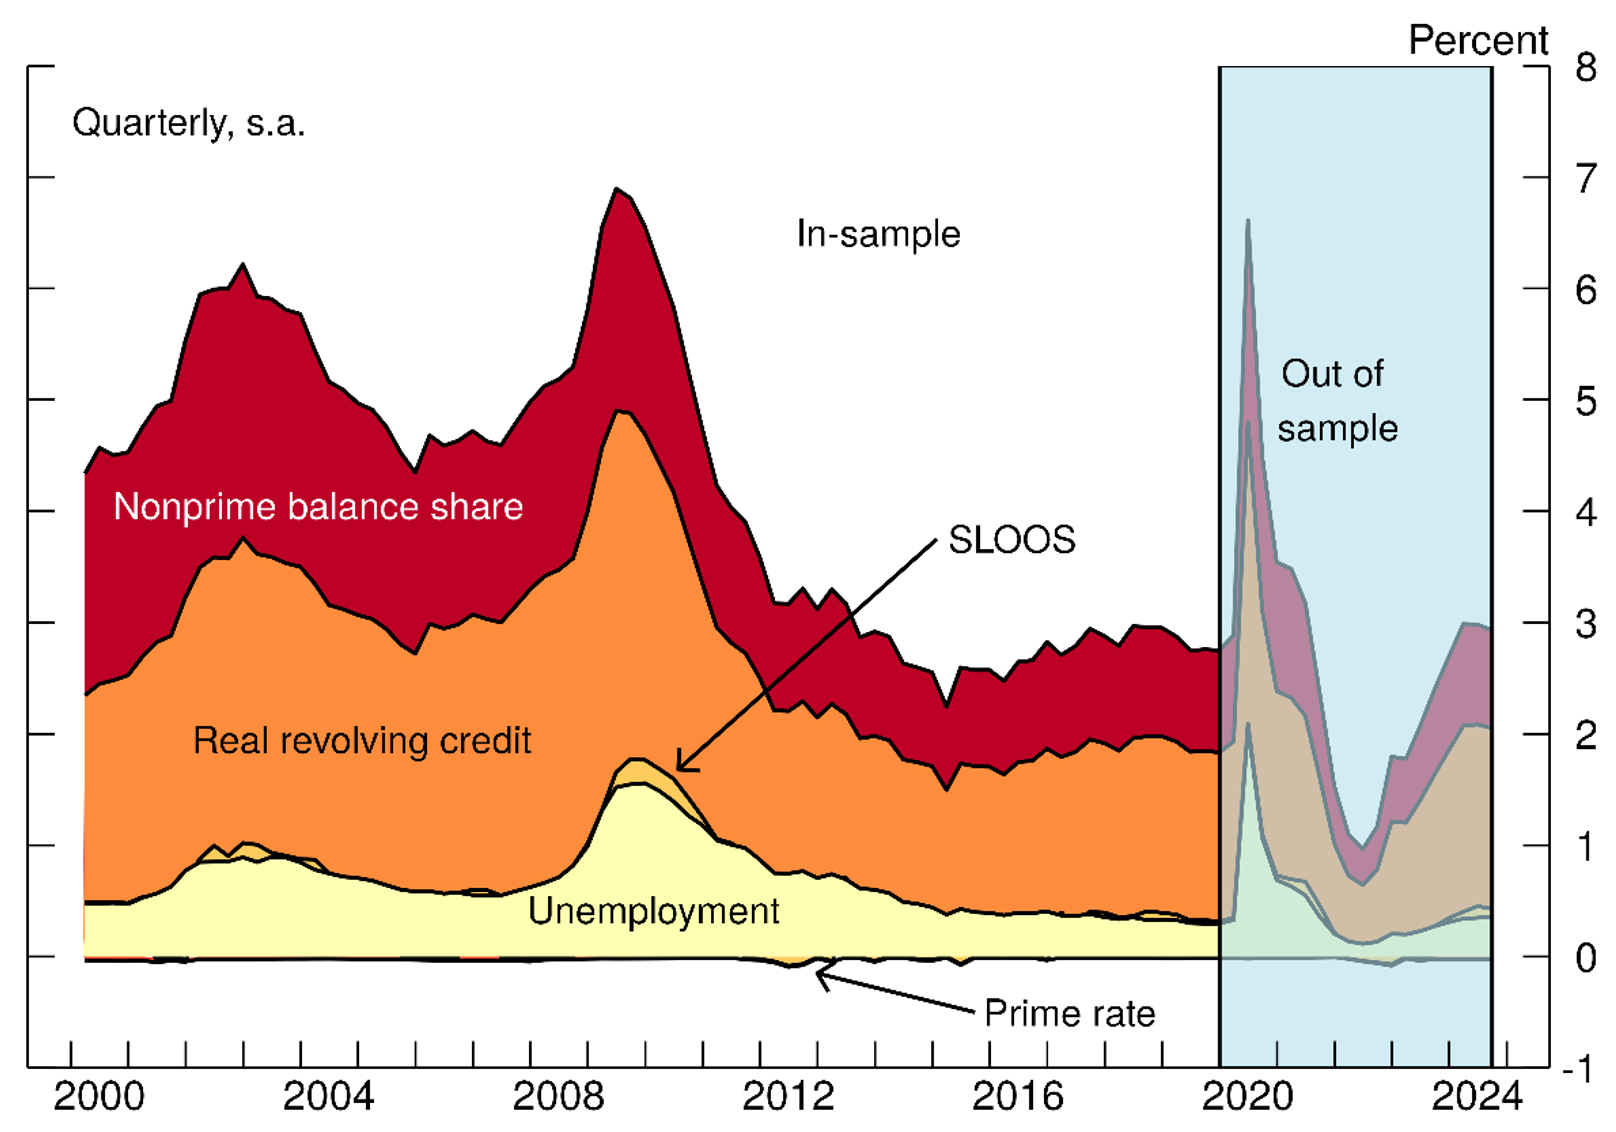
Note: Figure plots the contributions of each variable to the fitted value delinquency rate, excluding the constant term. The model is trained on quarterly data from 2000:Q1 through 2019:Q4; the out of sample period of 2020:Q1 through 2024:Q3 is highlighted in blue.
Source: Authors' calculations, from Federal Reserve Bank of New York CCP/Equifax, Federal Reserve Board, Bureau of Labor Statistics, Federal Reserve Board Statistical Release G.19.
Given the model's underprediction of credit card delinquency rates in the out of sample period—rates, on average, were 130 basis points lower over 2024:Q3—we are concerned that the nonprime balance share overestimated improvements in borrowers' underlying risk profiles since the pandemic due to credit score migration. Building on the work done in Driscoll et al. (2024), we conduct a counterfactual analysis where we recalculate the nonprime balance share in the out of sample period by fixing the credit score distribution at its 2019:Q4 value. We plot the predicted delinquency rate using this counterfactual nonprime share of balances along with our original predicted values and the realized values in Figure 4. The figure shows that correcting for the credit score migration brings the levels of our predicted delinquency rate significantly closer to the observed levels. The model predicts a rise of about 130 basis points over the 2023:Q1 to 2024:Q3 period, comparable to the 120 basis point rise predicted by the previous specification. However, the counterfactual model predicts delinquency rate levels that are on average 85 basis points higher over the period. While we do not argue that this new nonprime balance share is the "true" nonprime balance share, this analysis provides insight into how credit score migration could have changed the estimated impact of the nonprime balance share.
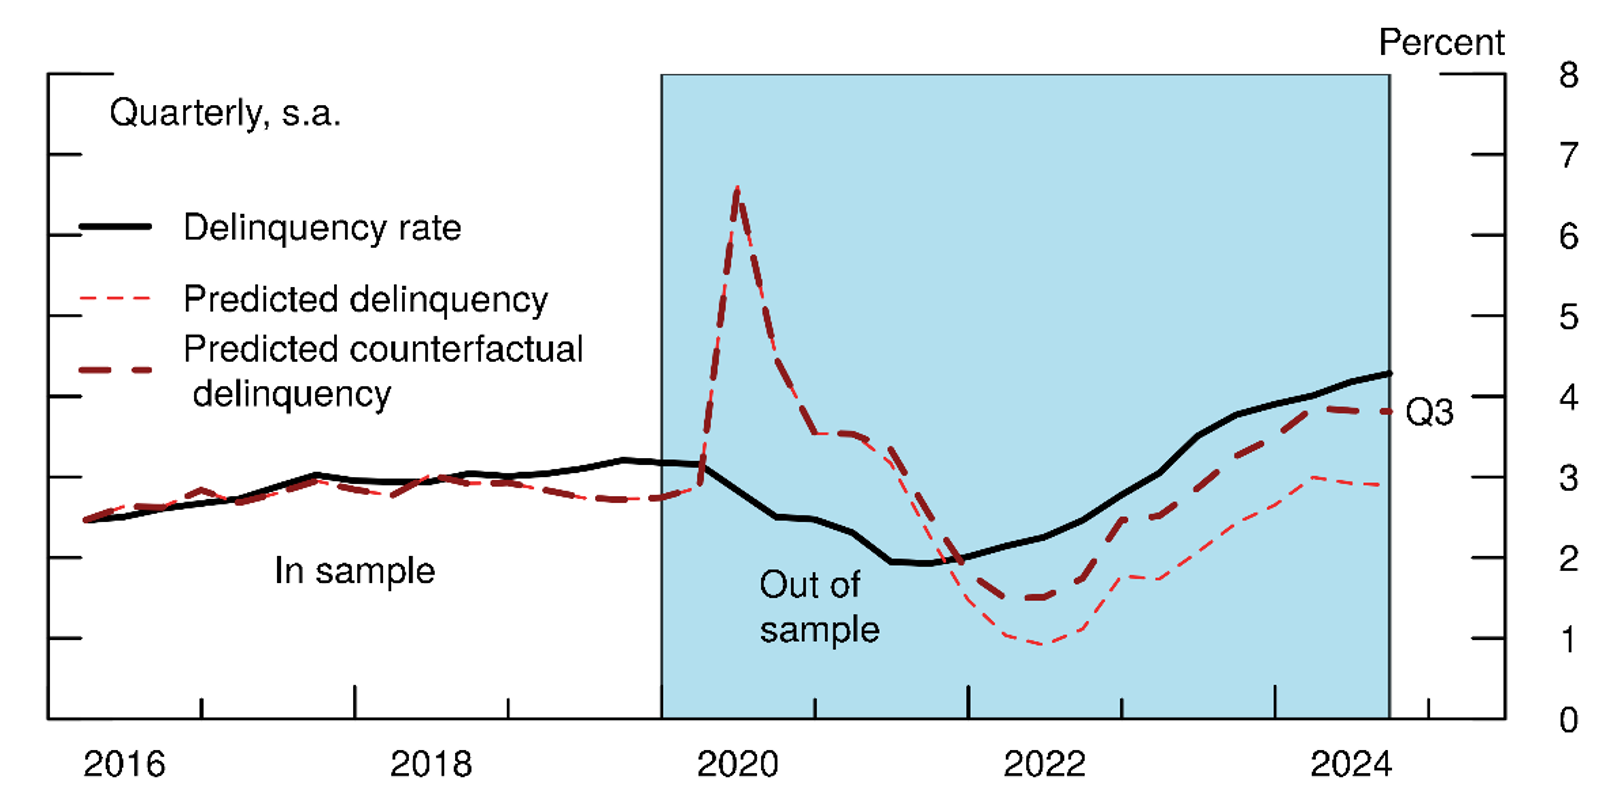
Note: This figure plots the realized delinquency rate, the predicted delinquency rate from specification 2 and the predicted delinquency rate from specification 2, fixing the nonprime share at its 2019:Q4 level. The out of sample period of 2020:Q1 through 2024:Q3 is highlighted in blue.
Source: Authors' calculations, from Federal Reserve Bank of New York CCP/Equifax, Federal Reserve Board, Bureau of Labor Statistics, Federal Reserve Board Statistical Release G.19.
In addition to our primary specification, we estimated a range of alternative specifications, including ones with the ratio of debt to disposable personal income, the growth in real debt, different choices for the interest rate, and first-differenced specifications, among others. Those models tend to work less well than the ones presented here by having lower goodness of fit, not matching the contours of delinquency rates as well, or predicting delinquency rates out of sample far above or below those observed in practice.
Our simple model can be used to forecast the delinquency rate if we forecast our predictor variables. Most of the explanatory factors have been flat or declining in recent quarters, suggesting that if that behavior continues, credit card delinquency rates will gradually flatten out and eventually decline. However, if macroeconomic conditions deteriorated more than expected or borrowers accumulated more credit card debt, delinquency rates could continue to rise.
Conclusion
We estimate a simple model of credit card delinquency rates over the pre-pandemic period, with measures of the cost of credit, level of credit card debt, the unemployment rate, and credit availability for nonprime borrowers. Our preferred specification has high goodness-of-fit and well-matches the contour of observed delinquency rates. The rise in credit card delinquency rates observed over the past several years is about in line with predictions of the model, with the observed 125 basis point increase close to the about 120 basis point increase from the latter. Most of the post-pandemic changes are due to increases in credit availability to riskier borrowers and rises in real debt. These results reduce the likelihood that missing factors are beginning to create broader financial fragility across households, though they by no means rule out that possibility.
References
Driscoll, John C., Jessica N. Flagg, Bradley Katcher, and Kamila Sommer (2024). "The Effects of Credit Score Migration on Subprime Auto Loan and Credit Card Delinquencies," FEDS Notes. Washington: Board of Governors of the Federal Reserve System, January 12, 2024.
Goodman, Sarena, Geng Li, Alvaro Mezza, and Lucas Nathe (2021). "Developments in the Credit Score Distribution over 2020," FEDS Notes. Washington: Board of Governors of the Federal Reserve System, April 30, 2021.
1. See Driscoll, John C., Jessica N. Flagg, Bradley Katcher, and Kamila Sommer (2024). "The Effects of Credit Score Migration on Subprime Auto Loan and Credit Card Delinquencies," FEDS Notes. Washington: Board of Governors of the Federal Reserve System, January 12, 2024. Return to text
2. Note that the G.19 measure is the sum of both purchases and revolved balances. Return to text
3. We exclude the contribution of the (negative) constants, and re-scale the remaining contributions appropriately. Return to text
Barnes, Kayleigh, Connor Bopst, and John Driscoll (2025). "Predicting Credit Card Delinquency Rates," FEDS Notes. Washington: Board of Governors of the Federal Reserve System, February 28, 2025, https://doi.org/10.17016/2380-7172.3732.
Disclaimer: FEDS Notes are articles in which Board staff offer their own views and present analysis on a range of topics in economics and finance. These articles are shorter and less technically oriented than FEDS Working Papers and IFDP papers.