FEDS Notes
March 08, 2024
Quantifying Treasury Cash-Futures Basis Trades
Jonathan Glicoes, Benjamin Iorio, Phillip Monin, and Lubomir Petrasek1
The Treasury cash-futures basis trade exploits the difference in prices between a Treasury security and a related Treasury futures contract – the so-called cash-futures basis – by purchasing the asset that is relatively undervalued and selling the other in a bet that the prices will converge. Basis traders support Treasury market functioning by keeping the prices of Treasury futures near their fair value relative to Treasury securities and by serving as an important source of demand for Treasury securities, including during the 2017-2019 period of quantitative tightening when basis traders absorbed much of the increased Treasury supply. However, the basis trade is typically highly leveraged, which can increase Treasury market fragility. Research has found that the rapid unwinding of basis trades by hedge funds contributed to the Treasury market stress in March 2020.2
Visibility into the volume of basis trades has previously been limited, with most market participants using short positions in Treasury futures held by leveraged funds from the CFTC Traders in Financial Futures report to gauge basis trading activity.3 However, leveraged funds may hold these positions for a variety of reasons other than the basis trade, suggesting that this measure may overestimate basis-related activity. In this note, we introduce two kinds of metrics that allow us to assess the extent of Treasury cash-futures basis trades: (1) comprehensive estimates of hedge funds' Treasury holdings and their repo activity derived from SEC Form PF; (2) a near real-time estimate of likely basis trade volumes derived from FINRA TRACE data on cash-market transactions in Treasury securities. Additionally, we discuss a measure of the basis that accounts for the delivery options in a short Treasury futures position and provides improved insights into the expected profitability of the trade.
These measures, together with the Treasury futures positions of leveraged funds, allow us to assess basis trading activity from all salient perspectives: profitability, the cash leg of the transaction and its financing, and the futures leg of the transaction. We find that the basis trade has reemerged recently. We estimate that hedge funds have amassed at least $317 billion in Treasury holdings related to basis trades since the first quarter of 2022, although the volume of the trade is likely significantly lower than implied by leveraged funds' Treasury futures positions alone.4
The Treasury Cash-Futures Basis
The Treasury cash-futures basis trade is a convergence trade that profits off the spread between the price of Treasury futures contracts and the Treasury securities that can be delivered into those futures. Typically, the position consists of a repo-financed purchase of a Treasury security and the simultaneous sale of a corresponding Treasury futures contract. Thus, the trade's profit is based on the difference in the prices paid and received for the cash and futures legs, net of carry and financing costs.
We measure the basis in terms of the expected annualized return on a trade that sells a Treasury futures contract and simultaneously purchases the associated cheapest-to-deliver bond, financing the bond in term repo until the optimal futures delivery date.5 A positive basis indicates that the futures contract is relatively more expensive than the cash security, so that an arbitrageur can expect to profit from a trade that is short a Treasury futures contract and long a Treasury security (referred to as the "long basis trade").6
Compared to other commonly used measures of the basis, our measure considers optimal delivery timing and bond-specific repo rates, which may result in a different selection of the cheapest-to-deliver bond. Formally, our measure of the basis is the option-adjusted basis net of carry (OABNOC), expressed as an annualized yield. That is,
Equation 1
$$$$ OABNOC_{Yield} = \left[{\left(CF \times P_{F}\right) + AI + O – P_{T} \over{P_{T}}} \times {360 \over{t}} \right] – R_{Repo} $$$$
where the first term in the numerator is the futures invoice price (the futures conversion factor, $$ CF $$, times futures price, $$ P_F $$, plus accrued interest, $$ AI $$), $$ O $$ represents the estimated value of the options embedded in the futures contract, $$ P_T $$ is the "dirty" or full price of the cheapest-to-deliver Treasury bond, and $$ R_{Repo} $$ is a quote from a major broker-dealer on a bond-specific term repo financing rate expiring in $$ t $$ days on the optimal futures delivery date. This expression reflects the annualized $$ t $$-day holding period return for the basis trader, accounting for the inflows from the sale of the futures contract, the delivery option value, and the outflows from purchasing the Treasury security and financing it in repo. Optimal delivery of the futures contract in $$ t $$ days, which also corresponds to the assumed holding period of the trade, is determined by whether the position has a positive or negative carry. If the marginal financing cost exceeds the marginal revenue of extending the trade's holding period, we assume that the basis trader will deliver the Treasury security into the futures contract on the earliest date; otherwise, we assume the basis trader delays delivery until the last delivery date.
Figure 1 depicts the basis for the for the 2-, 5-, and 10-year Treasury futures contract tenors, using pricing data for the contract with the highest open interest within each tenor at a given time. We shade two periods of heightened basis trading activity, which we determine using the proxies discussed later in this note. The first period, from 2018 to early 2020, saw basis measures that were on average positive, which might have motivated a buildup in long basis trades during that time. Following a spike in the bases during the Treasury market sell-off in March 2020, the bases were mostly near zero or negative until mid-2022. The second basis trade period, beginning in the second half of 2022, also saw largely positive bases in the 2-, 5-, and 10-year tenors, suggesting that the basis trade was again profitable.
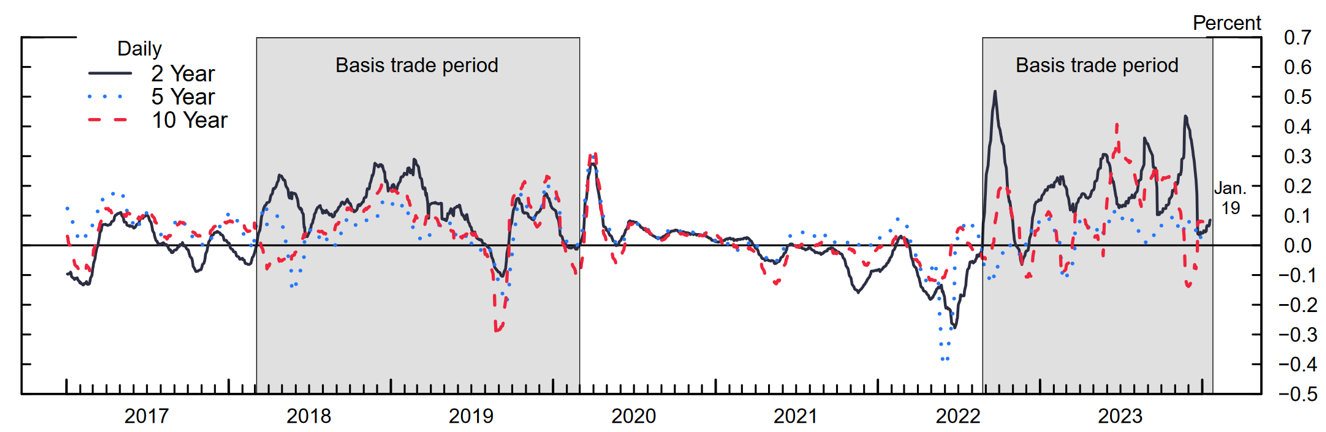
Note: Series presented as 20 day moving average.
Source: J.P. Morgan Markets, authors’ calculations.
Several factors may have contributed to the elevated basis in these two periods. First, large net supplies of Treasury securities amid elevated levels of Treasury issuance and Federal Reserve balance sheet normalization might have depressed the prices of Treasury securities relative to those of Treasury futures. Second, high demand from asset managers for Treasury futures might have increased futures prices relative to cash securities, as asset managers may prefer both the higher liquidity as well as the implied leverage of futures positions relative to cash instruments. Finally, during the most recent period, interest rate volatility has been elevated and accompanied by lower Treasury cash market liquidity, potentially leading hedge funds to require greater returns to offset the increased risks they face and simultaneously increasing mutual fund demand for futures relative to cash securities.
Existing Basis Trade Proxy from the Futures Market
Leveraged funds' short Treasury futures positions published by the CFTC serve as a common and timely proxy for hedge funds' basis trading volumes.7, 8 Figure 2 plots these data by contract tenor and suggests that basis trading activity grew substantially between mid-2022 and the end of 2023, reaching well over $1 trillion in notional exposure and surpassing the levels observed in the 2018-2020 period. While leveraged funds' short futures notional exposures increased in each contract, the increases were greatest in the 2- and 5-year tenors, as in the previous era of basis trade popularity. However, leveraged investors could be taking on short futures positions for a variety of reasons, including directional positioning or other relative value trades in addition to basis trades. Therefore, relying solely on the total short futures volumes may substantially overestimate basis trading activity.
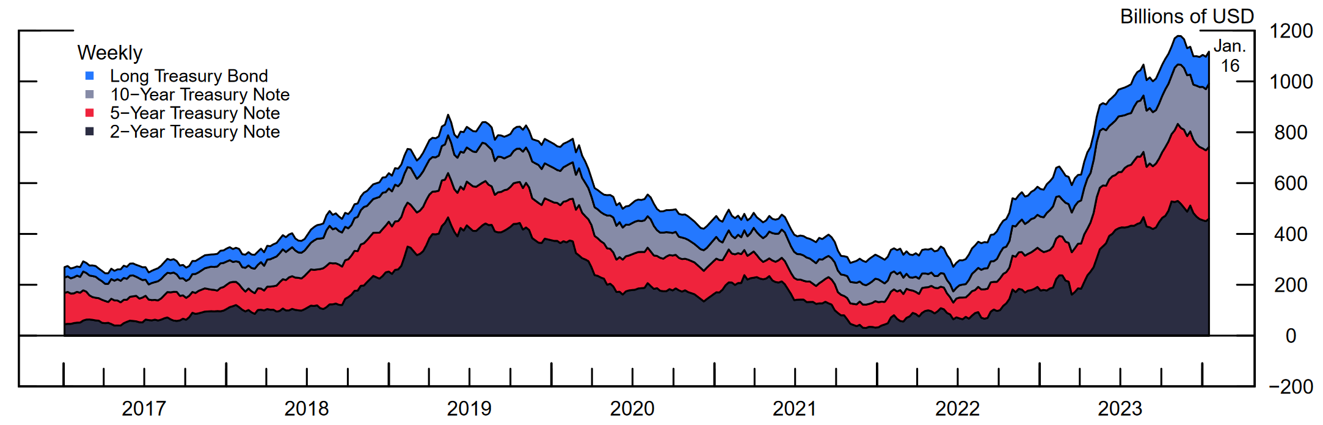
Note: Key identifies in order from top to bottom. '10-Year Treasury Note' refers to both 10-year and Ultra 10-year notes. 'Long Treasury Bond' refers to both Long and Ultra Long Treasury Bonds. Notional value calculated as the number of positions multiplied by the size of the futures contract - $200,000 for 2-Year Treasury Note, $100,000 for all other Treasuries. Leveraged funds include hedge funds, registered commodity trading advisers (CTAs), and commodity pool operators (CPOs).
Source: CFTC Traders in Financial Futures.
Two Proxies from Hedge Fund Regulatory Filings: Net Treasury Purchases and Repo
Hedge fund Treasury holdings are primarily driven by Treasury arbitrage strategies, which involve approximately equal long and short positions to exploit small price discrepancies between two Treasury securities or a Treasury security and a related derivative. Only the second type of trade, a cross-market arbitrage such as the basis trade, results in meaningful net changes in Treasury securities holdings by hedge funds. Hedge funds' net Treasury securities purchases can therefore serve as a proxy for the cash leg of the basis trade.
Form PF collects aggregate Treasury positions across cash and derivatives exposures. Using methods developed in Banegas, Monin and Petrasek (2021) for disaggregating reported Treasury exposures into cash securities holdings and derivatives exposures on a valuation-adjusted basis, we estimate that hedge funds, on net, purchased $428 billion in Treasury securities during the 2017-2019 round of quantitative tightening (see Figure 3).9 This accumulation of Treasury securities by hedge funds is similar in scale to the total reduction in the Federal Reserve's holdings of Treasury securities over the period.10 Moreover, 91 percent of hedge funds' purchases were made by funds classified as likely basis traders. This suggests that hedge funds, especially basis traders, absorbed significant amounts of Treasury securities during the last balance sheet run-off period. In addition, Banegas, Monin and Petrasek (2021) find that hedge funds on net sold approximately $173 billion in Treasury securities during the March 2020 Treasury market turmoil (See Figure 4), with the selling concentrated in funds that were identified as likely basis traders. Hedge funds' Treasury positions subsequently fell and remained relatively low until the latter half of 2022, when the profitability of the basis increased (See Figure 1) and net purchases of Treasury securities of basis trading hedge funds again grew in tandem (See Figure 3).11, 12 As of September 2023, we estimate that hedge funds had purchased, on net, $626 billion in Treasury securities since September 2017, with $478 billion by funds that were classified as likely basis traders between 2018 and 2020.
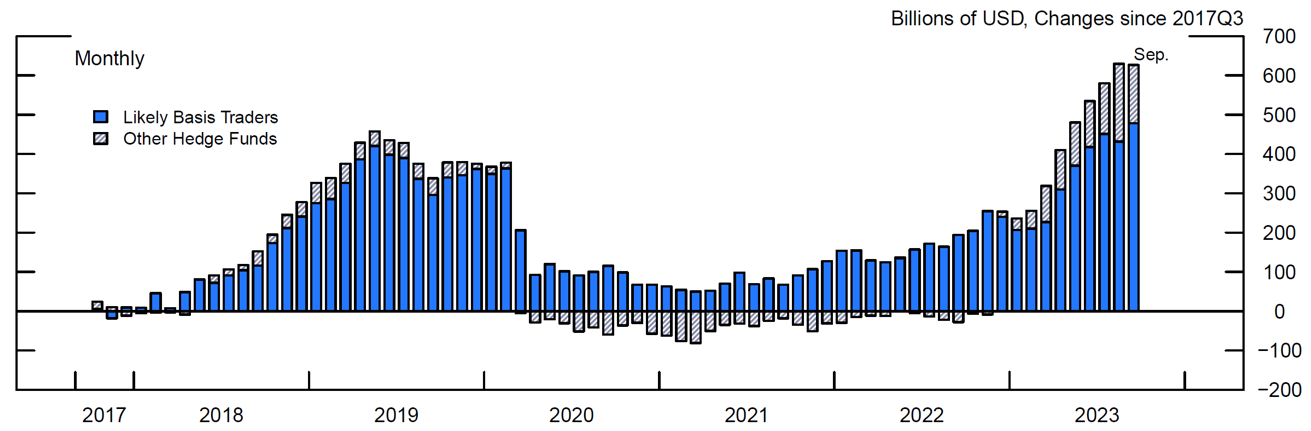
Note: Net cumulative Treasury purchases are cumulative monthly changes in valuation-adjusted Treasury holdings since September 2017. Values estimated from reported Treasury exposures of qualifying hedge funds on Form PF. Likely basis traders classified based on reported strategy and the co-movement of their long and short Treasury exposures with their net repo exposure between 2018 and 2020. See Banegas, Monin and Petrasek (2021).
Source: SEC Form PF, Haver Analytics, authors' calculations.
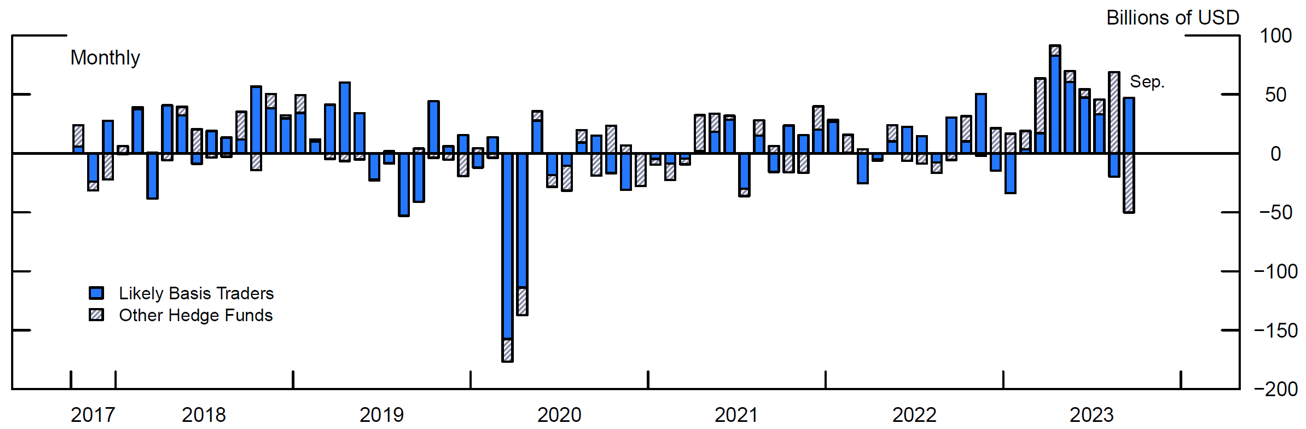
Note: Net Treasury purchases are monthly changes in valuation-adjusted Treasury holdings, estimated from reported Treasury exposures of qualifying hedge funds on Form PF. Likely basis traders classified based on reported strategy and the co-movement of their long and short Treasury exposures with their net repo exposure between 2018 and 2020. See Banegas, Monin and Petrasek (2021).
Source: SEC Form PF, Haver Analytics, authors' calculations.
Another proxy for hedge funds' basis trading is their net repo exposure. Hedge funds facilitate their fixed-income relative value trades through the bilateral repo market, borrowing cash to fund long positions and sourcing securities for short positions. Unlike other popular fixed-income arbitrage trades, such as the on-the-run / off-the-run trade, that require approximately equal positions in both repo and reverse repo, the Treasury cash-futures basis trade only requires repo to finance the long position in the Treasury security. Thus, hedge funds' net repo, defined as the difference between the outstanding volumes of repo and reverse repo, serves as a proxy for hedge funds' positions in the Treasury cash-futures basis trade.13
Figure 5 plots hedge funds' monthly net repo positions between January 2017 and September 2023. Between early 2018 and mid-2019, hedge funds' net repo grew to a peak of $598 billion, suggesting that the Treasury cash-futures basis trade grew by a similar amount during this period. The net repo proxy also suggests that the Treasury cash-futures basis trade became less popular during the period following March 2020 and extending to mid-2022, in line with the subdued level of the basis in that period. More recent data suggests that interest in the trade grew in the latter half of 2022, with the net repo proxy again increasing to $574 billion by September 2023. This is consistent with estimated net purchases of Treasury securities by hedge funds (see Figure 3).
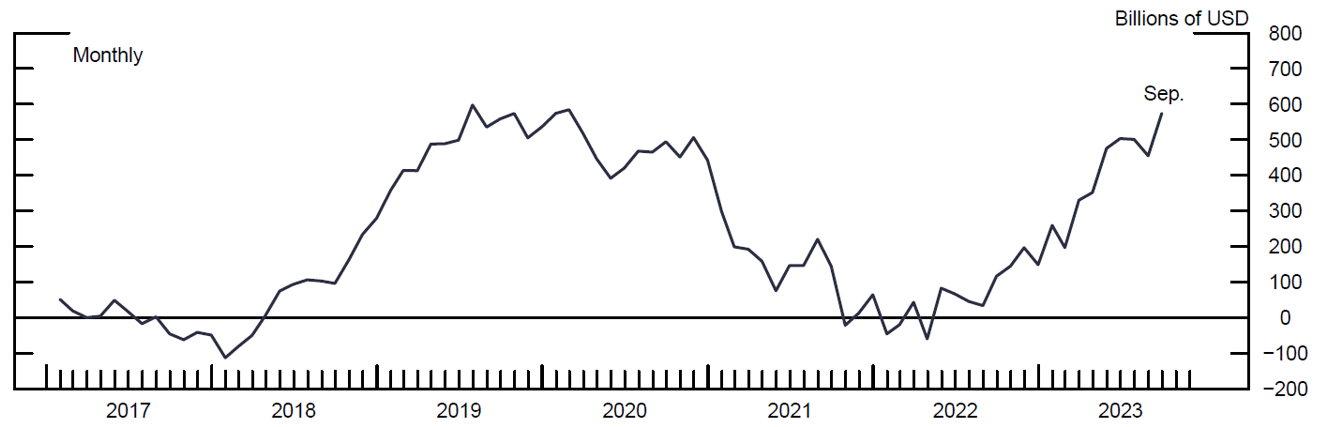
Note: Net repo is defined as the total repo positions minus reverse repo positions held by qualifying hedge funds that report on SEC Form PF.
Source: SEC Form PF.
A New Real-Time Proxy for Basis Trade Activity from the Cash Treasury Market
We use the regulatory Treasury TRACE dataset, collected by FINRA, to develop a new proxy for basis trade volumes based on Treasury cash market transactions. TRACE contains transaction-level data for all secondary market trades of Treasury securities conducted by FINRA-registered broker-dealers. The trade reports include a flag for whether a trade was conducted as part of a series of transactions that included a futures leg.14 Based on this flag, we identify trades that are likely to be basis trades and develop a "TRACE" proxy for basis trade volumes.
To identify likely basis trades, we consider transactions with non-dealer clients that have an associated futures leg. We focus on the client venue because it contains trades between dealers and counterparties that are not registered with FINRA, including most hedge funds. We then construct our TRACE proxy for basis trade positions by considering clients' net purchases of Treasury securities in transactions that have been executed with a futures leg and are for securities that are deliverable into active 2-, 3-, 5-, or 10- year futures contracts. As the underlying transaction data measure flows, we accumulate them to construct a level measure. To estimate the magnitude of this level we assume that it was zero on average in Q1 2022, which was a period that saw a trough in basis trading activity according to other available proxies.15 Thus, an increase in clients' Treasury purchases with a futures leg in excess of similar Treasury sales would result in an increase in the TRACE proxy. This proxy strongly identifies basis trade activity as it jointly considers both Treasury cash and futures positions.
Figure 6 shows that the TRACE basis proxy (the black line) is highly correlated with the net repo measure from Form PF (the red line) while being substantially timelier. As TRACE reports daily with a one-day lag, this proxy serves as the most up to date and highest frequency measure for Treasury cash-futures basis trading activity available. The proxy is correlated with our measure of the basis. It is also correlated with, though substantially lower than, contract-level leveraged fund short futures positions indicated by the CFTC Traders in Financial futures data. This suggests that the TRACE proxy is an effective and timely measure of Treasury cash-futures basis trading intensity.
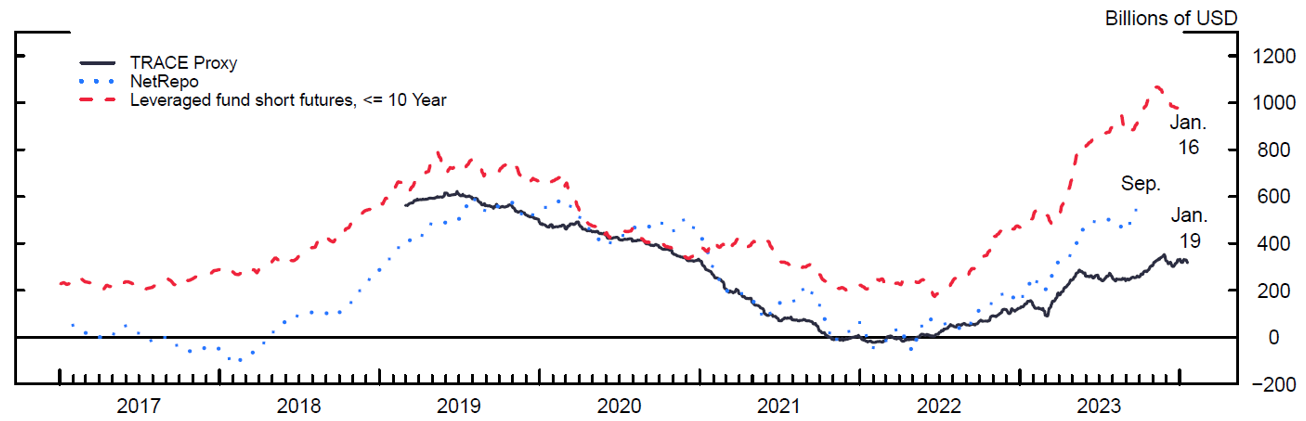
Note: Leveraged fund short futures includes futures positions in 2-, 5-, 10-, and ultra 10-year contracts.
Source: FINRA TRACE, SEC Form PF, CFTC Traders in Financial Futures, authors' calculations.
A Comparison of the Proxies
The measures discussed in this note use different methods to quantify the extent of the Treasury cash-futures basis trade, but each measure is imperfect and presents its own benefits and drawbacks. Table 1 provides a summary of the relative strengths and weaknesses of each measure.
Table 1: Comparison of Basis Proxies
| Proxy/Estimate | Timing | Strengths | Weaknesses | Biases |
|---|---|---|---|---|
|
CFTC short positions of leveraged funds in Treasury futures (<=10yr) $913B, Sep ‘23 $991B, Jan ‘24 |
Frequency: Weekly Lag: One Week |
Captures futures leg of the basis trade at the aggregate level for leveraged funds at each contract tenor. Data are comprehensive with respect to Treasury futures contracts. |
No information on other components of trades – cannot distinguish basis trades from other types of trades. Aggregated across all leveraged funds. |
Likely overestimates basis trade activity as it includes non-basis trading related futures activity. |
|
Form PF Net Treasury Purchases: $626B, Sep ‘23 Net repo: $574B, Sep ‘23 |
Frequency: Monthly Lag: > Quarter |
Captures both financing (net repo) and cash (Treasury holdings) legs of the basis trade. Treasury holdings and net repo are available at the fund level, and can be aggregated by fund type (e.g., likely basis trader). Net repo is as reported (i.e., is not estimated). Comprehensive coverage of hedge funds. |
Net repo mismeasures the basis trade insofar as hedge funds use unequal amounts of repo and reverse repo in their other trades. Net repo includes repo against non-Treasury securities such as non-US sovereigns and MBS. Treasury cash purchases are estimated. Data are monthly and are lagged significantly. |
Net repo is a biased estimate of the basis trade if hedge funds’ other trades use significant unequal amounts of repo and reverse repo. Example 1: if risk parity trades are popular, then net repo would overestimate basis trade activity. Example 2: if short non-US sovereign basis trades are popular, then net repo may underestimate the Treasury basis trade. |
|
TRACE $260B, Sep ‘23 $317B, Jan ‘24 |
Frequency: Daily Lag: One Day |
Captures cash market transactions with an offsetting futures leg; strong identification. Trade-level data on the basis trade. Nearly real time. Data are comprehensive with respect to cash market transactions. |
Clients are anonymized and cannot be conclusively identified as hedge funds. Requires that cash and futures legs are taken with the same dealer. Relies on both entry and exit legs being executed simultaneously with a futures leg. |
Likely underestimates basis trade activity as not all relevant trades may be reported, for example if a hedge fund executes the cash and futures legs with different dealers. |
By considering the presented measures in tandem while understanding the limitations of each, we approach a clearer understanding of the current extent of basis trading activity.
Recent Re-emergence of the Treasury Cash-Futures Basis Trade
The TRACE proxy indicates an increase in basis trading activity of approximately $317 billion since the first quarter of 2022, consistent with our estimates of the basis being positive on average over the period (see Figure 1). Though the TRACE proxy is highly correlated with leveraged funds' short Treasury futures positions in earlier periods, the increases in short futures positions were substantially larger than either the net repo proxy or the TRACE proxy over the course of 2023, suggesting that leveraged funds' selling of Treasury futures was driven by more than just the basis trade (see Figure 6).16 The TRACE proxy is also consistent with the Form PF measures available through Q2 2023, but deviated substantially in Q3 2023, again suggesting that these proxies may in part capture non-basis activity (see Figure 6).
Jointly, these indicators suggest that the Treasury cash-futures basis trade returned to prominence in 2023 while providing additional bounds on the extent of the trade. Leveraged fund futures positions alone likely overestimate basis trade volume. The net repo proxy may also overstate basis trading activity insofar as hedge funds use more repo than reverse repo in their other trades. While being conceptually the most direct measure of basis trading activity, the TRACE proxy may underestimate the extent of the basis trade if dealers are unable to identify all trades with an offsetting futures leg. Taking net repo as an upper bound and the TRACE proxy as a lower bound suggests that Treasury cash-futures basis trade volumes at the end of September 2023 were between $260 billion and $574 billion. By mid-January 2024, the timelier TRACE proxy suggests basis trade volumes of approximately $317 billion, somewhat lower than the estimated recent peak value of $352 billion seen in November 2023.
References
Banegas, Ayelen, Phillip J. Monin, and Lubomir Petrasek (2021). "Sizing hedge funds' Treasury market activities and holdings," FEDS Notes. Washington: Board of Governors of the Federal Reserve System, October 6, 2021, https://doi.org/10.17016/2380-7172.2979.
Barth, Daniel and R. Jay Kahn (2021). "Hedge Funds and the Treasury Cash-Futures Disconnect," OFR Brief Series 20-01. Washington: Office of Financial Research, April 1, 2021, https://www.financialresearch.gov/working-papers/files/OFRwp-21-01-hedge-funds-and-the-treasury-cash-futures-disconnect.pdf
Barth, Daniel, R. Jay Kahn, and Robert Mann (2023). "Recent Developments in Hedge Funds' Treasury Futures and Repo Positions: is the Basis Trade "Back"?," FEDS Notes. Washington: Board of Governors of the Federal Reserve System, August 30, 2023, https://doi.org/10.17016/2380-7172.3355.
Hempel, Samuel, R. Jay Kahn, Robert Mann, and Mark Paddrik, "Why is So Much Repo Not Centrally Cleared?" OFR Brief Series No. 23-01, May 12, 2023
Kruttli, Mathias S., Phillip J. Monin, Lubomir Petrasek, and Sumudu W. Watugala (2023). "LTCM Redux? Hedge Fund Treasury Trading and Funding Fragility." March 31, 2023. Available at SSRN: https://ssrn.com/abstract=3817978 or http://dx.doi.org/10.2139/ssrn.3817978 ).
1. We thank Sebastian Infante Bilbao and Dan Li for their comments and suggestions. Return to text
2. The basis trade is subject to margin risk and rollover risk. In stress periods, its high use of leverage makes it vulnerable to rapid and large unwinds, either because of these risks or because of other factors, such as internal risk limit breaches. See Banegas, Monin, and Petrasek (2021), Barth and Kahn (2021), Kruttli, Monin, Petrasek and Watugala (2021). Return to text
3. See, for example, Barth, Kahn, and Mann (2023). Return to text
4. The first quarter of 2022 represented a low point for basis activity across available proxies, as described in later sections. Return to text
5. Treasury futures contracts are physically settled by the seller delivering an eligible Treasury bond. The cheapest eligible bond is called the cheapest-to-deliver (CTD). There are multiple options built into the short Treasury futures position relating to timing and quality of delivery. Our basis measure includes valuations for two of them, the carry and CTD options. These options allow the seller to decide when to deliver during the delivery period and which bond from the basket of eligible bonds to deliver, respectively. We do not adjust for the value of other delivery options, such as the wild card option or the end-of-month option. Return to text
6. A negative basis suggests that the futures contract is relatively less expensive than the cash security, so that an arbitrageur may expect to profit from a trade that is long a Treasury futures contract and short a Treasury security (referred to as the "short basis trade"). A hedge fund putting on a short basis trade would likely source the Treasury note to short in a reverse repo transaction. The reverse repo rate that the hedge fund would earn is likely lower than the repo rate we use in our calculation of the basis. See Hempel, Kahn, Mann, and Paddrik (2023) for aggregate statistics on repo and reverse repo rates as of June 2022 in the non-centrally cleared bilateral repo market. Return to text
7. See the CFTC Commitments of Traders – Traders in Financial Futures Reports: https://www.cftc.gov/MarketReports/CommitmentsofTraders/index.htm Return to text
8. See, among others, Banegas, Monin, and Petrasek (2021), Barth and Kahn (2021) and Barth, Kahn, and Mann (2023). Return to text
9. See Banegas, Monin, and Petrasek (2021). Between October 2017 and July 2019, we estimate that likely basis traders purchased, on net, $390 billion of Treasury securities and that other funds purchased on net $38 billion. Return to text
10. According to the H.4.1 data, the Federal Reserve's holdings of Treasury securities decreased by $385 billion between October 4, 2017, and August 1, 2019. Return to text
11. Likely Basis Traders in figures 3 and 4 comprise the set of funds classified as likely basis traders during the period between 2018 and 2020, based on methods using granular data on asset class positions in Form PF filings (see Banegas, Monin, and Petrasek (2021) and Kruttli, Monin, Petrasek, and Watugala (2023)). Return to text
12. According to the H.4.1 data, the Federal Reserve's holdings of Treasury securities decreased by $980 billion between June 1, 2022, and December 27, 2023. Return to text
13. Repo and reverse repo positions are aggregated across collateral asset classes on Form PF. Net repo may mismeasure the volume of Treasury cash-futures basis trading for funds with other trades that use unequal amounts of repo and reverse repo, such as risk parity trades or basis trades in non-U.S. sovereign bond markets. Return to text
14. Cash transactions with associated futures legs may only be identified as such if both legs of the position are taken with the same dealer. Though clients are incentivized to hold these positions jointly at the same dealer due to the availability of portfolio netting or cross-margining, this suggests that the TRACE proxy may underestimate basis trading activity. Return to text
15. This period represents a local minimum in leveraged fund short notional exposures to Treasury futures, a time at which the net repo proxy was low and near zero, the basis was near zero, and a low point in recent basis trading activity based on TRACE. This assumption allows us to compare the TRACE proxy with other series but may mean that the TRACE proxy underestimates (long) basis trade volumes, as it assumes that no basis trading activity was occurring in Q1 2022. Return to text
16. For example, macro funds and Commodity Trading Advisers may have increased their bets on interest rates increasing, or other leveraged funds may be selling Treasury futures to offset the interest rate exposures in their portfolios. Return to text
Glicoes, Jonathan, Benjamin Iorio, Phillip Monin, and Lubomir Petrasek (2024). "Quantifying Treasury Cash-Futures Basis Trades," FEDS Notes. Washington: Board of Governors of the Federal Reserve System, March, 08, 2024, https://doi.org/10.17016/2380-7172.3458.
Disclaimer: FEDS Notes are articles in which Board staff offer their own views and present analysis on a range of topics in economics and finance. These articles are shorter and less technically oriented than FEDS Working Papers and IFDP papers.