FEDS Notes
February 12, 2025
Repo Rate Sensitivity to Treasury Issuance and Quantitative Tightening
Lucy Cordes and Sebastian Infante1
1. Introduction
Over the past six months, Treasury repo rates have risen, on average, relative to the rate on the overnight reverse repurchase agreement (ON RRP) facility and have become more volatile. Recent literature has argued that these trends have been driven, in part, by the cumulative effects of quantitative tightening (QT).2 Specifically, during QT the Fed reduces its security holdings, which increases the amount of Treasury securities held by private investors. The reduction in securities holdings also results in a reduction in Federal Reserve (Fed) liabilities, which decreases the amount of Fed-provided liquidity. Both of these effects put upward pressure on repo rates. In this note, we study the sensitivity of repo rates to changes in Treasury securities outstanding—a proxy for net Treasury issuance—over time and how the sensitivity changes with Fed-provided liquidity. We find that over the 2017–19 QT period, the sensitivity of repo rates to issuance generally increased as the Fed's balance sheet shrunk in size and continued to be high amid low levels of aggregate liquidity, which persisted until March 2020. During the current QT period, this sensitivity has mostly been small and statistically insignificant; however, it has been increasing over the past six months. Even so, the recent increase in sensitivity remains far below the sensitivity estimates for the prior QT period, suggesting that liquidity remains abundant. We interpret these findings as evidence that QT contributes to the relative tightness of supply and demand conditions in the repo market, making rates more sensitive to changes in Treasury supply. Looking ahead, as QT continues, we expect the sensitivity of repo rates to Treasury issuance to increase.
2. Mechanism and Empirical Strategy
Treasury issuance can put upward pressure on Treasury repo rates through two channels, depending on the type of Treasury security issued. On days with Treasury coupon auctions, primary dealers must absorb a portion of the issuance and redistribute the securities to customers, which increases overall demand for repo borrowing against Treasury collateral.3 Shorter-dated Treasury bills, on the other hand, are close substitutes for other short-term money market investments and tend to be purchased by money market mutual funds (MMFs), drawing away funds that might otherwise have been lent in the repo market. Although the two types of Treasury issuance can work through different channels, both will tend to put upward pressure on repo rates. The size of these effects depends on the tightness of supply and demand conditions in the repo market: They are smaller when investors have more funds available to lend in the repo market relative to the demand for repo financing and larger when relatively less funds are available.
To capture the sensitivity of repo rates to the issuance of both of Treasury coupons and Treasury bills over time, in our main specification we estimate the following empirical model:
$$$$ \Delta\left(TGCR-ON\ RRP\right)_t = \alpha_{ym}+{\beta_1}^{yq}\Delta ln\left(Coupons\right)_t1_{yq}+{\beta_2}^{yq}\Delta ln\left(Bills\right)_t1_{yq} + $$$$
$$$$ \eta_1 \Delta\left(TGCR-ON\ RRP\right)_{t-1}+ \eta_2 \Delta\left(TGCR-ON\ RRP\right)_{t-2}+ \gamma X_t+\epsilon_t\ (1) $$$$
where $$\Delta\left(TGCR-ON\ RRP\right)_t$$ is the daily change in the spread between the overnight tri-party Treasury repo rate and the ON RRP offering rate, $$\Delta ln\left(Coupons\right)_t$$ is the daily log change of total amount outstanding of Treasury coupon securities, and $$\Delta ln\left(Bills\right)_t $$ is the daily log change of total amount outstanding of Treasury bills, both proxies for net Treasury issuance.4,5 Equation (1) interacts the effects of Treasury coupon and bill issuance with an indicator variable $$1_{yq}$$, which equals 1 for each year-quarter, and zero otherwise.6 This empirical strategy allows us to capture the average effect over each quarter and observe how it changes over time. The empirical model also includes month-year fixed effects $$\alpha_{ym}$$ and controls for two lagged changes in the repo spread. In fuller specifications we also include other controls that capture the securities holdings and liabilities on the Fed's balance sheet such as Treasury securities held in the System Open Market Account (SOMA), reserves plus ON RRP take-up, and the Treasury General Account (TGA), all from Factors Affecting Reserve Balances.7, 8
3. Results
Figure 1 displays the point estimates of the average sensitivity of repo spreads to issuance over each quarter since 2016, along with 95th percentile confidence intervals estimated via equation (1). The top panels show the rate sensitivity to changes in Treasury coupon securities ($$ {\beta_1}^{yq} $$), and the bottom panels show the sensitivity to changes in Treasury bills ($$ {\beta_2}^{yq} $$); the panels on the right display the sensitivity since 2023 on a different scale. The figure provides the estimated coefficients and 95th percentile confidence intervals of three specifications that differ in their controls. The first does not include any controls ("no controls"); the second controls for lagged log levels of weekly averages of Treasury securities held in SOMA, reserves plus ON RRP take-up, and the TGA, which are publicly available ("public controls"); and the third controls for daily lagged log level of these variables, along with their contemporaneous daily log changes, which are not publicly available ("nonpublic controls"). As a reference, the figure also shows the previous and current QT episodes (shaded yellow area) and the aggregate level of reserves plus ON RRP relative to GDP (dotted black line).
Figure 1. Estimated Sensitivity of Changes in (TGCR-ON RRP) to Changes in Treasury Securities Outstanding Over Time
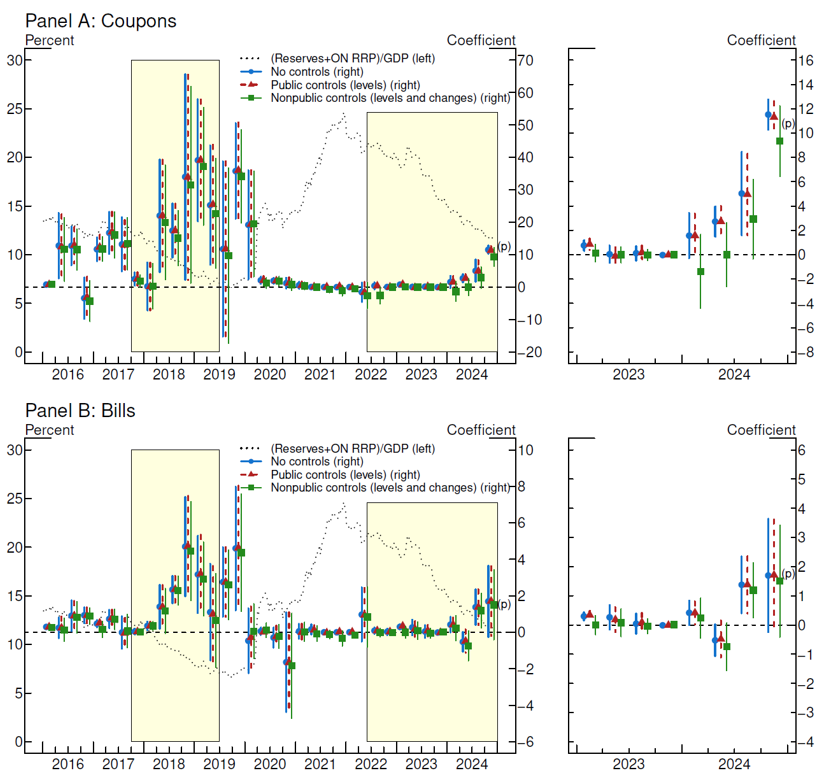
Note: Point estimates and 95% confidence intervals are plotted. Estimated over January 1, 2016 - November 30, 2024. September 16, 2019 - September 30, 2019 is dropped. (p) Preliminary. Includes month fixed effects and Newey-West standard errors with 20 lags. Public controls are lagged weekly average levels of ON RRP take-up plus reserves, Treasury securities held in SOMA, and TGA; nonpublic controls are daily contemporaneous changes and lagged levels of ON RRP take-up plus reserves, SOMA Treasury securities, and TGA. All control variables are logged. QT periods are shaded in yellow.
Source: Federal Reserve Board, H.4.1; Federal Reserve Bank of New York; Treasury Department.
All three specifications show very similar patterns. Both the top and bottom panels show that the sensitivity of repo rates to issuance increased notably over the 2018–19 period. While the increase was not monotonic, higher point estimates indicate that the sensitivity was generally growing over this period. Looking at the more recent period, our estimated sensitivities have begun to increase over the past year and only turned statistically significantly positive in the most recent quarters. To put the most recent estimates into perspective, they suggest that a $100 billion increase in Treasury coupon issuance resulted in approximately a 5-6 basis point increase in the $$\left(TGCR-ON\ RRP\right)$$ spread. These estimates are still much lower than levels observed at the end of the last QT episode.
3.1 The Effects of Dealer Balance Sheet Costs on Rate Sensitivity to Treasury Issuance—Controlling for Quarter-End Effects
An alternative interpretation of Figure 1 may be that dealer balance sheet costs change over time and thus may be driving the patterns we observe on the sensitivity of repo rates to Treasury issuance. Intuitively, if dealers face increasing balance sheet constraints, we would expect the sensitivity of repo rates to issuance to increase as a result. Previous literature has documented that balance sheet constraints are higher on quarter-end dates as dealers and other financial institutions "window dress" their portfolios to minimize the effects of a variety of regulatory or accounting rules which, in turn, leaves an imprint in repo rates and trading volumes.9 Therefore, if dealer balance sheet constraints are driving our results, we would expect the estimates excluding quarter-end dates to be significantly lower. Figure 2 displays point estimates and confidence intervals of the "no controls" model that is estimated using the full sample ("includes quarter-ends") and using data that excludes each quarter-end and the two days around it ("excludes quarter-ends"). We find that the general pattern of how sensitivities change is very similar, suggesting that changes in balance sheet constraints are not driving the patterns we observe on the sensitivity of repo rates to Treasury issuance.10
Figure 2. Estimated Sensitivity of Changes in (TGCR-ON RRP) to Changes in Treasury Securities Outstanding Over Time, with and without Quarter-Ends
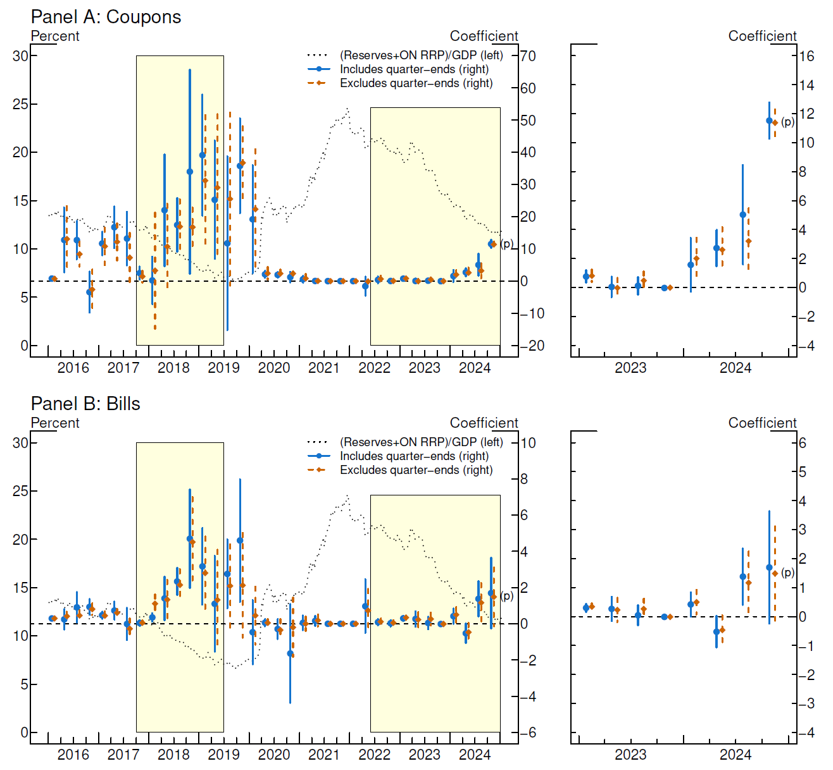
Note: Point estimates and 95% confidence intervals are plotted. Estimated over January 1, 2016 - November 30, 2024. September 16, 2019 - September 30, 2019 is dropped. (p) Preliminary. Includes month fixed effects and Newey-West standard errors with 20 lags. Controls for daily contemporaneous changes of log levels and lagged log levels of ON RRP take-up plus reserves, Treasury securities held in SOMA, and TGA. Specification without quarter-ends excludes quarter-ends +/- 2 days. QT periods are shaded in yellow.
Source: Federal Reserve Board, H.4.1; Federal Reserve Bank of New York; Treasury Department.
3.2 Measuring the Effects of Fed-Provided Liabilities Directly
So far, we have shown that the sensitivity of repo rates to Treasury coupon and bill issuance changes over time, and we have observed that they tend to increase over QT episodes and are inversely proportional to the amount of Fed-provided liquidity measured through reserves plus ON RRP take-up over GDP. In this section, we directly estimate how these sensitivities change with the measures of Fed-provided liquidity. Specifically, instead of interacting $$\Delta ln(Coupons)_t$$ and $$\Delta ln(Bills)_t$$ with year-quarter indicator variables, we directly interact our Treasury issuance variables with different measures of Fed-provided liquidity: lagged weekly average reserves, ON RRP take-up, and the sum of the two (labeled by subscript $$w(t) – 1$$), all as a fraction of GDP. By interacting our Treasury issuance variables with lagged average levels of reserves and ON RRP take-up, the sum of which is largely driven by Fed balance sheet policy that is fairly stable, we reduce endogeneity concerns between contemporaneous changes in daily rates with the level of reserves and ON RRP take-up. We consider the effects of reserves and ON RRP take-up separately to see whether there are differential effects depending on the type of Fed-provided liquidity in the market. For example, because the ON RRP is a facility that operates in the tri-party markets directly, we may expect that most of the changes in sensitivity come from changes in ON RRP take up.
Table 1 shows the results using the specification without controls, interacting issuance with different measures of Fed-provided liquidity.11 Columns 1 through 3 indicate that the level of reserves and ON RRP take-up each put downward pressure on the sensitivity of repo rates to Treasury coupon issuance. Column 3 indicates that higher levels of reserves and ON RRP have larger muting effects on this sensitivity when placed jointly relative to the stand-alone interaction terms in columns 1 and 2. This suggests that both sources of Fed-provided liquidity—reserves and ON RRP—contribute to the relative tightness of supply and demand conditions in the repo market that stem from Treasury coupon issuance. Column 4 adds both reserves and ON RRP take up, indicating a large and negative effect on the sensitivity of repo rates to Treasury coupon issuance. Interestingly, we find that the effects of Treasury bill issuance are not as strong, suggestive that the amount of Fed-provided liquidity has a more meaningful effect on repo rate sensitivity to Treasury coupons issuance.
Table 1: Estimated Sensitivity of Changes in (TGCR-ON RRP) to Changes in Treasury Securities Outstanding Interacted with Fed-Provided Liquidity
| $$\Delta (TGCR-ON RRP)_t$$ | ||||
|---|---|---|---|---|
| (1) | (2) | (3) | (4) | |
| $$\Delta ln(Coupons)_t$$ | 17.78*** | 4.085*** | 25.04*** | 17.52*** |
| (3.57) | (3.75) | (4.10) | (4.15) | |
| $$\Delta ln(Bills)_t$$ | 3.271*** | 0.479** | 3.131*** | 1.788*** |
| (3.68) | (2.56) | (3.60) | (2.81) | |
| $$Reserves_{w(t)-1}/GDP$$ | -0.0454 | -0.164 | ||
| (-0.24) | (-0.74) | |||
| $$\Delta ln(Coupons)_t \times Reserves_{w(t)-1}/GDP$$ | -133.1*** | -163.1*** | ||
| (-3.48) | (-3.91) | |||
| $$\Delta ln(Bills)_t \times Reserves_{w(t)-1}/GDP$$ | -23.36*** | -23.02*** | ||
| (-3.64) | (-3.67) | |||
| $$ONRRPtakeup_{w(t)-1}/GDP$$ | -0.297** | -0.311 | ||
| (-2.05) | (-1.49) | |||
| $$\Delta ln(Coupons)_t \times ONRRPtakeup_{w(t)-1}/GDP$$ | -60.50*** | -77.03*** | ||
| (-3.74) | (-4.52) | |||
| $$\Delta ln(Bills)_t \times ONRRPtakeup_{w(t)-1}/GDP$$ | -7.124** | -1.444 | ||
| (-2.11) | (-0.38) | |||
| $$(Reserves+ONRRPtakeup)_{w(t)-1}/GDP$$ | -0.249 | |||
| (-1.22) | ||||
| $$\Delta ln(Coupons)_t \times (Reserves+ONRRPtakeup)_{w(t)-1}/GDP$$ | -96.84*** | |||
| (-4.12) | ||||
| $$\Delta ln(Bills)_t \times (Reserves+ONRRPtakeup)_{w(t)-1}/GDP$$ | -10.60*** | |||
| (-2.90) | ||||
| Year-Month FEs | Y | Y | Y | Y |
| Public Controls | N | N | N | N |
| Observations | 2183 | 2183 | 2183 | 2183 |
| Adjusted $$R^2$$ | 0.11 | 0.09 | 0.13 | 0.12 |
Notes: $$ t $$ statistics in parentheses
* p<0.10, ** p<0.05, *** p<0.01. Newey-West standard errors with 20 lags. Estimated over January 1, 2016 - November 30, 2024. September 16, 2019 - September 30, 2019 is dropped.
4. Concluding Remarks
In this note we provide evidence that the cumulative effects of QT tend to increase the sensitivity of repo rates to Treasury issuance. We do so by measuring the average sensitivity of changes in the tri-party repo spread to ON RRP to changes in Treasury coupons and bills outstanding. We find that as the Fed reduces the size of its balance sheet, these sensitivities tend to be progressively larger, which can be driven by the reduction in Fed-provided liquidity, the increase in securities held by investors, or both. We also provide evidence that the change in repo rate sensitivity is not driven by changes in balance sheet costs by showing that these sensitivities are largely the same when we exclude quarter-end dates. Finally, we hone in on the channel of Fed-provided liquidity directly and show that higher levels of both reserves and ON RRP, separately, mute the effects of issuance on repo rates. We view these results as indicative that QT contributes to the relative tightness of supply and demand conditions in the repo market, and thus places greater upward pressure on rates on Treasury issuance dates. The relatively low sensitivity we observe in the most recent quarters suggests that liquidity continues to remain loose, but there are signs of some increased tightening.
Stata code and public data files (ZIP)
References
Afonso, Gara, Kevin Clark, Brian Gowen, Gabriele La Spada, JC Martinez, Jason Miu and Will Riordan (2024), "A New Set of Indicators for Reserve Ampleness", Federal Reserve Bank of New York Liberty Street Economics, August 14, 2024.
Clouse, James A., Sebastian Infante, and Zeynep Senyuz (2025). "Market-Based Indicators on the Road to Ample Reserves," FEDS Notes. Washington: Board of Governors of the Federal Reserve System, January 31, 2025.
Favara, Giovanni, Sebastian Infante, and Marcelo Rezende (2024), "Leverage Regulations and Treasury Market Participation: Evidence from Credit Line Drawdowns," Working paper.
Munyan, Benjamin (2017), "Regulatory Arbitrage in Repo Markets", Office of Financial Research Working Paper 15-22.
1. We thank Roc Armenter, David Bowman, James Clouse, Rochelle Edge, Richard Finlay, Joshua Gallin, Christopher Gust, Erik Heitfield, Roberto Perli, and Zeynep Senyuz. The views expressed in this paper are solely the responsibility of the authors and should not be interpreted as reflecting the views of the Federal Reserve Board or other members of its staff. All remaining errors are our own. Return to text
2. Afonso et al. (2024) argue that the share of overnight Treasury repo rates at or above the interest rate on reserve balances is an indicator of reserve scarcity, and Clouse et al. (2024) also point to increased repo rates and repo rate volatility as an indication that reserves may be becoming less ample. Return to text
3. Primary dealers are trading counterparties of the New York Fed in its implementation of monetary policy and are expected bid on a pro-rata basis in all Treasury auctions at reasonably competitive prices. See https://www.newyorkfed.org/markets/primarydealers for more information. Return to text
4. The effects of Treasury issuance are particularly salient in the tri-party repo market, where primary dealers borrow from money market mutual funds (MMFs) via repo, often using Treasury securities as collateral, making the TGCR the relevant repo rate to capture the main tradeoffs discussed in this Note. Return to text
5. Alternative specifications that directly measure changes in Treasury securities outstanding that exclude SOMA holdings give qualitatively similar results, suggesting that changes in Treasury securities outstanding is a good proxy for changes in Treasury securities held by investors. Return to text
6. For each specification, the year-quarter indicator variables span the entire sample period, simplifying the interpretation of the coefficient as the total average effect in each year-quarter. Return to text
7. We use Newey-West errors with 20 lags to control for any possible serial correlation. Return to text
8. Stata code and public data for replication of main results is linked at the end of this Note. Return to text
9. Munyan (2017) documents that financial institutions with low capital ratios appear to temporarily withdraw from the tri-party repo market before each quarter-end in order to appear safer and less levered. Return to text
10. In addition, Favara, Infante, and Rezende (2024) show that because reserves and Treasury holdings were excluded from the calculation of the supplementary leverage ratio between April 2020 and March 2021, balance sheet constraints related to repo became less binding. This suggests that if balance sheet constraints are driving the sensitivity of repo rates to issuance, then we would expect this sensitivity to change notably before 2020 and after March 2021. The evidence in Figures 1 and 2 suggest this is not the case. Return to text
11. Estimation of the specifications with both public and non-public controls gives qualitatively similar results. Return to text
Cordes, Lucy, and Sebastian Infante (2025). "Repo Rate Sensitivity to Treasury Issuance and Quantitative Tightening ," FEDS Notes. Washington: Board of Governors of the Federal Reserve System, February 12, 2025, https://doi.org/10.17016/2380-7172.3707.
Disclaimer: FEDS Notes are articles in which Board staff offer their own views and present analysis on a range of topics in economics and finance. These articles are shorter and less technically oriented than FEDS Working Papers and IFDP papers.