FEDS Notes
May 31, 2024
Rural Employment Disparities by Race, Ethnicity, and Region
An earlier FEDS Note explored long-term economic shifts taking place in the United States economy and their potential relationship to disparate employment rates in rural communities relative to their urban peers.1 Specifically, the employment-to-population rates for prime working age men and those with less than a high school degree in nonmetro areas was disproportionately lower than the rates for their peers in metro areas. These employment rates were especially low in majority-minority and persistent poverty counties.
Given the long history of disparities in employment rates between White workers and workers of other racial and ethnic groups, a natural next question is "what do these metro-nonmetro employment trends look like by race or ethnicity?" In addition, we know from other research that access to economic opportunity is not consistent across regions for people of all races or ethnicities.2 We also know that each region of the country has its own industrial composition and, as a result, a different level of exposure to the economic shifts that were explored in the first FEDS Note.3
The analysis below explores potential racial and regional differences in metro-nonmetro employment disparities by looking at employment rates by age, sex, race and ethnicity, and region.4 It finds substantial differences in the metro-nonmetro employment gap across racial and ethnic groups, with Black or African American and American Indian and Alaska Native men and women having much lower employment rates in nonmetro areas relative to their metro peers. It also finds significant regional differences in the metro-nonmetro employment gap across racial and ethnic groups.
Identifying these different patterns in metro-nonmetro employment disparities across race, ethnicity, and region is important to understanding where there continue to be opportunities to bring more workers into the economy, thus adding to overall economic growth and to improved economic well-being for those workers. This analysis aims to help inform the efforts of local organizations across the country working to narrow these employment gaps.
Rural employment disparities are especially large for those identifying as Black or African American or American Indian and Alaska Native
As shown below in Table 1, metro-nonmetro employment disparities differ substantially by race and ethnicity for workers aged 16 to 64 years old. For all racial and ethnic groups, nonmetro employment rates are lower than metro rates. However, these disparities are particularly acute for some racial groups. For example, while the metro-nonmetro difference in employment rates for Asian American men is just 5.7 percentage points, the difference for Black or African American men and American Indian or Alaska Native men are 18.1 and 15.4 percentage points, respectively. Across most races, the metro-nonmetro disparities for women are substantially lower than they are for men, with the exception of Native Hawaiians or other Pacific Islanders.
Table 1. Employment-to-population rate by sex and race/ethnicity, 16- to 64-years old, 2021
| Race / ethnicity | Male | Female | ||||||
|---|---|---|---|---|---|---|---|---|
| (n=1,251) | (n=1,970) | (n=1,251) | (n=1,970) | |||||
| Metro | Nonmetro | Diff. | Stat. Sign. | Metro | Nonmetro | Diff. | Stat. Sign. | |
| White alone | 77.3 | 71.2 | 6.1 | *** | 68.6 | 64.6 | 4.0 | *** |
| Black or African American alone | 64.1 | 46.0 | 18.1 | *** | 67.0 | 57.5 | 9.5 | *** |
| American Indian and Alaska Native alone | 66.7 | 51.3 | 15.4 | *** | 59.8 | 52.6 | 7.2 | *** |
| Asian Alone | 77.8 | 72.2 | 5.7 | *** | 65.6 | 62.7 | 2.9 | *** |
| Native Hawaiian and Other Pacific Islander alone | 71.8 | 68.1 | 3.7 | 64.8 | 59.5 | 5.2 | ||
| Some Other Race alone | 75.3 | 70.6 | 4.7 | *** | 59.7 | 57.3 | 2.4 | *** |
| Two or More Races | 72.1 | 63.0 | 9.1 | *** | 63.4 | 59.0 | 4.4 | *** |
| Hispanic or Latino | 74.9 | 68.1 | 6.7 | *** | 61.2 | 58.5 | 2.7 | *** |
| Total, 16 to 64 years | 75.0 | 68.2 | 6.9 | *** | 67.2 | 63.3 | 3.9 | *** |
Note: *** = significant at the 99% level
Source: U.S. Census Bureau, American Community Survey, 5-year Estimates, 2017-2021
The industrial and racial composition of communities differs substantially across regions
Table 1 above points to significant differences in the metro-nonmetro employment disparity across racial or ethnic groups. However, we also know that the industrial structure of the economy differs across regions of the country, as well as across the rural-urban continuum within regions, which may help to explain some of these differences.
Table 2 provides a national breakdown of the industrial structure of the metro and nonmetro economies. It shows that nonmetro counties have a much higher share of total employment in farming and related industries, manufacturing, and state and local government. While still a small share of total employment, nonmetro counties also have more than four times the share of employment in mining than metro counties.
Table 2. Share of total employment by industry, 2021
| Industry | Metro | Nonmetro |
|---|---|---|
| Farming; forestry, fishing, and related activities | 1.1 | 7.0 |
| Mining, quarrying, oil and gas extraction | 0.3 | 1.4 |
| Construction | 5.7 | 6.3 |
| Manufacturing | 6.0 | 10.6 |
| Wholesale trade | 3.2 | 2.5 |
| Retail trade | 9.3 | 10.8 |
| Transportation & warehousing | 5.4 | 3.7 |
| Finance and insurance; real estate, rental and leasing | 11.3 | 7.4 |
| Professional, scientific, technical services | 7.9 | 3.5 |
| Health care and social assistance | 11.6 | 9.8 |
| Accommodation and food services | 6.7 | 7.1 |
| Other private nonfarm (utilities; info.; admin.; arts; other) | 20.0 | 14.7 |
| Federal government (civilian and military) | 2.5 | 2.0 |
| State and local government | 9.1 | 13.1 |
Source: U.S. Bureau of Economic Analysis
Table 3 and Figure 1 show variations by Census regions in the dependence of metro and nonmetro counties on certain key industries. Industry dependence is based on the County Typology Codes produced by the Economic Research Service in the U.S. Department of Agriculture. The USDA ERS assigns industry dependence codes using labor and proprietor earnings and employment by place of work. Counties are considered dependent on an industry if their values for the underlying measures are roughly one standard deviation above the mean for those industry-specific measures. Counties that do not meet the dependence thresholds for any industry are considered "Not specialized."5
Table 3. Industry dependence by Census region and metro-nonmetro status, 2015
| Industry Dependence | Northeast | Midwest | South | West | ||||
|---|---|---|---|---|---|---|---|---|
| Metro | Nonmetro | Metro | Nonmetro | Metro | Nonmetro | Metro | Nonmetro | |
| (n=131) | (n=86) | (n=304) | (n=751) | (n=603) | (n=819) | (n=142) | (n=307) | |
| Farming-dependent | 0% | 0% | 8% | 33% | 3% | 12% | 5% | 17% |
| Mining-dependent | 1% | 5% | 1% | 4% | 5% | 12% | 3% | 14% |
| Manufacturing-dependent | 4% | 14% | 19% | 23% | 14% | 20% | 5% | 2% |
| Federal / State Gov't-dependent | 11% | 19% | 12% | 6% | 16% | 14% | 18% | 19% |
| Recreation-dependent | 13% | 35% | 3% | 9% | 8% | 6% | 19% | 25% |
| Not specialized | 72% | 28% | 58% | 25% | 54% | 36% | 50% | 22% |
Source: U.S. Department of Agriculture
Table 3 shows how nonmetro counties have much higher rates of industry dependence, regardless of region. It also shows how the industry that nonmetro counties are dependent on differs by Census region. For example, a much larger share of nonmetro counties in the Midwest are dependent on farming than in other regions, whereby a much larger share of nonmetro counties in the Northeast are dependent on recreation than in other regions. A disproportionately large share of nonmetro counties in the Midwest and South are manufacturing dependent relative to the Northeast and West. Lastly, the South and West have a large share of nonmetro counties that are dependent on the mining industry relative to the Northeast and Midwest.
Figure 1 shows how the counties dependent on certain industries tend to cluster even within these broad regions, particularly in nonmetro areas. Manufacturing-dependent communities in nonmetro areas of the South tend to be next to other manufacturing-dependent communities. Nonmetro mining-dependent communities in the West and South tend to be next to other mining-dependent communities. Nonmetro recreation-dependent communities in the Midwest and Northeast tend to be next to other recreation-dependent communities.
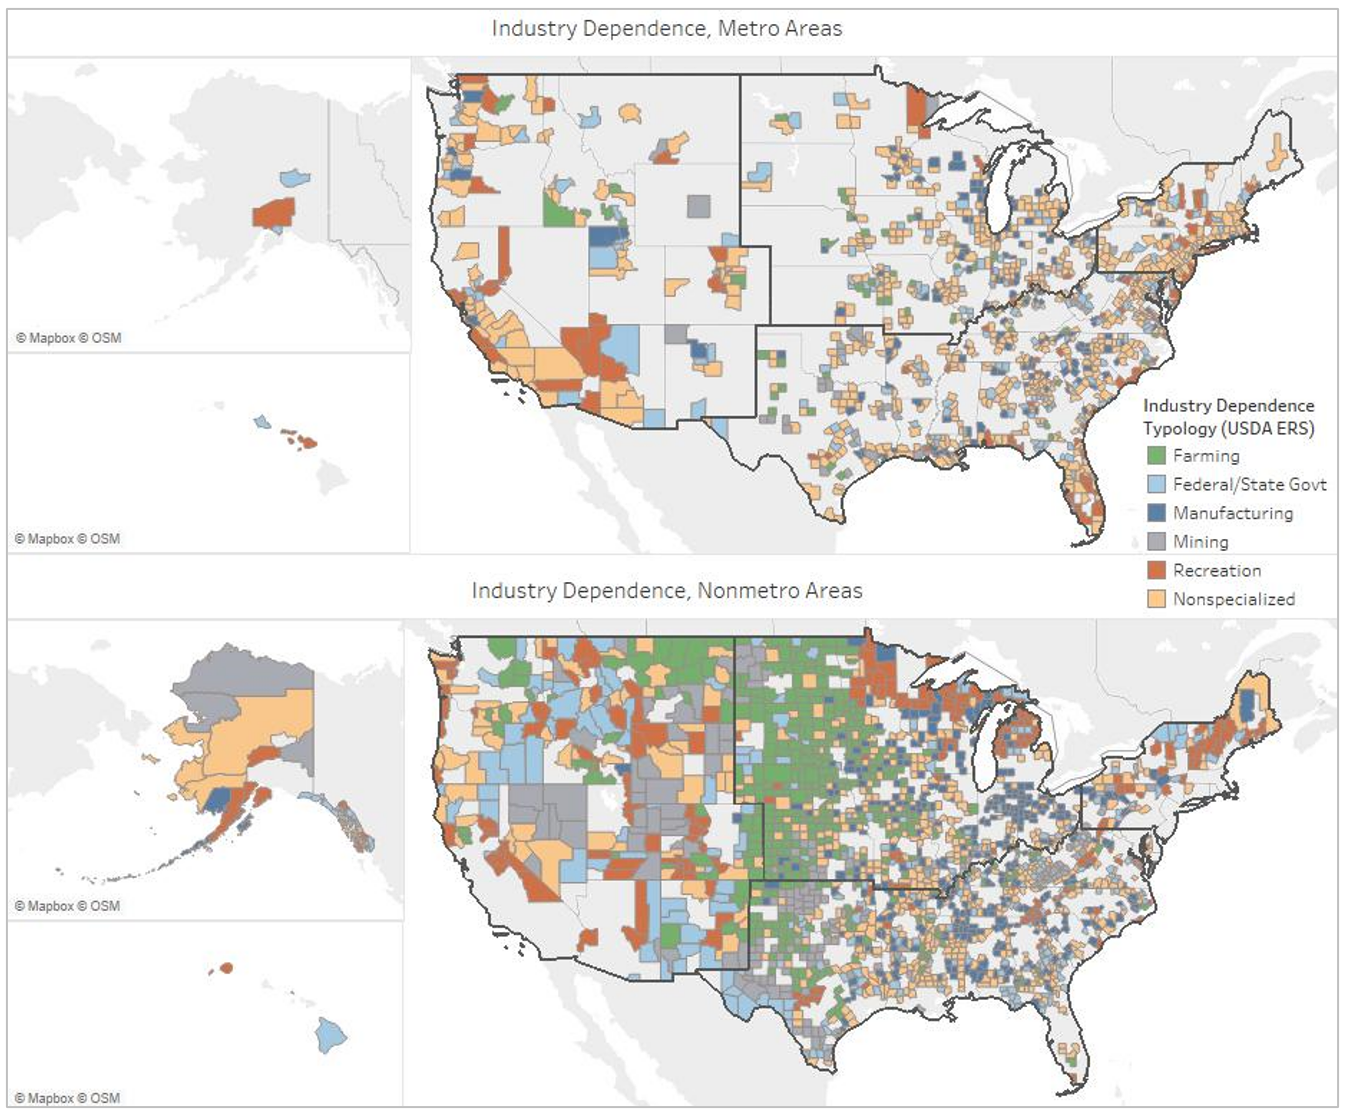
Source: U.S. Department of Agriculture
Similar to the way industries tend to cluster in certain locations, the presence of particular racial or ethnic populations is not evenly distributed across the country. Figure 2 shows how counties with a large share of the population that are Black or African American are concentrated in the Southeast. Counties with large shares of the population that are Asian American are concentrated in the West. Counties with large population shares of American Indians or Alaska Natives are in the South, West, Great Plains, and Alaska. Counties with large shares of the population that are Hispanic or Latino are concentrated in the South and West, with pockets elsewhere.
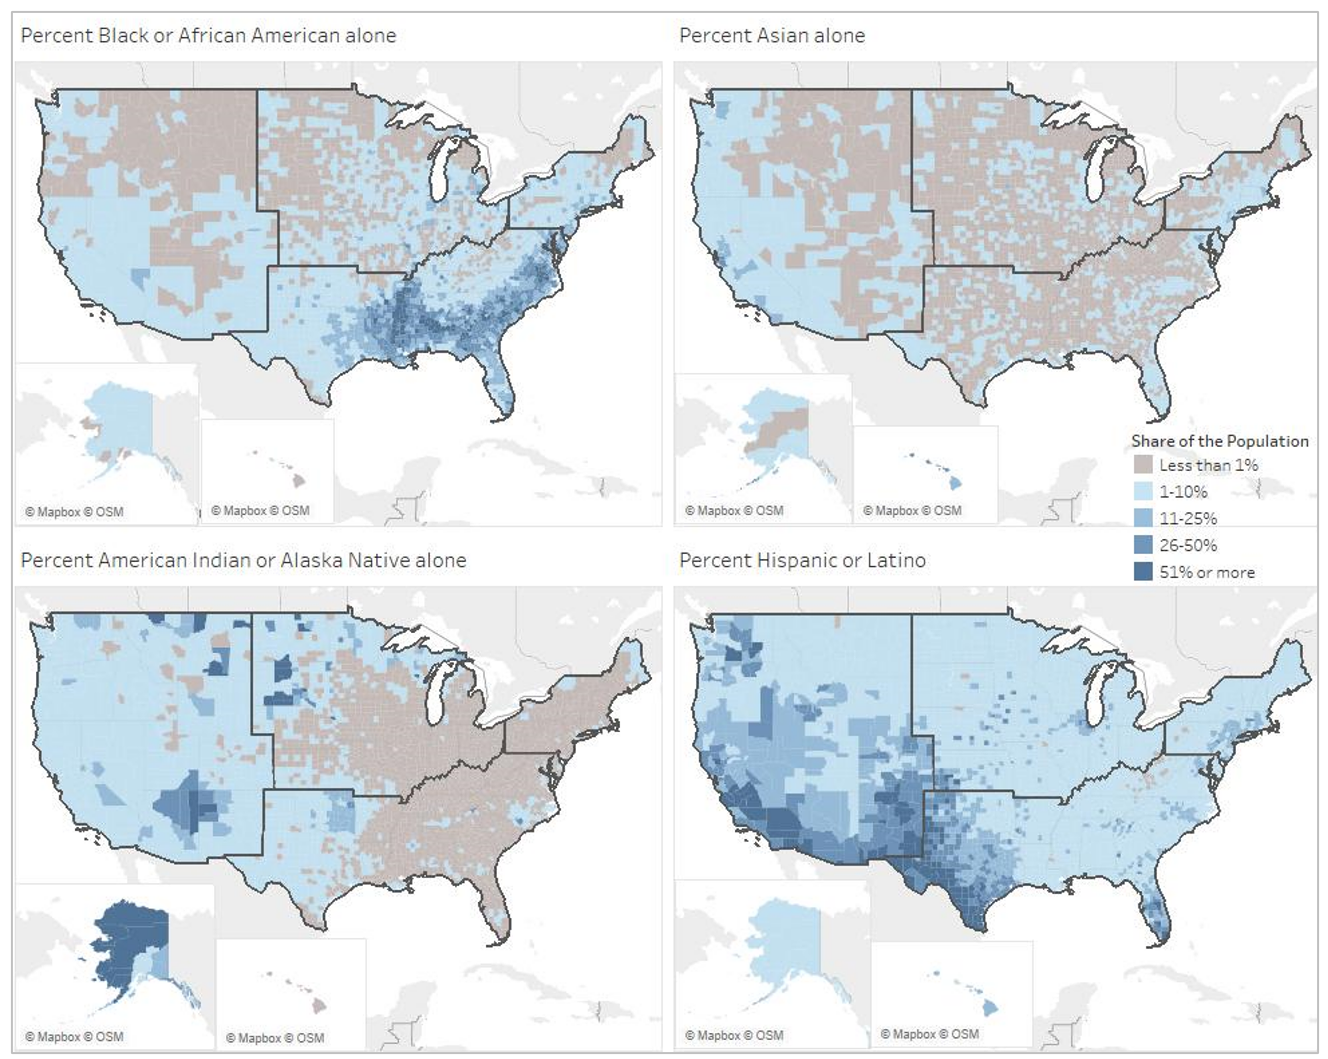
Source: U.S. Census Bureau, Annual Population Estimates
These broad regional differences in the distribution of racial and ethnic groups results in different levels of exposure to the macroeconomic shifts affecting particular industries. However, even within regions, the distribution of racial and ethnic populations is uneven, resulting in differential industrial exposures within regions that may contribute to disparate employment rates.
For example, in the Northeast, a larger share of Black or African American (29%) and American Indian and Alaska Native (29%) populations in nonmetro areas live in counties that are dependent on federal and state government employment than their White peers (20%), while a larger share of the nonmetro White population lives in recreation-dependent counties (28% for the White population versus 24% and 20% for the Black and Native populations, respectively).6
Rural employment disparities vary across regions for people of different races and ethnicities
Table 4 through Table 10 explore this inter- and intra-regional variation in metro-nonmetro employment disparities by race and ethnicity.7
The tables show significant regional differences in the metro-nonmetro employment disparity for different racial and ethnic groups. For example, the South has the highest metro-nonmetro employment disparity for White and Asian American men and women, for Hispanic or Latina women, as well as for men and women reporting two or more races. The Northeast has the highest metro-nonmetro employment differences for Black or African American men and women, for American Indian and Alaska Native men, for men and women identifying as some other race, and for Hispanic and Latino men. Metro-nonmetro employment disparities are largest for American Indian and Alaska Native women in the Midwest.
Table 4. Employment-to-population rate, White alone, 16 to 64 years old, 2021
| Census region | Male | Female | ||||||
|---|---|---|---|---|---|---|---|---|
| Metro | Nonmetro | Diff. | Stat. Sign. | Metro | Nonmetro | Diff. | Stat. Sign. | |
| Northeast | 77.2 | 71.6 | 5.6 | *** | 71.2 | 68.2 | 3.1 | *** |
| Midwest | 79.0 | 75.2 | 3.8 | *** | 72.4 | 69.4 | 2.9 | *** |
| South | 77.3 | 67.3 | 10.0 | *** | 66.6 | 59.3 | 7.4 | *** |
| West | 76.8 | 71.1 | 5.7 | *** | 67.1 | 64.2 | 2.9 | *** |
| White alone, 16 to 64 years old, All regions | 77.3 | 71.2 | 6.1 | *** | 68.6 | 64.6 | 4.0 | *** |
Note: *** = significant at the 99% level
Source: U.S. Census Bureau, American Community Survey, 5-year Estimates, 2017-2021
Table 5. Employment-to-population rate, Black or African American alone, 16 to 64 years old, 2021
| Census region | Male | Female | ||||||
|---|---|---|---|---|---|---|---|---|
| Metro | Nonmetro | Diff. | Stat. Sign. | Metro | Nonmetro | Diff. | Stat. Sign. | |
| Northeast | 62.9 | 23.7 | 39.2 | *** | 66.9 | 53.9 | 13.1 | *** |
| Midwest | 60.5 | 40.8 | 19.7 | *** | 65.2 | 59.3 | 5.9 | *** |
| South | 65.8 | 48.1 | 17.8 | *** | 68.3 | 57.5 | 10.8 | *** |
| West | 63.9 | 42.5 | 21.5 | *** | 64.5 | 57.6 | 6.9 | * |
| Black or AA alone, 16 to 64 years old, All regions | 64.1 | 46.0 | 18.1 | *** | 67.0 | 57.5 | 9.5 | *** |
Note: * = significant at the 90% level, *** = significant at the 99% level
Source: U.S. Census Bureau, American Community Survey, 5-year Estimates, 2017-2021
Table 6. Employment-to-population rate, American Indian and Alaska Native alone, 16 to 64 years old, 2021
| Census region | Male | Female | ||||||
|---|---|---|---|---|---|---|---|---|
| Metro | Nonmetro | Diff. | Stat. Sign. | Metro | Nonmetro | Diff. | Stat. Sign. | |
| Northeast | 66.6 | 44.1 | 22.5 | *** | 58.9 | 51.1 | 7.9 | |
| Midwest | 64.1 | 51.5 | 12.6 | *** | 61.1 | 52.4 | 8.7 | *** |
| South | 71.7 | 58.9 | 12.8 | *** | 60.4 | 55.2 | 5.2 | *** |
| West | 64.6 | 46.2 | 18.5 | *** | 59.4 | 50.9 | 8.5 | *** |
| American Indian or Alaska Native alone, 16 to 64 years old, All regions | 66.7 | 51.3 | 15.4 | *** | 59.8 | 52.6 | 7.2 | *** |
Note: *** = significant at the 99% level
Source: U.S. Census Bureau, American Community Survey, 5-year Estimates, 2017-2021
Table 7. Employment-to-population rate, Asian alone, 16 to 64 years old, 2021
| Census region | Male | Female | ||||||
|---|---|---|---|---|---|---|---|---|
| Metro | Nonmetro | Diff. | Stat. Sign. | Metro | Nonmetro | Diff. | Stat. Sign. | |
| Northeast | 76.8 | 68.2 | 8.6 | *** | 64.1 | 62.1 | 2.1 | |
| Midwest | 78.9 | 74.4 | 4.4 | ** | 65.0 | 60.9 | 4.1 | ** |
| South | 79.6 | 69.8 | 9.9 | *** | 64.2 | 58.6 | 5.6 | *** |
| West | 77.0 | 73.5 | 3.5 | ** | 67.3 | 68.1 | -0.8 | |
| Asian alone, 16 to 64 years old, All regions | 77.8 | 72.2 | 5.7 | *** | 65.6 | 62.7 | 2.9 | *** |
Note: ** = significant at the 95% level, *** = significant at the 99% level
Source: U.S. Census Bureau, American Community Survey, 5-year Estimates, 2017-2021
Table 8. Employment-to-population rate, Some Other Race alone, 16 to 64 years old, 2021
| Census region | Male | Female | ||||||
|---|---|---|---|---|---|---|---|---|
| Metro | Nonmetro | Diff. | Stat. Sign. | Metro | Nonmetro | Diff. | Stat. Sign. | |
| Northeast | 71.2 | 50.5 | 20.6 | *** | 60.9 | 53.8 | 7.0 | ** |
| Midwest | 78.2 | 76.4 | 1.8 | 62.6 | 61.8 | 0.8 | ||
| South | 79.7 | 71.0 | 8.7 | *** | 60.0 | 54.3 | 5.7 | *** |
| West | 75.9 | 70.8 | 5.1 | *** | 59.9 | 60.4 | -0.5 | |
| Some Other Race alone, 16 to 64 years old, All regions | 75.3 | 70.6 | 4.7 | *** | 59.7 | 57.3 | 2.4 | *** |
Note: ** = significant at the 95% level, *** = significant at the 99% level
Source: U.S. Census Bureau, American Community Survey, 5-year Estimates, 2017-2021
Table 9. Employment-to-population rate, Two or More Races, 16 to 64 years old, 2021
| Census region | Male | Female | ||||||
|---|---|---|---|---|---|---|---|---|
| Metro | Nonmetro | Diff. | Stat. Sign. | Metro | Nonmetro | Diff. | Stat. Sign. | |
| Northeast | 70.1 | 59.8 | 10.3 | *** | 64.8 | 61.7 | 3.1 | ** |
| Midwest | 72.0 | 66.4 | 5.5 | *** | 66.2 | 63.0 | 3.2 | *** |
| South | 74.4 | 60.8 | 13.6 | *** | 63.1 | 55.5 | 7.6 | *** |
| West | 71.8 | 64.4 | 7.4 | *** | 63.6 | 60.7 | 2.9 | *** |
| Two or More Races, 16 to 64 years old, All regions | 72.1 | 63.0 | 9.1 | *** | 63.4 | 59.0 | 4.4 | *** |
Note: ** = significant at the 95% level, *** = significant at the 99% level
Source: U.S. Census Bureau, American Community Survey, 5-year Estimates, 2017-2021
Table 10. Employment-to-population rate, Hispanic or Latino, 16 to 64 years old, 2021
| Census region | Male | Female | ||||||
|---|---|---|---|---|---|---|---|---|
| Metro | Nonmetro | Diff. | Stat. Sign. | Metro | Nonmetro | Diff. | Stat. Sign. | |
| Northeast | 71.7 | 52.7 | 19.0 | *** | 62.8 | 58.2 | 4.5 | *** |
| Midwest | 77.6 | 75.1 | 2.6 | *** | 64.7 | 63.6 | 1.2 | * |
| South | 78.4 | 68.0 | 10.4 | *** | 62.2 | 56.2 | 5.9 | *** |
| West | 75.1 | 67.5 | 7.5 | *** | 61.3 | 60.5 | 0.9 | * |
| Hispanic or Latino, 16 to 64 years old, All regions | 74.9 | 68.1 | 6.7 | *** | 61.2 | 58.5 | 2.7 | *** |
Note: * = significant at the 90% level, *** = significant at the 99% level
Source: U.S. Census Bureau, American Community Survey, 5-year Estimates, 2017-2021
Conclusion
The analyses above extended the analysis from the earlier FEDS Note exploring shifts in the economy and how those shifts may have differentially affected employment-to-population rates in nonmetro areas relative to metro areas. They did so by looking at differences across racial and ethnic groups, as well as across different regions of the U.S. They found substantial differences in the metro-nonmetro employment gap across different racial and ethnic groups, with Black or African American and American Indian and Alaska Native men and women having particularly stark rural-urban employment disparities. They also found different regional patterns in the metro-nonmetro employment gap across racial and ethnic groups.
The analyses performed above are descriptive in nature and represent a first step in exploring the depth and distribution of these metro-nonmetro employment gaps. Future quantitative and qualitative research on the exact causes and consequences of these disparities could help inform potential solutions.
Community leaders across different regions of the United States are also undertaking activities aimed at boosting employment among people and communities of color. For example, Community Development Financial Institutions (CDFIs) recently helped ensure that small businesses owned by people of color had access to the COVID-19 era Paycheck Protection Program to improve their chances of surviving the pandemic-induced economic downturn.8 CDFIs are also providing culturally relevant financing and business support tools so potential entrepreneurs are supported in ways that are consistent with their values and beliefs.9 Additionally, community organizations are helping entrepreneurs of color access the capital they need by helping them develop strong loan applications, finding an institution best-suited to meet their specific needs, and connecting them with experts who can assist them in areas like marketing, accounting and legal services.10
By addressing these and other barriers to employment facing rural people and communities of color, community organizations are trying to help narrow the employment gap between urban and rural areas.
1. Andrew Dumont, "Changes in the U.S. Economy and Rural-Urban Employment Disparities," FEDS Notes. Washington: Board of Governors of the Federal Reserve System, January 19, 2024. Return to text
2. See, for example, John J. Green, "The Status of African Americans in the Rural United States," in Rural America in a Globalizing World, ed. Conner Bailey, Leif Jensen, and Elizabeth Ransom (Morgantown: West Virginia University Press, 2014), 435-452. See also, Sarah Dewees, "Native Nations in a Changing Global Economy," in Rural America in a Globalizing World, ed. Conner Bailey, Leif Jensen, and Elizabeth Ransom (Morgantown: West Virginia University Press, 2014), 471-488. See also, Mark H. Harvey and Rosalind P. Harris, "Racial Inequalities and Poverty in Rural America," in Rural Poverty in the United States, ed. Ann R. Tickamyer, Jennifer Sherman and Jennifer Warlick (New York: Columbia University Press, 2017), 141-167. Return to text
3. See, for example, Housing Assistance Council, Taking Stock: Rural People, Rural Places, Rural Housing. Return to text
4. Throughout this article, I primarily use the term "nonmetro" to refer to "rural" communities and use the term "metro" to refer to "urban" communities. Metro areas are defined throughout the analysis as those counties that were classified by the Office of Management and Budget as being in a Metropolitan Statistical Area in 2020. Nonmetro areas are all counties not classified as being in a Metropolitan Statistical Area by the OMB. Return to text
5. Further information on the USDA ERS County Typology Codes is available at: https://www.ers.usda.gov/data-products/county-typology-codes/ Return to text
6. In the interest of space, tables reporting population distributions by race and ethnicity, industry dependence, metro status, and Census Region are not included here. They are available from the author upon request. Return to text
7. Regional figures for Native Hawaiians and other Pacific Islanders are not included, as none of the metro-nonmetro differences were statistically significant. Return to text
8. See, for example, Suzanne Anarde, Bill Bynum, Chrystel Cornelius, Jim King, Nick Mitchell-Bennett, and Ines Polonius, "Cultivating Capital: Partners for Rural Transformation," in Investing in Rural Prosperity, ed. Andrew Dumont and Daniel Paul Davis (St. Louis: Federal Reserve Bank of St. Louis, 2021), 237-250. Return to text
9. See, for example, Elizabeth L. Rogers, John Scribner, and Leah B. Thibault, "Promoting Economic Inclusion in Maine: Systems Change in Rural Communities, One Business at a Time," in Investing in Rural Prosperity, ed. Andrew Dumont and Daniel Paul Davis (St. Louis: Federal Reserve Bank of St. Louis, 2021), 293-302. Return to text
10. See, for example, Tim Lampkin, "Elevating Black Business Ownership and Community Wealth in Mississippi," in Investing in Rural Prosperity, ed. Andrew Dumont and Daniel Paul Davis (St. Louis: Federal Reserve Bank of St. Louis, 2021), 397-408. Return to text
Dumont, Andrew (2024). "Rural Employment Disparities by Race, Ethnicity, and Region," FEDS Notes. Washington: Board of Governors of the Federal Reserve System, May 31, 2024, https://doi.org/10.17016/2380-7172.3510.
Disclaimer: FEDS Notes are articles in which Board staff offer their own views and present analysis on a range of topics in economics and finance. These articles are shorter and less technically oriented than FEDS Working Papers and IFDP papers.