FEDS Notes
February 23, 2024
Supply vs Demand Factors Influencing Prices of Manufactured Goods
Robin Braun, Aaron Flaaen and Sinem Hacıoğlu Hoke
The strong surge and rapid retreat of U.S. goods price inflation during 2021-2023 has occupied the forefront of economic policy discussions, and debate on the primary causes continues. Some commentators point to widespread supply bottlenecks and adverse geo-political events that caused significant disruption to the production and availability of manufactured goods. Others argue that significant shifts in aggregate demand for manufactured goods were the leading factors underlying these observed price fluctuations, and cite shifts in consumer preferences, unprecedented discretionary fiscal policy, and a change in the monetary policy stance following the pandemic.
In this note, we provide new evidence to the debate of how much of the recent run-up and retreat of producer price inflation is driven by supply versus demand factors, which is part of an ongoing area of research that has seen recent contributions by e.g. Shapiro (2022), Benigno and Eggertsson (2023), Kabaca and Tuzcuoglu (2023), Bai, Fernández-Villaverde, Li and Zanetti (2024) among others. Quantifying the relative effects of supply and demand shocks is critical to understanding movements in inflation and, thus, to informing appropriate policy responses to changes in inflation.
The recent contour of producer price inflation for manufactured goods
Figure 1 (top panel) shows the year-on-year (YoY) inflation rate based on the U.S. Producer Price Index (PPI) of manufactured goods published by the Bureau of Labor Statistics. After a brief decline during the height of the pandemic, prices climbed rapidly in subsequent months, reaching rates above 18%, the highest recorded values since the start of the index in 1987. Then, in 2023, manufacturing producer prices suddenly levelled off, with a rapid decline in the rate of inflation to levels near zero.
How much of these fluctuations can be attributed to supply and demand factors? Answering this question has proved very difficult not only because of the complexity of the post-pandemic period, but also because many of the observed outcomes could be consistent with either changes in supply or demand conditions. For new evidence on this topic, we leverage data from the Quarterly Survey of Plant Capacity (QPC), a U.S. Census Bureau data product primarily designed to gauge capacity and utilization rates in the manufacturing sector.
The survey asks establishments to report their full production capabilities (capacity) as well as their operating rate, with plants operating at less than full capacity further asked to identify the reasons. As shown in Figure 1 (bottom left), in normal times the vast majority of establishments cite lack of demand (or, "insufficient orders") as the reason for operating at less than capacity. During the pandemic, this share dropped notably, with the fraction of plants citing "insufficient orders" reaching an all-time low of just 48.3% in the first quarter of 2022. On the other hand, Figure 1 (bottom right) also shows a spike of manufacturing establishments citing "insufficient supply of materials" during the pandemic, with this fraction reaching an all-time high of 42.7% of firms in the fourth quarter of 2021. Both of these spikes in establishment responses have since largely, though not completely, unwound to more typical levels. Taken together, the evidence from the QPC suggests both supply and demand as being important drivers of producer prices over the last few years.
The QPC is a useful resource for gauging demand and supply conditions together in one survey. Moreover, the QPC measure of supply bottlenecks is ideal in that it captures the extent to which a firm is constrained from producing a desired quantity. However, the published QPC data only report the share of respondents citing a certain explanation, which has drawbacks in quantifying structural supply and demand factors underlying the manufacturing PPI. Furthermore, even if used as direct explanatory variables for PPI inflation, their high mutual correlation would make it difficult to disentangle their individual contributions.
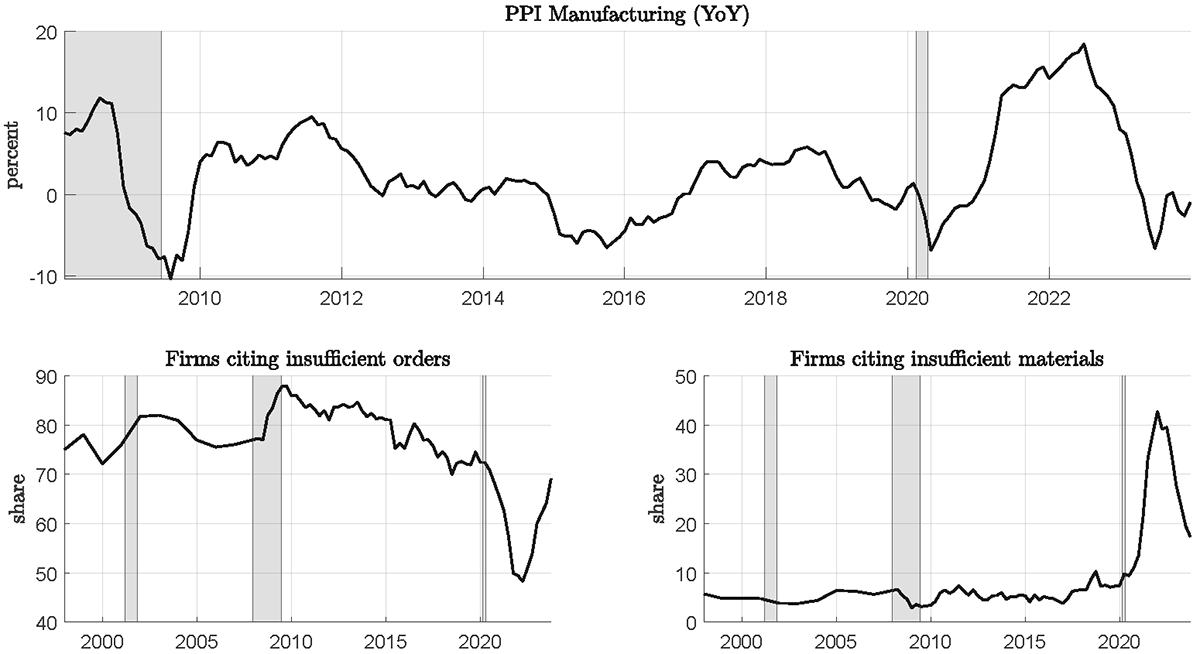
Note: Shaded areas indicate periods of recessions as defined by the National Bureau of Economic Research where appropriate: March 2001–November 2001, December 2007–June 2009 and February 2020–April 2020.
Sources: Top panel: Bureau of Labor Statistics. Bottom panel: U.S. Census Bureau Quarterly Survey of Plant Capacity (Disclosure Review Board (DRB) approval number: CBDRB‑FY23‑0231).
An industry-level decomposition of price fluctuations into supply and demand
In this FEDS note, we argue for an approach that combines insights from the QPC survey data with bivariate industry-level structural vector autoregressive (VAR) models for industrial production (quantities) and producer prices. These are simple models designed to disentangle producer price fluctuations into supply and demand factors. We then relate these models to industry-level estimates of demand and supply constraints from the QPC survey data to obtain sharper identification. After decomposing changes in PPI into supply and demand factors at a granular level, we then aggregate to obtain a decomposition for the entire manufacturing sector.
For our exercise, we collect data at the 3-digit North American Industry Classification System (NAICS) level for industrial production (IP) and producer price indexes, and match those with shares of establishments reporting either insufficient materials or insufficient demand in the QPC data. After extending PPI indexes back in time, the result is monthly data on IP and PPI from 1978 to December 2023, for a total of 18 industries1, and quarterly QPC survey data going back to 2008.
In the following, we denote by $$ q_{it} $$ and $$ p_{it} $$ the monthly percentage changes in industry i's industrial production and producer price index, respectively. We consider bivariate industry-level structural VAR (SVAR) models of the form:
$$$$ q_{it} = \alpha_i p_{it} + c_{1i} + \sum_{j=1}^{12} \alpha_{ij}^{qq} q_{i,t-j} + \sum_{j=1}^{12} \alpha_{ij}^{qp} p_{i,t-j} + \epsilon_{it}^s , \\ $$$$
$$$$ q_{it} = \beta_i p_{it} + c_{2i} + \sum_{j=1}^{12} \alpha_{ij}^{pq} q_{i,t-j} + \sum_{j=1}^{12} \alpha_{ij}^{pp} p_{i,t-j} + \epsilon_{it}^d , $$$$
where the first equation is the supply equation perturbed by supply shocks $$ \epsilon_{it}^s $$, with $$ \alpha_i $$ measuring industry i's short-run price elasticity of supply. The second equation represents the demand equation, where $$ \epsilon_{it}^d $$ are demand shocks and $$ \beta_i $$ measures the short-run price elasticity of demand. The rest of the coefficients are meant to capture the joint-dynamics of IP and PPI around their average growth rate.
Without further assumptions, the bivariate system of equations is not identified, yielding many constellations of $$ \alpha_i $$ and $$ \beta_i $$ equally consistent with the data (for a discussion, see e.g., Kilian and Lütkepohl (2017)). To achieve identification, we impose a series of identifying constraints. First, we assume conventional sign restrictions on the short run price elasticities. This includes that the supply curve is upward sloping ($$ \alpha_i > 0 $$ ), while the demand curve is downward sloping ($$ \beta_i < 0 $$ ). Second, we postulate that quarterly averages of structural supply and demand shocks should be highly correlated with the change in the QPC survey measure for establishments citing insufficient materials and insufficient demand, respectively.2 Once the model is identified, it is possible to decompose industry i's PPI growth through the lenses of the estimated SVARs as:
$$$$ p_{it} = \mu_i + p_{it}^d + p_{it}^s $$$$
where $$\mu_i $$ is the average growth rate of industry i's PPI index, the term $$p_{it}^s $$ is the variation that can be accounted for by supply shocks, and the term $$ p_{it}^d $$ is the variation driven by demand shocks. Finally, an approximate decomposition of the aggregate PPI's monthly percentage increase $$ p_t $$ is then given by:
$$$$ p_{t} = \underbrace{\sum_i w_{i,t} \mu_i}_{\text{deterministic components}} + \underbrace{\sum_i w_{i,t} p_{it}^s}_{\text{supply factors}} + \underbrace{\sum_i w_{i,t} p_{it}^d}_{\text{demand factors}} $$$$
where $$w_{i,t} $$ are industry relative importance weights available from the Federal Reserve Board's Industrial Production G.17 statistical release.3
This methodology is related to the recent work by Shapiro (2022), which disentangles the supply and demand factors driving the Personal Consumption Expenditure price index by leveraging joint fluctuations in quantity and price data of individual PCE goods and services categories. For each month, a category's PCE growth rate is allocated to either the supply or demand component based on sign restrictions equivalent to what we use in our industry level SVARs. We refine this approach by sharpening the identification strategy, i.e. leveraging the additional survey data that is unique to the manufacturing sector. In addition, our approach allows us to decompose each industry's monthly variation into a mix of both demand and supply factors, and historical realizations thereof, instead of only estimating their net effect, as in Shapiro (2022).
Validating the supply and demand decomposition
Before discussing the results of our decomposition, we first conduct an exercise to test the ex-post validity of our methodology. Following Shapiro (2022), we study the dynamic response of the estimated PPI demand and supply factors to well-understood macroeconomic shocks. Specifically, we estimate empirical impulse response functions (IRF) to a monetary policy shock as in Bauer and Swanson (2023), and oil supply shocks as in Kanzig (2021).4 For a credible decomposition, only the demand component of the PPI should respond to a monetary policy shock, and only the supply component to an oil supply shock.
Figure 2 shows estimates of these IRFs to a monetary policy shock, normalized to increase the Fed Funds rate by 25 basis points (top panel), and an oil supply shock normalized to increase the real oil price by 10% (bottom panel). The solid lines show the dynamics of producer prices in percentage deviations from trend, with dashed and dotted lines indicating estimation uncertainty at the 68% confidence interval coming from two econometric procedures.5 As we expect, the demand-driven level of producer prices is estimated to decrease in response to a 25bp tightening in monetary policy, peaking at about -0.5 percent after 18 months. On the other hand, the dynamic effect on the supply factor remains small and is statistically insignificant. Similarly, in the IRFs to a cost-pushing oil supply shock normalized to increase oil prices by 10%, we find strong reactions in supply driven factors, which peak rapidly at around 0.7 percent after 8 months. The demand component is estimated to decrease slightly but remains insignificant.
These IRF results validate that the supply and demand shocks we identify act as intended in disentangling the supply and demand driven fluctuations in the producer price index of manufactured goods.6 Next, we show the role these supply and demand factors have played in the evolution of the manufacturing PPI since 2007.
Figure 2. Estimated impulse Response Functions of the PPI Decomposition to Monetary Policy and Oil Supply Shocks
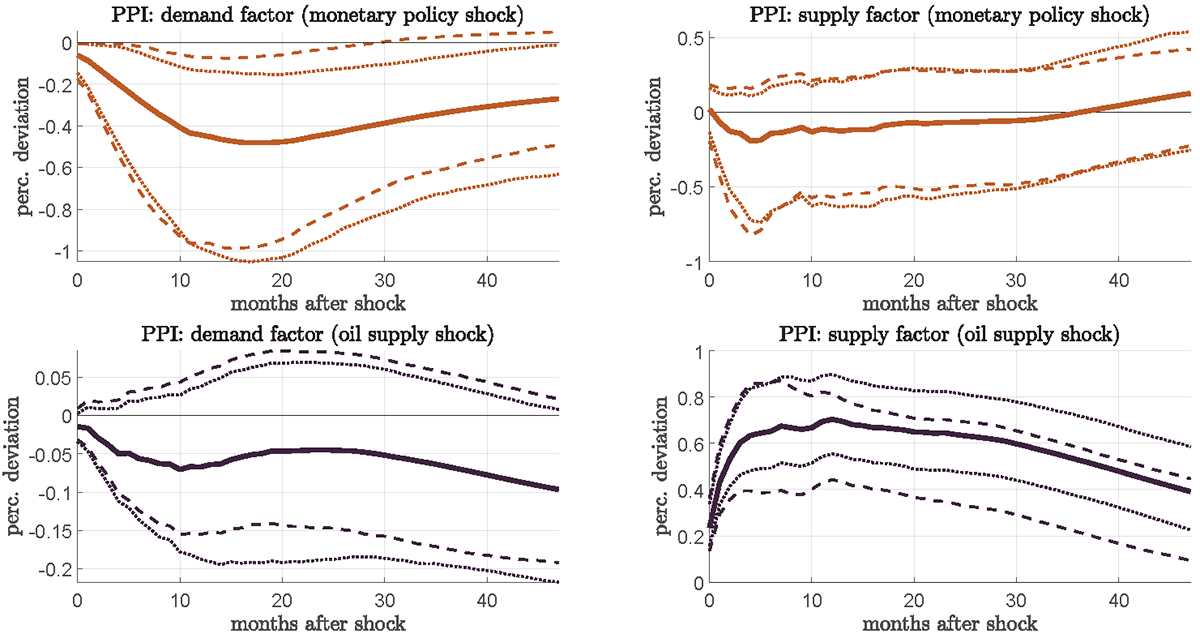
Note: The solid lines show the dynamics of producer prices in percentage deviations from trend, with dashed and dotted lines indicating estimation uncertainty at the 68% confidence interval. The dashed line corresponds to confidence intervals computed by the block bootstrap of Jentsch and Lunsford (2022), while the dotted line corresponds to weak-identification robust confidence set by Montiel Olea, Stock and Watson (2021).
The supply and demand factors driving producer price inflation for manufactured goods
Figure 3 plots the estimated decomposition of the year-on-year PPI inflation rate (black line), adjusted for the deterministic terms. The beige bars capture the fluctuations that are attributed to supply shocks, while the red bars capture demand factors. The gray shaded areas correspond to recessions as reported by the National Bureau of Economic Research.
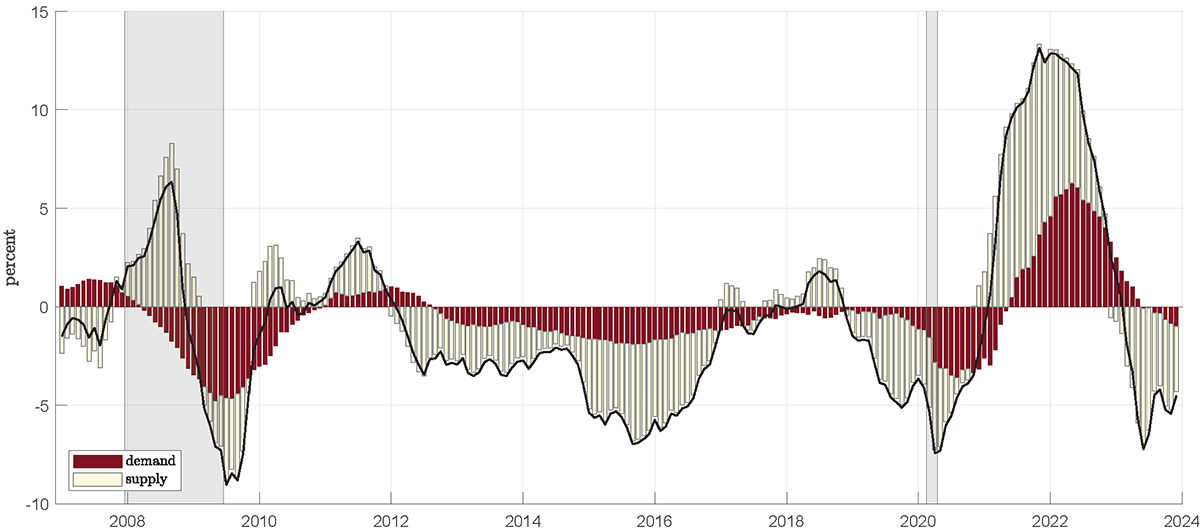
Note: Shaded areas indicate periods of recessions as defined by the National Bureau of Economic Research: December 2007–June 2009 and February 2020–April 2020.
We focus our discussion of this decomposition on the period of the Great Financial Crisis (GFC) as well as the COVID and post-Covid inflation surge more recently.
Great Financial Crisis
The increase in prices at the onset of the Great Financial Crisis has been well documented. Hamilton (2009) discusses in detail the demand and supply factors leading to the oil price shock in 2007-2008 which contributed significantly to the increase in goods prices. Caballero, Farhi and Gourinchas (2008) highlight the surge in commodity (in particular oil) prices during the early part of the GFC. The Caballero et al. (2008) model alongside the evidence put forward by Christiano, Eichenbaum, Trabandt (2015) and Gilchrist, Schoenle, Sim, Zakrajsek (2017), argues that the main reason for the commodity price volatility and other "missing disinflation/deflation" during this time was ultimately due to the scarce supply of liquid financial assets.
Our decomposition for the Great Financial Crisis suggests that the sharp increase in producer prices was predominantly due to supply factors. This result lends support to research emphasizing the cost pressures on U.S. producers emanating from higher global commodity prices and reduced availability of credit in the initial phase of the crisis. In the second phase, after the severe disruption to financial markets and sharp decline in aggregate activity triggered by the bankruptcy of Lehman Brothers in September 2008, the decomposition intuitively shows that the resulting changes in prices are driven mostly by demand factors.
Covid and its aftermath
The decomposition in Figure 3 also shows features of the Covid period that are both intuitive and revealing. The change in PPIs during the first few months of the pandemic is skewed to changes in demand factors, which aligns with the experience of extensive shutdowns during this period. In subsequent months (from mid-2020 into 2021), however, supply factors quickly moved from being a drag on prices to being a driver of price increases. Indeed, significant jumps in supply factors occur around February 2021, aligning with the so-called Texas Freeze that had dramatic effects on the petrochemical and downstream industries. It was also during this time that semiconductor shortages began to impact prices and delivery times of many manufactured goods including automobiles, computers, household appliances and other consumer electronics.
Noticeable changes in the demand contributions lag those of supply, with a switch from a drag on prices to supporting price increases in the first half of 2021. Supply contributions to price increases peak in the latter half of 2021, while demand contributions peak in early 2022, very soon (maybe a quarter or two) after U.S. monetary policy tightens.
More recently, both supply and demand have moved into negative territory in 2023, with once again supply moving more suddenly and somewhat in advance of the demand contributions. In the last data point, in December 2023, supply factors remain the main drag on goods prices, although in the last five months demand is beginning to exert significant downward pressure as well.
Conclusion
Combining novel survey evidence with a structural VAR model of quantities and prices, we decompose the role of supply and demand factors in U.S. manufacturing producer price inflation from 2007 to 2023. Such a decomposition is particularly useful in recent years encompassing the post-COVID inflation surge, as policymakers and market participants debate the relative impacts of monetary policy versus supply chain normalization in the rapid disinflationary period observed in 2022 and 2023. Over the last several years, our evidence points to a significant role for supply factors in the run-up and retreat of goods prices, with demand factors contributing to that contour, but with a lag. Looking ahead, this decomposition will further our understanding of the forces behind future inflation developments, while also serving to inspire other ways in which survey evidence can be combined with more traditional tools for identifying the mechanisms underlying economic outcomes.
References
Bai, Xiwen, Jesus Fernández-Villaverde, Yiliang Li and Francesco Zanetti (2024). "DP18785 The Causal Effects of Global Supply Chain Disruptions on Macroeconomic Outcomes: Evidence and Theory". CEPR Discussion Paper No. 18785. CEPR Press, Paris & London. https://cepr.org/publications/dp18785.
Bauer, Michael D., and Eric T. Swanson. "A reassessment of monetary policy surprises and high-frequency identification." NBER Macroeconomics Annual 37.1 (2023): 87-155.
Benigno, Pierpaolo and G Eggertsson (2023). "DP18116 It's Baaack: The Surge in Inflation in the 2020s and the Return of the Non-Linear Phillips Curve". CEPR Discussion Paper No. 18116. CEPR Press, Paris & London. https://cepr.org/publications/dp18116.
Byrne, David M., Stephen D. Oliner, and Daniel E. Sichel. "How fast are semiconductor prices falling?" Review of Income and Wealth 64.3 (2018): 679-702.
Caballero, Ricardo J., Emmanuel Farhi, and Pierre-Olivier Gourinchas. "Financial Crash, Commodity Prices, and Global Imbalances." Brookings Papers on Economic Activity 2008 (2008): 1–55. http://www.jstor.org/stable/27720394.
Christiano, Lawrence J., Martin S. Eichenbaum, and Mathias Trabandt. 2015. "Understanding the Great Recession." American Economic Journal: Macroeconomics, 7 (1): 110-67.
Gilchrist, Simon, Raphael Schoenle, Jae Sim, and Egon Zakrajšek. 2017. "Inflation Dynamics during the Financial Crisis." American Economic Review, 107 (3): 785-823.
Hamilton, James D. "Causes and Consequences of the Oil Shock of 2007–08." Brookings Papers on Economic Activity 2009 (2009): 215–61. http://www.jstor.org/stable/25652719.
Jentsch, Carsten, and Kurt G. Lunsford. "Asymptotically valid bootstrap inference for proxy SVARs." Journal of Business & Economic Statistics 40.4 (2022): 1876-1891.
Kabaca, Serdar and Kerem Tuzcuoglu, 2023. "Supply Drivers of US Inflation Since the COVID-19 Pandemic," Staff Working Papers 23-19, Bank of Canada.
Känzig, Diego R. "The macroeconomic effects of oil supply news: Evidence from OPEC announcements." American Economic Review 111.4 (2021): 1092-1125.
Kilian, Lutz, and Helmut Lütkepohl. 2017. "Structural vector autoregressive analysis". Cambridge University Press.
Montiel Olea, José L., James H. Stock, and Mark W. Watson. "Inference in structural vector autoregressions identified with an external instrument." Journal of Econometrics 225.1 (2021): 74-87.
Shapiro, Adam Hale. 2022 "Decomposing Supply and Demand Driven Inflation," Federal Reserve Bank of San Francisco Working Paper 2022-18. https://doi.org/10.24148/wp2022-18
1. We exclude Food Manufacturing (311), Beverage and Tobacco Product Manufacturing (312) to obtain a notion of core manufacturing prices, and exclude Computer and Electronic Product Manufacturing (334) due to difficulties reconciling different measures of semiconductor producer prices (see e.g. Byrne, Oliner and Sichel (2018)). Return to text
2. Technically, this is achieved by identifying the pair of $$α_i$$ and $$β_i$$ which (a) is consistent with the data, (b) satisfies the sign-restrictions, and (c) maximizes the sum of sample correlations between (i) the (quarterly) supply shock and the change in firms citing 'insufficient materials', and (ii) the (quarterly) demand shock and one minus the share of firms citing 'insufficient demand'. These sample correlations are computed over the period 2008-2023 for which quarterly QPC data is available. Finally, the VAR reduced form parameters are estimated based on a reduced sample of 1978-2019 to avoid an effect of large outliers on parameter estimates. Return to text
3. Federal Reserve Board - Industrial Production and Capacity Utilization - G.17 Return to text
4. We obtain these empirical estimates following the instrumental variable identified VARs in each of the papers, augmented by our PPI demand and supply factors. Specifically, the VAR to explore the monetary policy shock include 1 year Treasury yield, CPI, IP, Excess Bond Premium, PPI supply and demand shocks. The VAR to explore the oil shocks include real WTI, world oil production, world IP, inventories, PPI demand and supply shocks. Return to text
5. The dashed line corresponds to confidence intervals computed by the block bootstrap of Jentsch and Lunsford (2022), while the dotted line corresponds to weak-identification robust confidence set by Montiel Olea, Stock and Watson (2021). Return to text
6. If we were to instead throw out the identifying variation from the QPC data and rely only on movements in quantities and prices for the full 60 industries for which we have data – effectively applying the method in Shapiro (2022) to our manufacturing context – the IRFs do not successfully isolate supply and demand from these shocks. We argue this reinforces the importance of the QPC survey data when studying price movements in the manufacturing sector, rather than anything specific about the methodology in Shapiro (2022) more generally. Return to text
Braun, Robin, Aaron Flaaen, and Sinem Hacıoğlu Hoke (2024). "Supply vs Demand Factors Influencing Prices of Manufactured Goods," FEDS Notes. Washington: Board of Governors of the Federal Reserve System, February 23, 2024, https://doi.org/10.17016/2380-7172.3465.
Disclaimer: FEDS Notes are articles in which Board staff offer their own views and present analysis on a range of topics in economics and finance. These articles are shorter and less technically oriented than FEDS Working Papers and IFDP papers.