FEDS Notes
January 12, 2024
The Effects of Credit Score Migration on Subprime Auto Loan and Credit Card Delinquencies
John Driscoll, Jessica Flagg, Bradley Katcher, and Kamila Sommer1
Introduction
In the early stages of the pandemic, income support and forbearance programs led consumer loan delinquency rates to fall to near-record lows for borrowers across the credit score distribution. Since the second half of 2021, however, delinquency rates have risen, and by 2023:Q3, overall rates for auto and credit card loans had exceeded their pre-pandemic levels. Delinquency rates for borrowers with subprime credit scores rose even more significantly, and the rate for subprime auto loans in 2023:Q3 was at its highest level since 2000.
In this note, we show that the very large increases in subprime delinquency rates are in large part driven by pandemic-era shifts in the credit score distribution, or upward "credit score migration." Over the course of the pandemic, many consumers saw an in increase their credit scores sufficient to move out of the subprime category, and the share of borrowers with subprime scores decreased to the lowest level seen since the late 1990s. We provide counterfactual calculations that hold borrowers' credit scores at their 2019:Q4 levels to show how much the upward migration in scores has contributed to the sharp rise in the subprime delinquency rate. We find that counterfactual subprime delinquency rates were both considerably lower and have shown more muted increases. Thus, the historically high delinquency rates for auto loans to subprime borrowers overstates to an important extent the overall stress among borrowers more broadly.
While our analysis highlights the important quantitative role that credit score migration has had in the recent behavior of subprime delinquency rates, our counterfactual simulations are not intended to create an alternative, "true", subprime delinquency rate. Instead, they are designed to highlight the important role of credit score migration in the dynamics of the subprime delinquency rate in recent data. The subprime rate is inherently affected by migration of borrowers across credit score category and, over longer horizons, delinquencies and defaults could lead to credit score downgrades and move borrowers into the subprime credit one. Moreover, this analysis should not be read as suggesting that delinquency rates could not exhibit further deterioration over coming quarters.
Data
We use data from the Federal Reserve Bank of New York Consumer Credit Panel/Equifax (hereafter CCP). This is a nationally representative dataset that contains credit reporting data for a random and anonymized, five percent sample of the population with credit histories. In the following discussion we define subprime as those borrowers with Equifax Risk Scores of less than 620, near prime as those with scores between 620 and 719, and prime as those with scores greater than 720.2
Results
We first discuss the evolution of credit score distributions over time, and then spell out the implications for delinquency rates. As shown in Figure 1, the share of consumers with subprime credit scores has been falling since the end of the Global Financial Crisis, possibly owing to the substantial amount of household deleveraging amid tighter loan underwriting standards (Figure 1). Goodman et. al (2021) documented that this decline accelerated starting in 2020, largely driven by COVID-19 relief policies such as the Coronavirus Aid, Relief and Economic Security Act's forbearance provisions. Over the course of the pandemic, the share of borrowers with subprime scores fell from about 23 to 18 percent, with most of the increase in shares coming in the prime category. Partly as a result, the shares of subprime auto loan balances fell from about 20 to 17 percent, while the share of subprime credit card balances declined from about 9 to 8.5 percent.
Figure 1. The share of subprime borrowers has fallen, with the rate of decline increasing during the pandemic
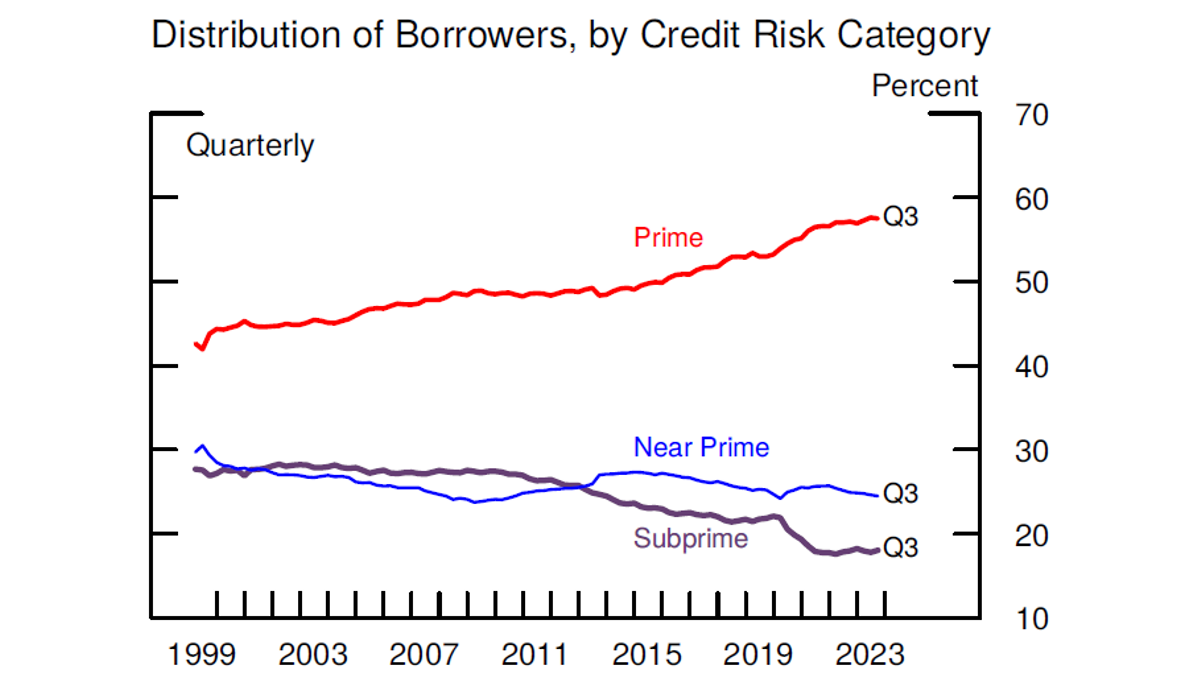
Note: Share of credit scored-individuals in indicated credit risk category. Prime refers to credit scores above 719, near prime between 620 and 719, and subprime below 620.
Source: Federal Reserve Bank of New York Consumer Credit Panel/Equifax.
Figure 2 shows the behavior of auto loan and credit card loan delinquency rates by credit score category. Delinquency rates fell during the initial stage of the pandemic, likely due to the same income and forbearance programs that caused changes in the credit score distribution. That said, since 2021, rates have increased across the credit score distribution, with an especially notable increase among subprime auto loan borrowers who saw their delinquency rates increase from 12 percent in 2019:Q4 to 15 percent in 2023:Q3. Part of this increase reflects a rise in delinquent subprime auto loan balances—the numerator of the subprime delinquency rate—which grew from about $30 billion in 2019:Q4 to $40 billion in 2023:Q3—more than a 30 percent increase. In addition, auto loan balances owed by borrowers with subprime scores—the denominator of the subprime delinquency rate—grew relatively slowly over this period, increasing just 4 percent from 2019:Q4 to 2023:Q3 (from $248 billion to $257 billion, on net), as a large fraction of consumers (and the debt they owed) migrated from the subprime to the near-prime and prime credit score categories.
Figure 2. Delinquency rates on auto and credit card loans have reversed their pandemic declines, with especially large increases for subprime borrowers
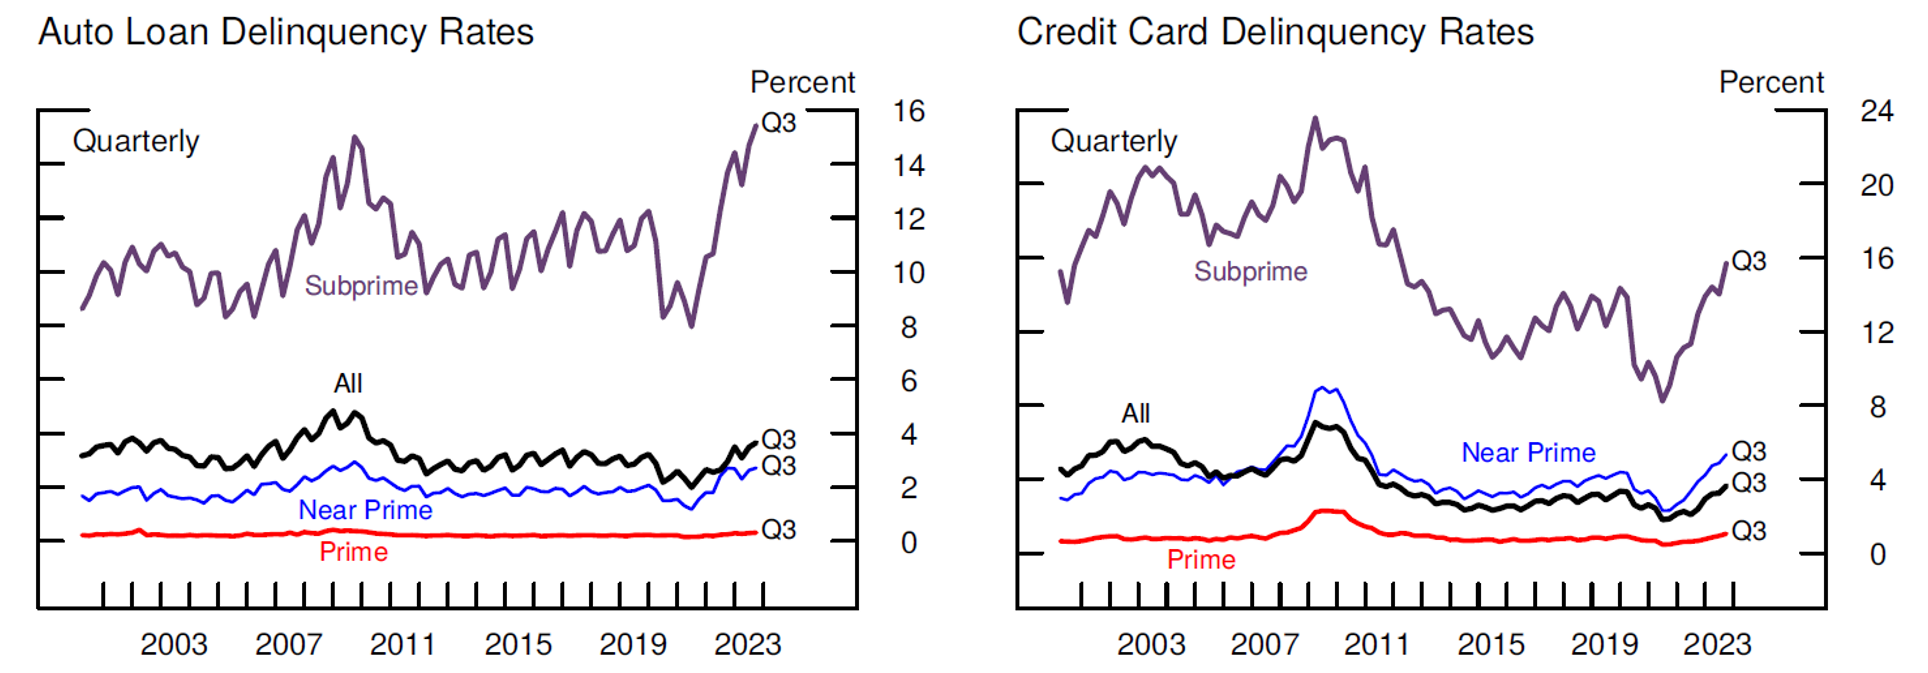
Note: Delinquency measures the fraction of balances that are at least 30 days past due, excluding severely derogatory loans. Prime refers to credit scores above 719, near prime between 620 and 719, and subprime below 620. Credit scores lagged four quarters.
Source: Federal Reserve Bank of New York Consumer Credit Panel/Equifax.
In Figure 3, we formally explore the role of credit score migration by plotting the percent change in delinquency rates against the percent change in balances over 2019:Q3 to 2023:Q3, with shading by 20-point credit score bins. For example, the point labeled "520" plots the change in delinquency rates (the y-axis) over that period for borrowers with credit scores between 520 and 540 against the change in balances (the x-axis) for the same borrowers. As expected, the greatest increases in delinquency rates occurred among accounts in the lowest credit risk score bins (the red shades). In addition, the plot is downwards-sloping, showing that the greatest increases in delinquency rates occurred in categories for which balances shrank the most, likely because of the upward credit score migration.
Figure 3. Delinquency rates rose over the pandemic the most for lower-rated borrowers, who also have seen their balances decrease
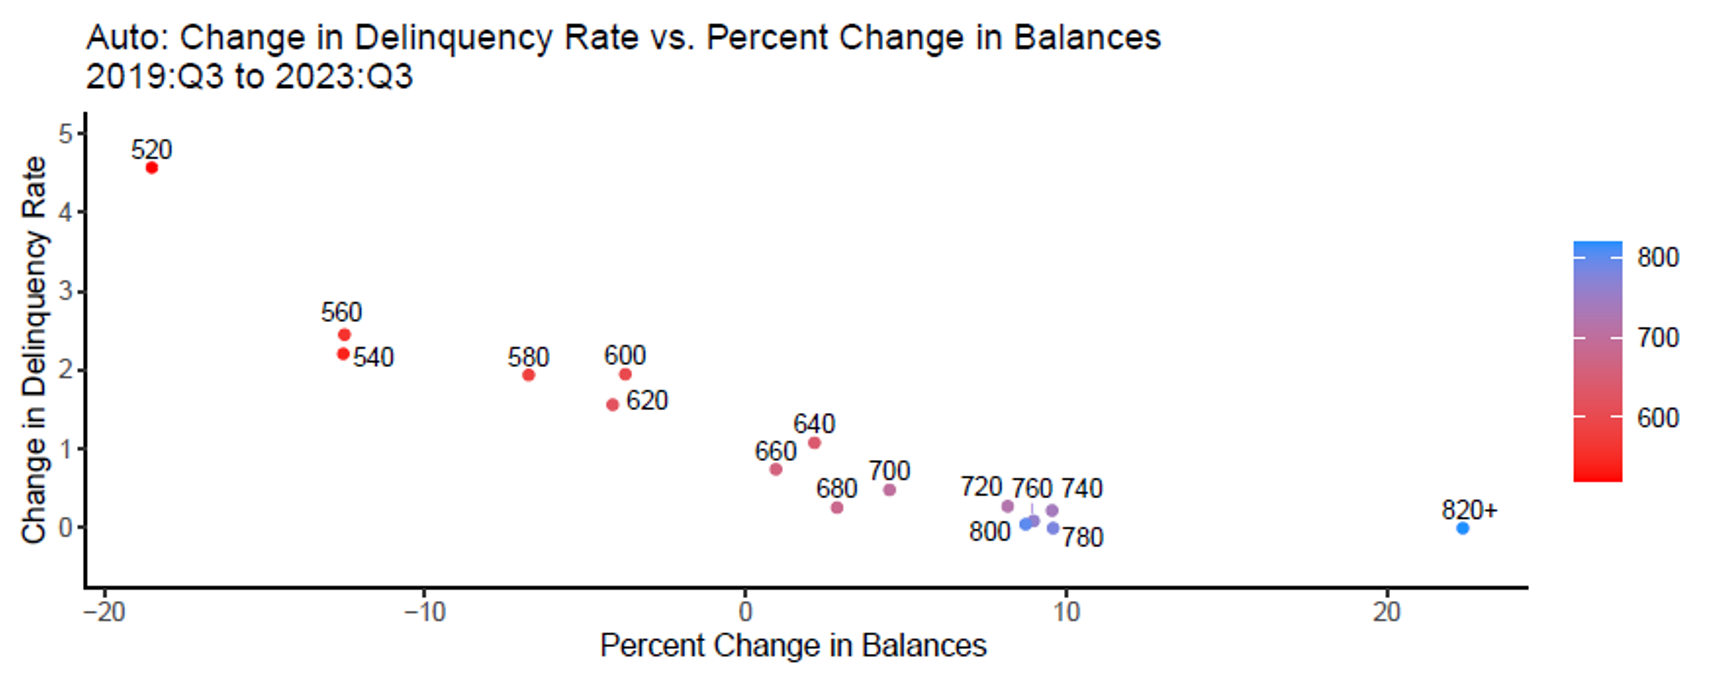
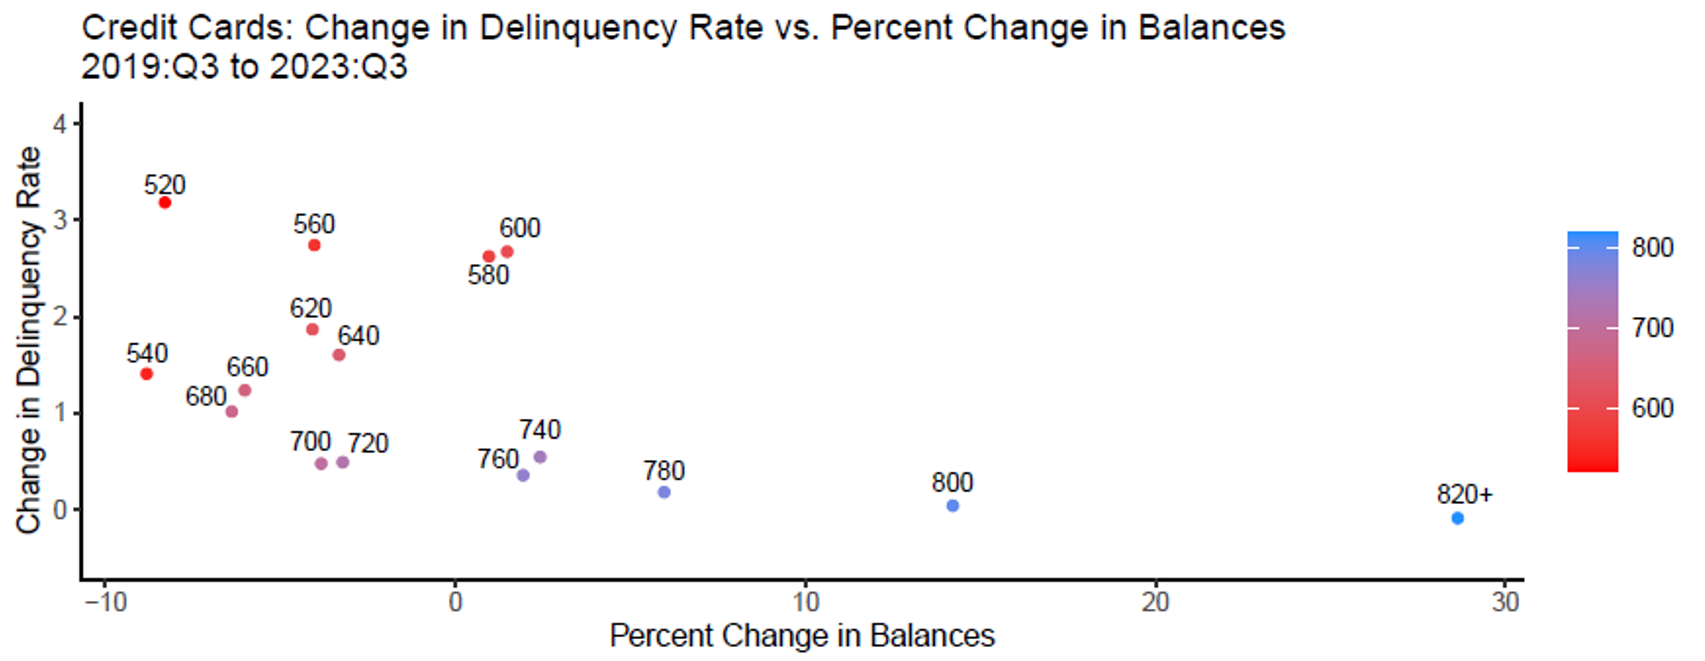
Note: Each scatterplot dot represents a 20−point credit score bin with the number representing the first Equifax Risk Score in the bin. 820+ contains all Equifax Risk Scores greater than or equal to 820.
Source: Federal Reserve Bank of New York Consumer Credit Panel/Equifax.
To demonstrate the impact of credit score migration in recent data further, we simulate the subprime delinquency rate under a counterfactual scenario that assumes pre-pandemic credit scores continued to prevail. Consumer-by-consumer, we fix borrower credit scores to their 2019:Q4 values in all quarters after that time.3 Table 1 shows the impact of this counterfactual assignment for auto loans for 2023:Q3. By construction, in both scenarios, the overall delinquency rate is the same (3.5 percent). However, under the counterfactual scenario, the subprime delinquency rate would be much lower (about 10 percent) than the actual rate (about 15 percent) in 2023:Q3, while the counterfactual subprime share of the total auto balance would be higher at about 24 percent, compared to about 17 percent in the actual data.
Table 1: Auto Loans: Actual and Counterfactual Delinquency Rates and Shares, 2023:Q3 (percent)
| Actual Delinquency Rate | Actual Share of Total Balances | Counterfactual Delinquency Rate | Counterfactual Share of Total Balances | |
|---|---|---|---|---|
| Subprime | 15.2 | 16.9 | 10.4 | 24 |
| Near Prime | 2.6 | 28.5 | 2.5 | 31.6 |
| Prime | 0.3 | 54.6 | 0.4 | 44.4 |
| Memo: Overall Delinquency Rate | 3.5 | 3.5 | ||
Source: Federal Reserve Bank of New York Consumer Credit Panel/Equifax.
Table 2 shows impact of the counterfactual assignment for credit cards in 2023:Q3. The overall delinquency rate for both scenarios is 3.5 percent, while the subprime delinquency rate is 5 percentage points lower in the counterfactual rate scenario.
Table 2: Credit Cards: Actual and Counterfactual Delinquency Rates and Shares, 2023:Q3 (percent)
| Actual Delinquency Rate | Actual Share of Total Balances | Counterfactual Delinquency Rate | Counterfactual Share of Total Balances | |
|---|---|---|---|---|
| Subprime | 15.4 | 8.2 | 9.5 | 13.3 |
| Near Prime | 5.3 | 30.6 | 4.4 | 34.2 |
| Prime | 1 | 61.2 | 1.4 | 52.4 |
| Memo: Overall Delinquency Rate | 3.5 | 3.5 | ||
Source: Federal Reserve Bank of New York Consumer Credit Panel/Equifax.
We plot the evolution of rates over time in Figure 4. The figures show that subprime delinquency rates for both credit cards and auto loans would be much lower.
Figure 4. After adjusting for credit score migration, subprime delinquency rate increases are more muted
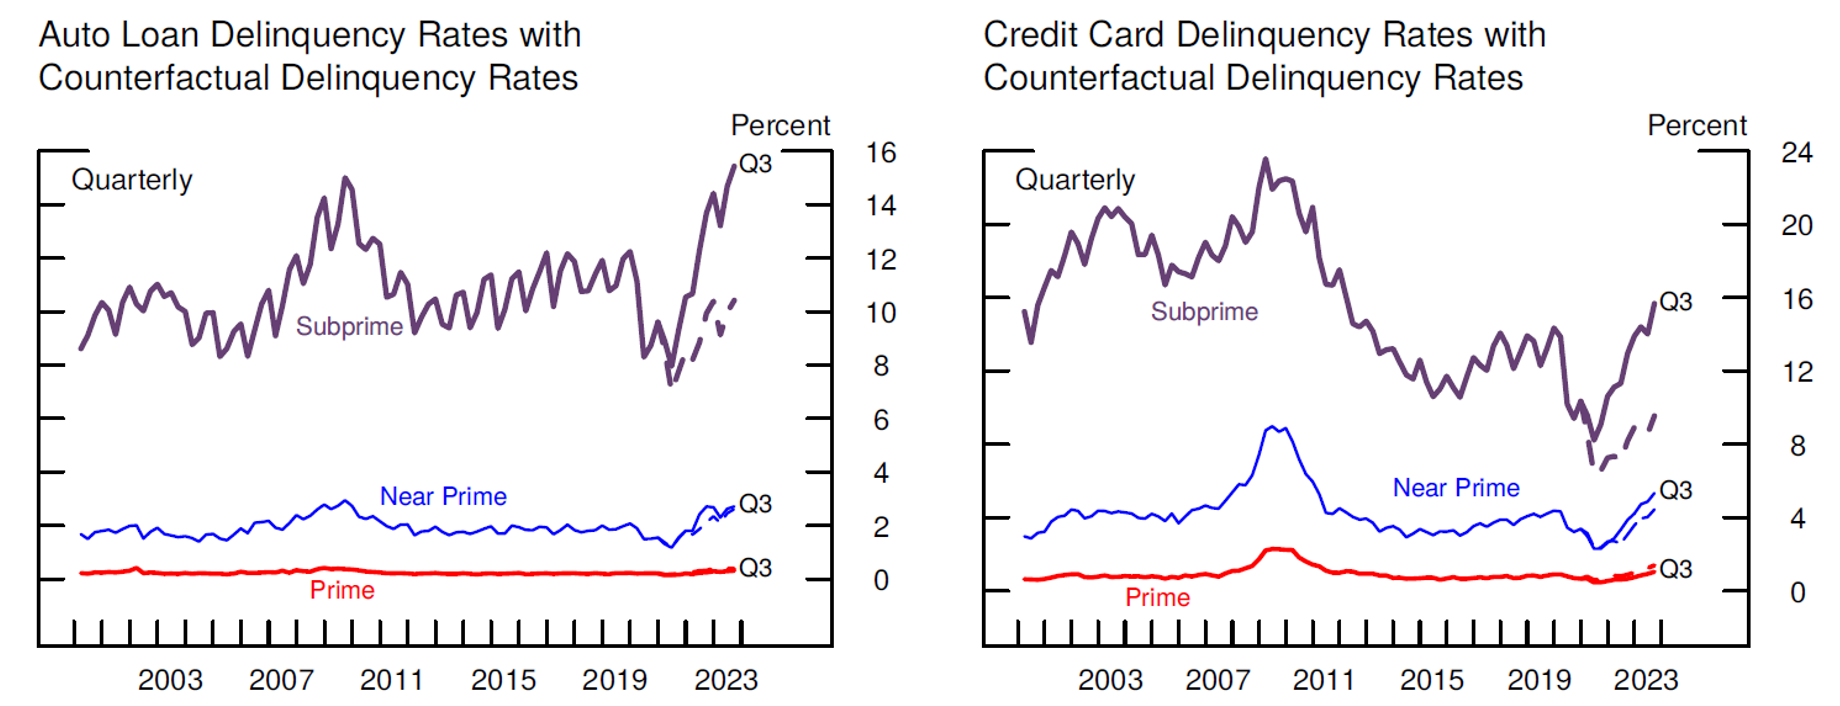
Note: Delinquency is at least 30 days past due, excluding severely derogatory loans. Prime refers to credit scores above 719, near prime between 620 and 719, and subprime below 620. Credit scores are lagged four quarters. Dashed line shows delinquency rates holding credit score distribution fixed as of 2019:Q4.
Source: Federal Reserve Bank of New York Consumer Credit Panel/Equifax.
Conclusion
Delinquency rates for auto and credit card loans have more than reversed the declines seen during the early stage of the pandemic, and for subprime consumer loans, especially auto loans, are at especially elevated levels. This note has shown how much of the subprime rise is attributable to credit score migration. A counterfactual exercise that holds fixed for each consumer her or his credit score as of 2019:Q4 shows subprime delinquency rates that are both considerably lower and exhibited more muted increases over the past few years.
Because so much of the increase in subprime delinquency rates owes to this migration, the large increases in these rates should not be used as a sole indicator of deteriorating credit quality. At the same time, the analysis in this note is not intended to create a new subprime delinquency rate, since it neither accounts for derogatory factors that might move borrowers down into subprime status, nor does it allow for secular changes in borrower shares over credit score bins.
References:
Goodman, Sarena, Geng Li, Alvaro Mezza, and Lucas Nathe (2021). "Developments in the Credit Score Distribution over 2020," FEDS Notes. Washington: Board of Governors of the Federal Reserve System, April 30, 2021, https://doi.org/10.17016/2380-7172.2902.
1. We thank Vitaly Bord and Haja Sannoh for the analysis in Figure 3. Return to text
2. Severely derogatory balances—those for which delinquent status is accompanied by a foreclosure, repossession, or charge-off—are excluded in the analysis, as they may reflect delinquencies accrued many years ago. Return to text
3. For simplicity, we drop those borrowers who were not in the CCP/Equifax sample in 2019:Q4 or did not have an existing credit score at that time. Return to text
Driscoll, John C., Jessica N. Flagg, Bradley Katcher, and Kamila Sommer (2024). "The Effects of Credit Score Migration on Subprime Auto Loan and Credit Card Delinquencies," FEDS Notes. Washington: Board of Governors of the Federal Reserve System, January 12, 2024, https://doi.org/10.17016/2380-7172.3419.
Disclaimer: FEDS Notes are articles in which Board staff offer their own views and present analysis on a range of topics in economics and finance. These articles are shorter and less technically oriented than FEDS Working Papers and IFDP papers.