FEDS Notes
August 30, 2024
The interaction of bank leverage, interest rate risk, and runnable funding
Shawn Kimble and Matthew P. Seay1
Summary
Silicon Valley Bank (SVB), Signature Bank, First Republic Bank (FRC) had too little useable liquidity relative to their runnable funding and too little capital given the magnitude of their interest rate risk. The mismanagement of these vulnerabilities ultimately contributed to a loss of confidence in their business models. While SVB, Signature, and FRC were outliers, we analyze the build-up of fragilities in the banking system that preceded their failures.
In this Note, we introduce a measure called lower friction liquidity (LFL). LFL is the ratio of liquid, useable assets (cash and useable available-for-sale (AFS) securities) to runnable liabilities (uninsured deposits and short-term wholesale funding (STWF)). Useable AFS is defined as the maximum amount of AFS a firm can liquidate to meet outflows without breaching its total common equity tier 1 (CET1) ratio requirement. We also construct market-adjusted common equity tier 1 (MACET1) ratios to account for unrealized fair value losses on all bank securities and loans in bank capital ratios. We use these two measures to analyze the interaction of banks' liquidity and solvency risks.
While there is no perfect measure of bank capital or liquidity, LFL captures banks' capacity to meet outflows using assets that are easily convertible to cash while maintaining regulatory capital requirements. It assumes severe financial conditions, similar to those that prevailed during the spring of 2023, in which vulnerable banks cannot rely on funding markets to shore up their cash positions and are unable to raise equity.
In this Note, we decompose the subcomponents of LFL ratios and show that in the year leading up to the failure of SVB, banks with lower LFL ratios shed more cash than their peers and retained fewer AFS securities, despite a comparable build in uninsured deposits. Following the failure of SVB, banks with low LFL ratios had worse stock price returns than their peers – suggesting that markets overlooked this interaction of vulnerabilities until the firm failed. In addition, firms with low LFL ratios displayed less ability to retain their uninsured depositors following SVB's collapse, despite significantly boosting their useable, liquid asset positions.
Our analysis highlights that firms in the bottom quartile of the LFL ratio distribution could cover just one-third of their runnable funding by selling their most useable, liquid assets. In general, large fair value losses can impair the usability of high duration liquid assets should funding stress emerge.2 For the subset of otherwise solvent institutions with viable business models but too little useable liquidity, discount window readiness or access to contingent liquidity facilities could provide balance sheet flexibility and delay or mitigate potential bank failures and contagion.3 For the subset of firms that operate with sufficient liquidity but elevated interest rate risk, more capital could also help stave-off a run equilibrium.4
Limited ability to sell assets without depleting capital
Fragilities began to build in the banking system several years prior to SVB's collapse. From 2020 to 2022, banks invested heavily in longer-maturity securities and loans (figure 1, left). At the time, yields on these assets were low relative to current levels, but offered a premium relative to short-term investments. Higher reliance on longer-maturity assets left some banks' capital positions increasingly vulnerable to higher long-term yields. That vulnerability manifested during 2022, when inflation unexpectedly rose, which corresponded with a large rise in long-term yields, and led to substantial reductions in the fair value of fixed-rated bank loans and securities.
To illustrate the impact of these unrealized losses on banks' regulatory capital, we construct MACET1 ratios. The MACET1 ratio is a non-regulatory risk-based measure of capital that accounts for fair value losses of all securities and loans.5 MACET1 ratios illustrate that bank capital would be significantly depleted in an extreme scenario where fair value losses are realized (figure 1, right).6
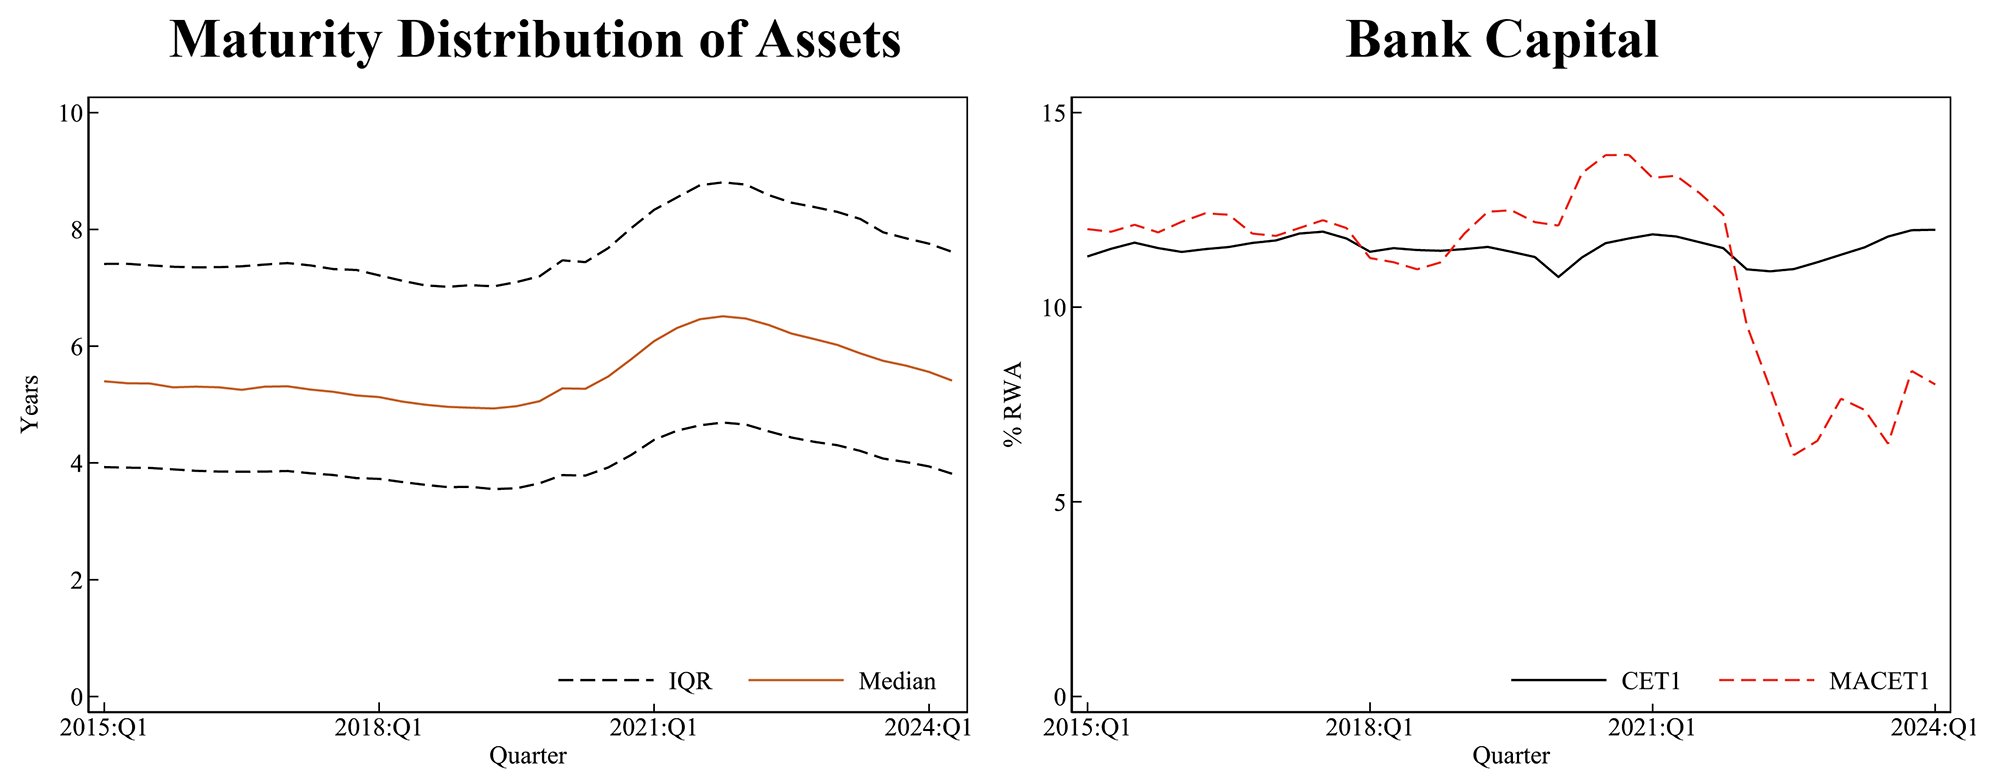
Note: Left panel is an approximation of the repricing and maturity distribution of bank assets through time. The distribution is based on estimates of individual bank's asset maturity, which are constructed by balance-weighting the midpoint of each repricing and maturity bucket from the distribution loans and securities in Call Reports. Right panel includes most publicly-traded banks, which represent about two-thirds of banking system assets. MACET1 ratios are equal to CET1 ratios less fair value losses on all securities and loans. Securities fair value losses are sourced from FR Y-9C and Call Reports. Loan fair value losses are sourced from S&P Global Capital IQ Pro.
Source: FR Y-9C, Call Reports, S&P Global Capital IQ Pro, Author Calculations.
Imbalance of runnable funding and useable, liquid assets
Uninsured deposits increased substantially as the federal response to the pandemic made its way into the banking system during 2020. At an aggregate level, this growth of runnable funding was mostly matched with higher cash positions (including reserves) and larger holdings of AFS through 2021 (figure 2). As the pandemic waned and the Fed tightened monetary policy, the quantity of reserves in the banking system shrank. In addition, some banks reduced their AFS portfolios, despite maintaining a high reliance on uninsured deposits. This imbalance of runnable funding relative to useable, liquid assets peaked during the second half of 2022 and left a subset of banks less equipped to meet deposit outflows without either increasing reliance on repo market depth, turning to other funding sources such as Federal Home Loan Banks (FHLBs), or using the discount window (DW).7
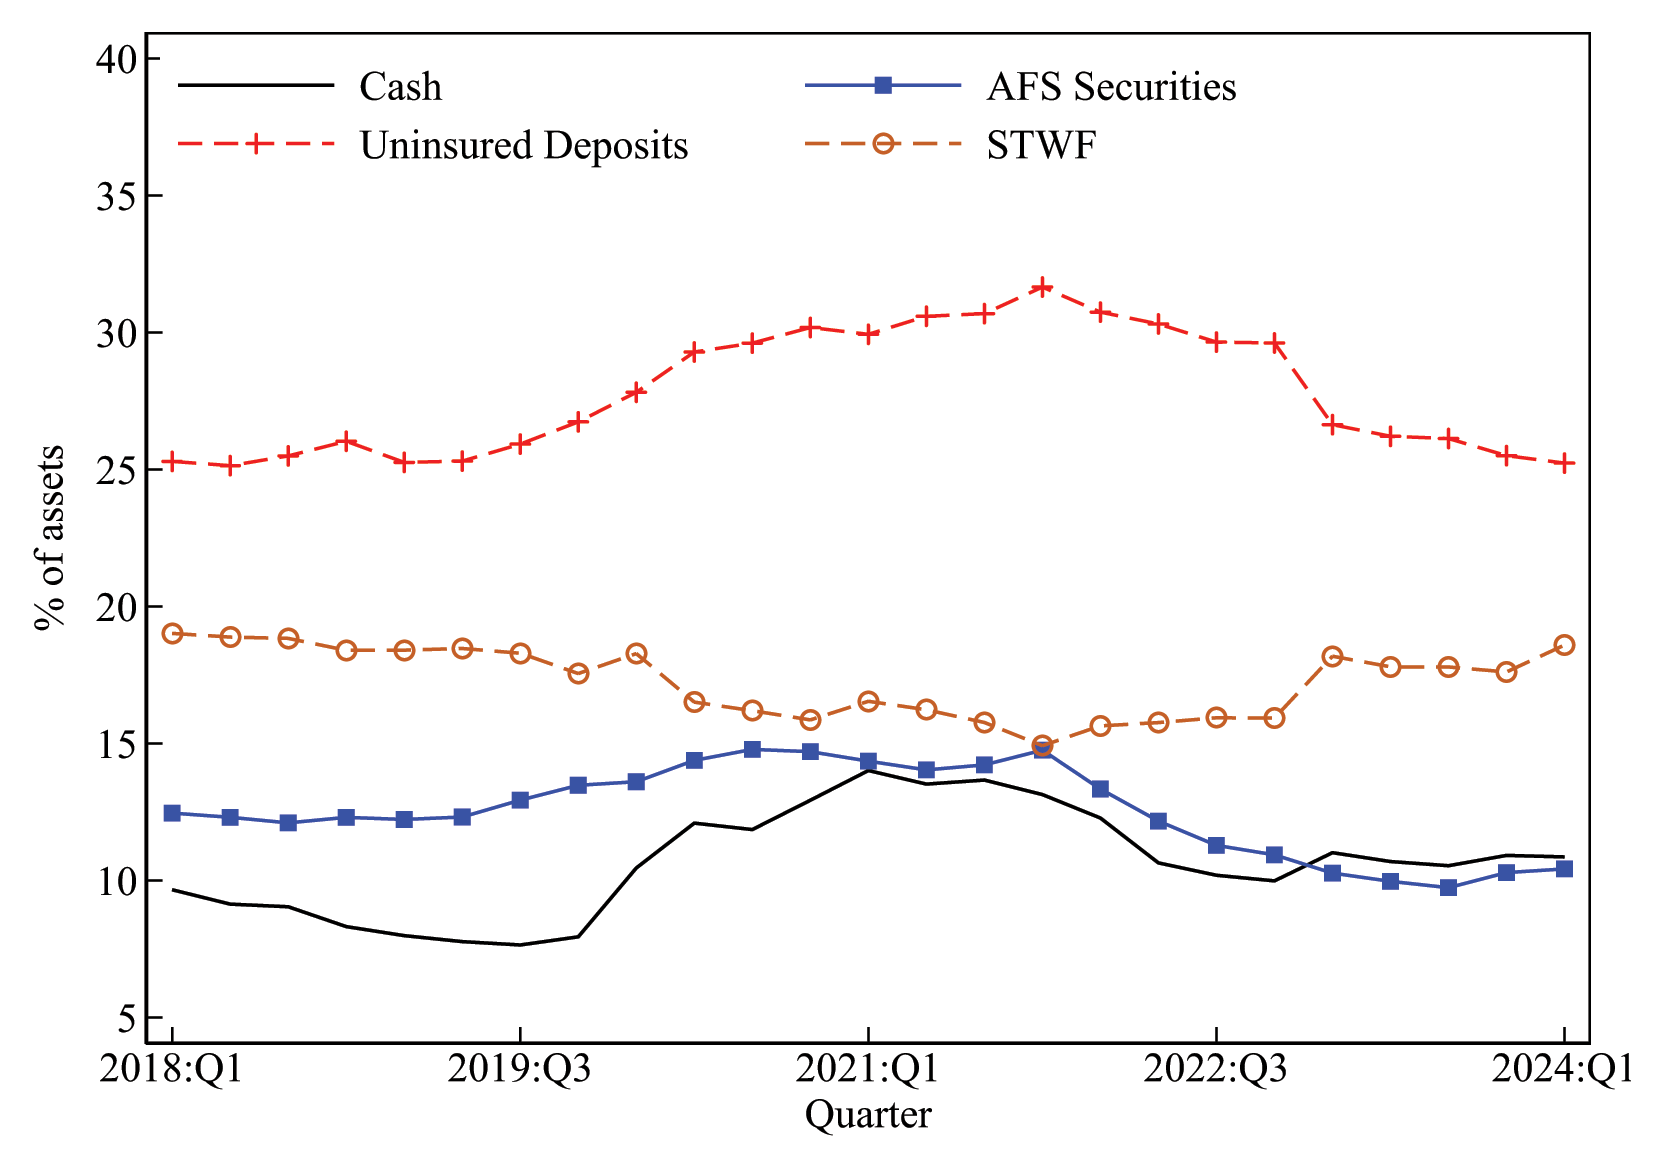
Note: Includes all banks with at least $1 billion in assets.
Source: FR Y-9C and Call Reports.
Lower friction liquidity: the interaction of runnable funding, interest rate risk, and leverage
While many firms had sufficient asset-liquidity to meet the runnability of their liability base, some banks failed to correct this imbalance and adequately manage the interaction of their risks. LFL ratios provide one way to analyze bank resiliency based on the interaction of a bank's liquidity, interest rate risk, and capital positions. Banks with lower LFL ratios have less liquidity immediately available to manage higher cash demand from their depositors and short-term lenders without increasing borrowings and have less flexibility to shrink their balance sheets without raising more capital.8
More formally, LFL is the ratio of banks' useable, liquid assets to their runnable liabilities. We define useable, liquid assets as cash (including reserves) and useable AFS, where useable AFS is the maximum amount of AFS securities a firm can liquidate to meet outflows without breaching its total CET1 capital requirement.9 We assume that banks sell each dollar of securities at a loss rate equivalent to the average fair value decline of the AFS portfolio.10 , 11
Runnable liabilities – the denominator of LFL ratios – are the sum of uninsured deposits and short-term wholesale funding (STWF), where STWF is the sum of federal funds borrowing, repurchase agreements, foreign deposits, trading liabilities, other borrowings with a remaining maturity < 1-year, commercial paper, and long-term debt scheduled to mature < 1-year. The measure assumes a system-wide run. Under this extreme assumption, banks have no ability to retain their uninsured deposits.
The left panel of figure 3 shows that banks' ability to meet runnable funding outflows – as measured by LFL ratios – rose gradually during 2018 to 2019. During the early stages of the pandemic, LFL ratios were bolstered by significant holdings of AFS securities and reserves. LFL ratios declined materially during 2022, as uninsured deposits remained fairly sticky while cash and reserve positions declined as the Fed tightened, and securities portfolios shifted toward held-to-maturity. This imbalance is demonstrated by the leftward shift in the distribution of firms' LFL ratios, as shown in the right panel of figure 3.
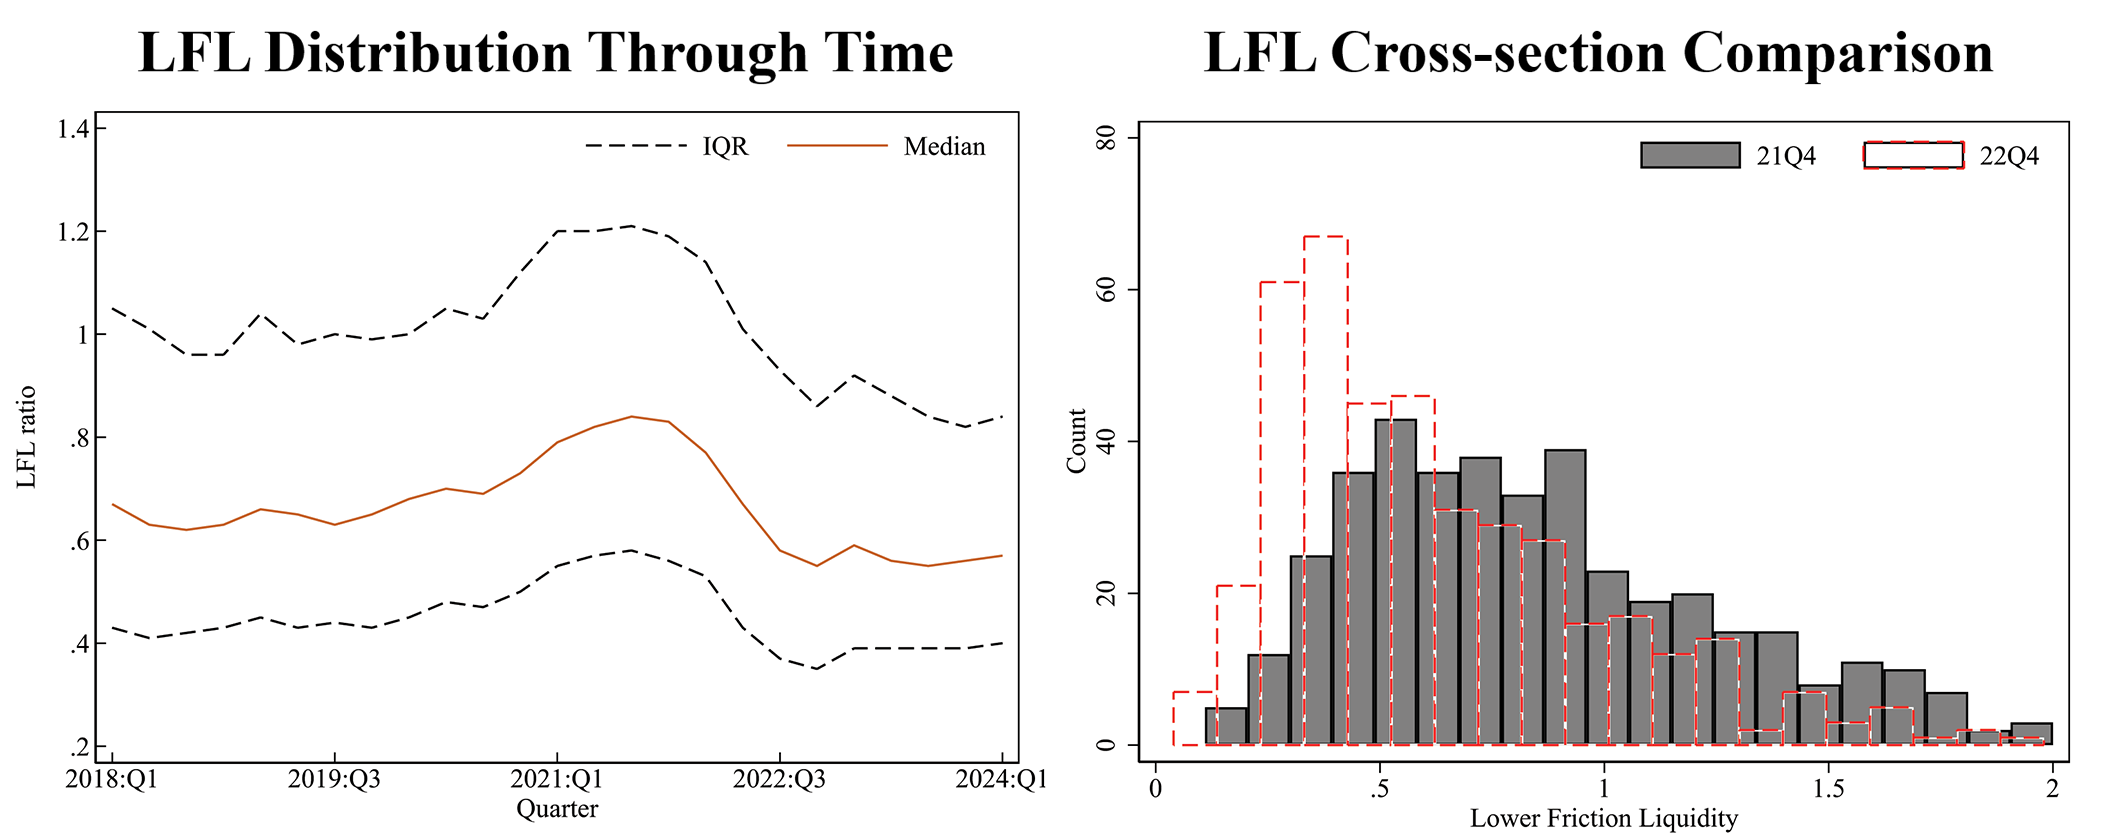
Note: LFL is the ratio of cash and useable AFS securities to uninsured deposits and other runnable funding. Both charts include panel of banks with at least $1 billion in assets. The right panel is trimmed to show banks with LFL ratios less than 2.
Source: FR Y-9C, Call Reports, and Author calculations.
How did runnable funding and liquidity evolve before and after the failure of SVB?
We next analyze how each of the LFL components (cash, useable AFS, uninsured deposits, and STWF) contributed to changes in banks' LFL ratios. We group banks into two categories based on the level of their LFL ratios as of 2022:Q4. Banks with LFL ratios less than 0.33 – roughly the bottom quartile of the distribution at that time – are grouped in the low LFL group, and all other banks are grouped in the high LFL group. We drop failed banks and exclude GSIBs.12 We then create virtual, aggregate banks to represent the high and low LFL bank groups. We sum the data at the LFL component level each quarter across the individual banks in the group, and then create a single quarterly LFL measure from those aggregated data. This approach allows us to calculate percentage-point contributions to the quarterly change in each bank group's aggregate LFL ratio from each of our four LFL components and contrast how their positions evolved. On a quarterly basis, the four contribution amounts sum to the total change in our LFL measure. Figure 4 plots the contribution of each of our four components for each quarter. Data for the low LFL bank group are shown in the left panel, and those for the high LFL bank group are shown in the right panel.
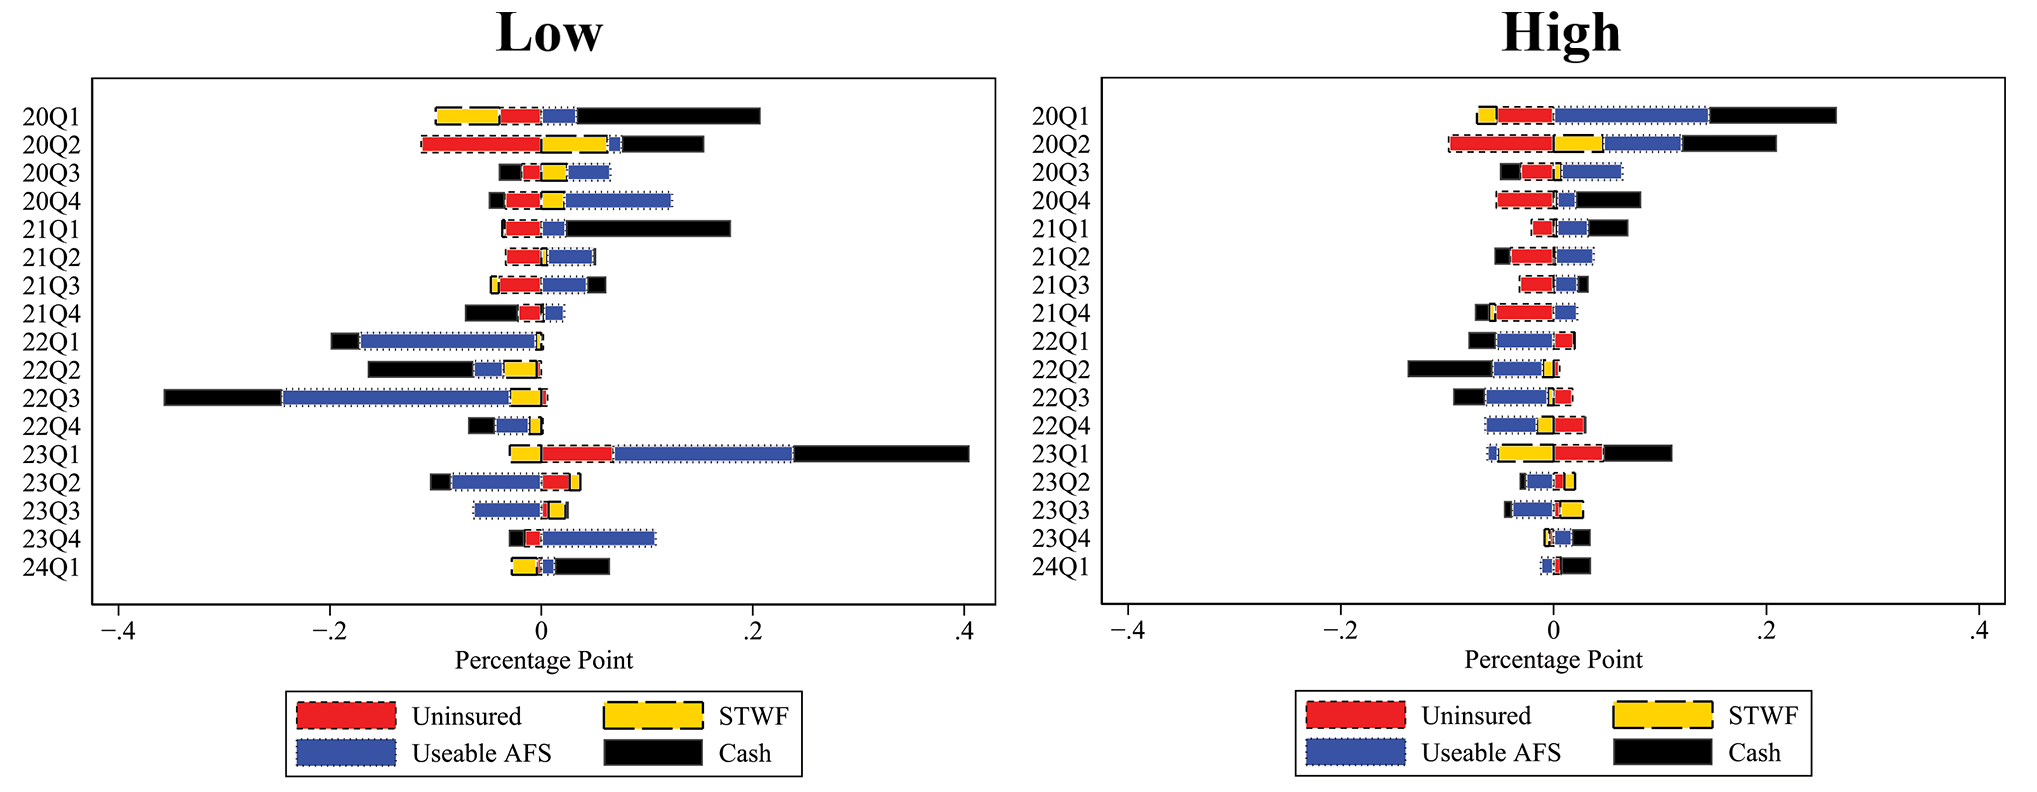
Note: Includes balanced panel of banks with at least $1 billion in assets excluding GSIBs.
Source: FR Y-9C, Call Reports, and Author calculations.
The figures show the large influx of uninsured deposits across low and high LFL bank groups during 2020 and early 2021. During this time, both high and low LFL banks largely matched inflows of uninsured deposits with cash and AFS securities. Beginning in late 2021 and through 2022, low LFL banks shed significantly more cash and AFS securities despite maintaining high levels of uninsured deposits, which led to a material reduction in their ability to meet outflows. In contrast, firms with healthier LFL ratios maintained more of their useable liquidity through 2022. After SVB's failure, low LFL banks shored up significantly more liquidity by increasing their cash positions and moving toward AFS securities.13
When did markets price the interaction of interest rate risk and runnable funding?
While the largest banks are subject to more stringent regulatory requirements, such as the GSIB surcharge or the liquidity coverage ratio, any firm that severely mismanages its interest rate risk or funding positions, or their interaction, may face market discipline or heightened attention from depositors.
Figure 5 plots the simple average of cumulative stock price returns for low LFL banks (LFL ratio < .33) and all other firms (LFL ratios > .33). The chart suggests markets priced the interaction of vulnerabilities captured by low LFL ratios after the failure of SVB.14 Furthermore, the similar cumulative returns across both bank groups before the failure of SVB suggest evidence of parallel trends.
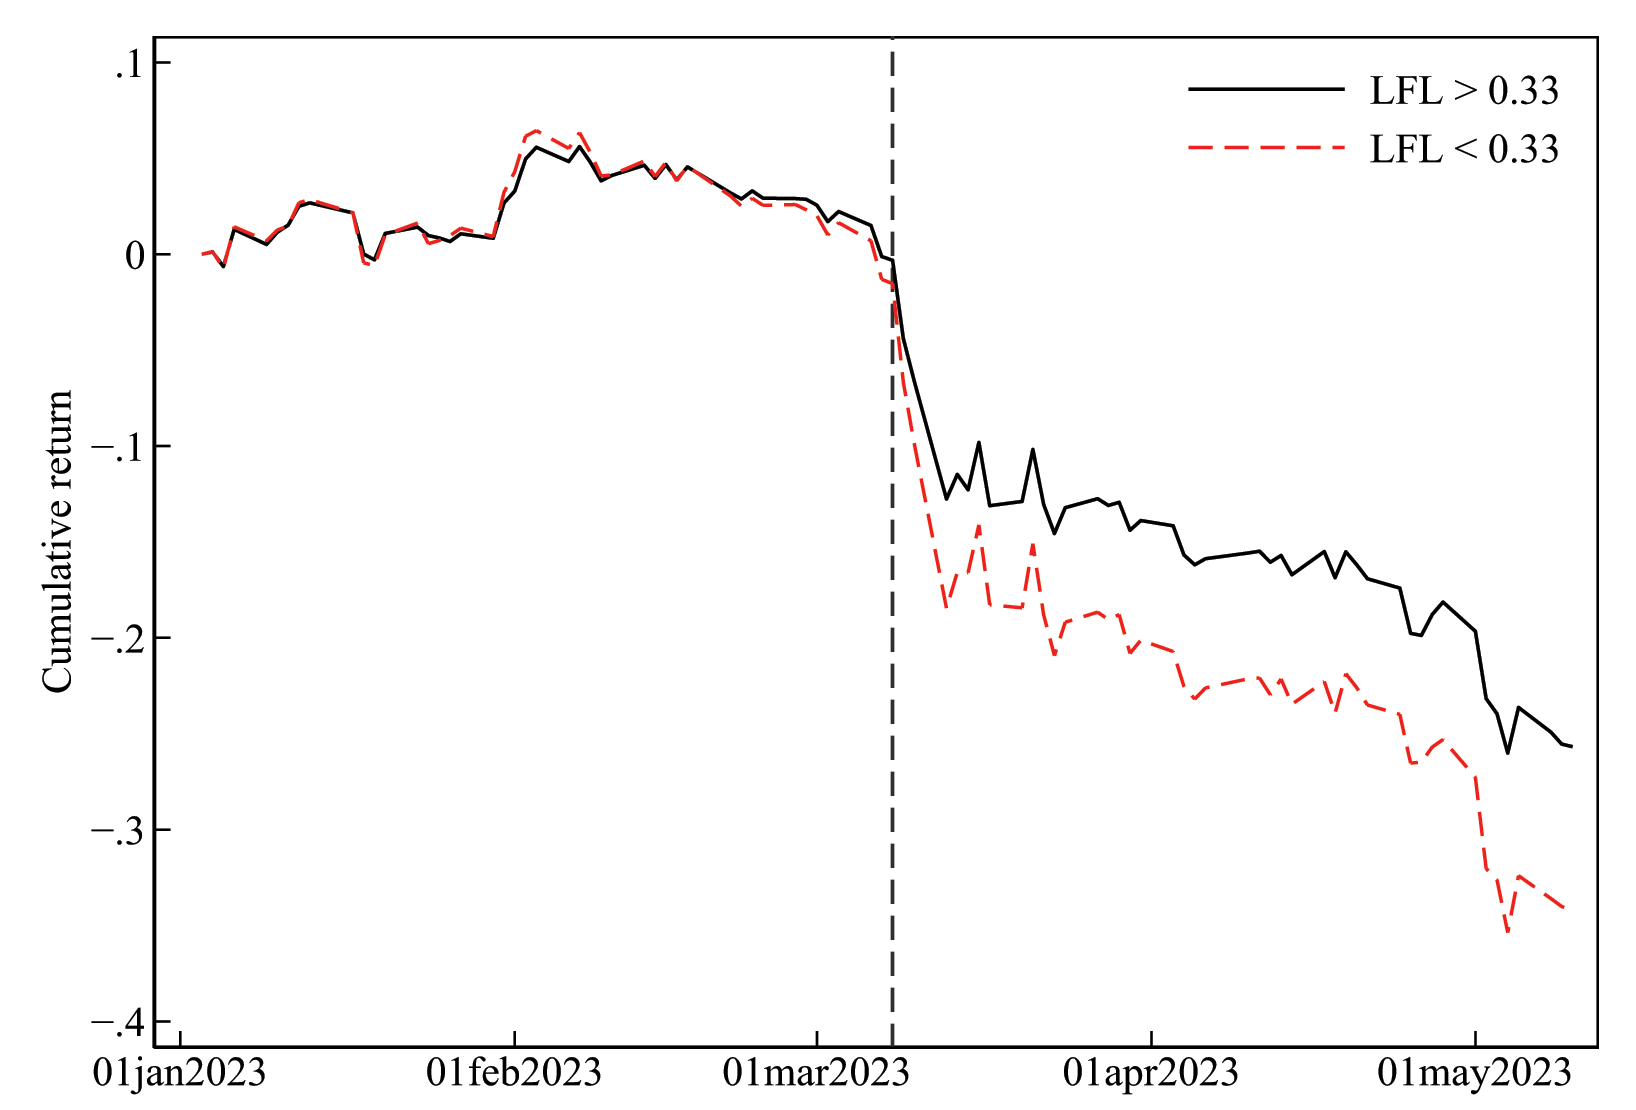
Note: LFL is the ratio of cash and useable AFS securities to uninsured deposits and other runnable funding. Chart shows the simple average of cumulative returns by LFL grouping. Sample includes 293 publicly traded banks.
Source: FR Y-9C, Call Reports, S&P Global Market Intelligence, and Author Calculations..
We use cross-sectional analysis to explore this more formally. We assume market participants are informed by the latest available balance sheet information at the time of SVB's failure and use 2022:Q4 balance sheets to identify banks with similar vulnerabilities.15 Table 1 shows cumulative returns from March 8th to May 31st regressed on several vulnerability measures. The main variable of interest that separates the treatment and control in our specifications is a dummy variable which takes the value of 1 if a firm has a LFL ratio below 0.33 (within the bottom quartile of the distribution). Column (1) shows that banks with ex-ante vulnerability, with low LFL ratios as of 2022:Q4, underperformed their peers after the failure of SVB. In Column (2) we add two additional controls related to interest rate risk and runnable funding. We add a dummy variable set equal to 1 for firms with MACET1 ratios less than their total CET1 requirement. This control is designed to capture firms that may need to raise equity to cover interest rate risk stemming from securities and loans (FV losses) in the event of a severe bank run. We add a separate control for runnable funding using a dummy variable equal to 1 for firms with above-average reliance on uninsured deposits. Our findings suggest that low LFL ratios are associated with worse stock price performance after SVB's failure, above what can be gleaned from interest rate risk and runnable funding individually.
Column (3) includes a dummy variable for firms with MACET1 ratios less than 4.5 percent. Banks with CET1 ratios less than 4.5 percent are considered undercapitalized by PCA standards. While MACET1 is not a regulatory capital measure, we apply the 4.5 percent as a solvency threshold to identify potentially vulnerable banks with too little capital relative to their interest rate risk and its interaction with above-average reliance on uninsured deposits. Our results are robust to these controls. Stock prices of banks with low LFL ratios underperformed their peers by 6.7 percentage points on average after the failure of SVB, as shown in Column (3) of table 1. This suggests market participants may have weighed banks' ability to meet deposit outflows in the short-term, and the interaction of solvency and runnable funding, similarly.
Table 1: Cumulative returns by LFL group
| (1) | (2) | (3) | |
|---|---|---|---|
| LFL Ratio < Bottom quartile | -0.077*** | -0.067*** | -0.067*** |
| (0.015) | (0.016) | (0.015) | |
| MACET1 Ratio < Total CET1 Req. | -0.059*** | -0.049*** | |
| (0.013) | (0.014) | ||
| Uninsured Reliance > Avg. | -0.021 | -0.010 | |
| (0.014) | (0.015) | ||
| MACET1 Ratio < 4.5 | 0.002 | ||
| (0.035) | |||
| Uninsured Reliance > Avg. & MACET1 Ratio < 4.5 | -0.069* | ||
| (0.039) | |||
| Obs. | 296 | 296 | 296 |
| Adj. R-squared | 0.073 | 0.138 | 0.153 |
| Fixed effects | No | No | No |
Note: Cumulative bank stock price returns are the outcome variable. All control variables use balance sheet data as of 2023:Q4. LFL is the ratio of cash and useable AFS securities to uninsured deposits and other runnable funding. Banks with LFL ratios below 0.33 are in the bottom quartile of the LFL ratio distribution. MACET1 ratios incorporate fair value losses for all securities and loans on bank CET1 ratios. Total CET1 requirements are based on individual bank capital requirements for stress tested firms. For all others, we assume a total CET1 requirement of 7 percent. The sample excludes failed banks and GSIBs. Cumulative returns are calculated from March 8th to May 31st, 2023. Results are shown with robust standard errors. Significance: * p < 0.1, ** p < 0.05, *** p < 0.01.
Source: FR Y-9C, Call Reports, and S&P Global Capital IQ Pro.
Did banks with larger imbalances of liquid assets to runnable funding have bigger uninsured deposit outflows?
Next, using similar cross-sectional analysis, we test whether banks with LFL ratios < 0.33 experienced larger uninsured deposit outflows relative to their peers following the SVB shock.16
We find that banks with low LFL ratios had roughly 8.2 percentage points less average quarterly uninsured deposit growth than their peers after the failure of SVB (Table 2, Column 1). Further, we show in Columns (2) and (3) that our uninsured deposit growth estimate is still economically and statistically significant after controlling for above-average reliance on uninsured deposits and MACET1 ratios less than 4.5 percent. These findings are consistent with the hypothesis that banks with an unmatched reliance on uninsured deposits (captured via lower LFL ratios, all else held equal), are likely to have greater difficulty in maintaining or attracting a stable deposit base.
Table 2: Uninsured deposit growth by LFL group
| (1) | (2) | (3) | |
|---|---|---|---|
| LFL Ratio < Bottom quartile | -0.082*** | -0.055*** | -0.055*** |
| (0.011) | (0.010) | (0.010) | |
| Uninsured Reliance > Avg. | -0.098*** | -0.105*** | |
| (0.012) | (0.015) | ||
| MACET1 Ratio < 4.5 | -0.030 | ||
| (0.026) | |||
| Uninsured Reliance > Avg. # MACET1 Ratio < 4.5 | 0.022 | ||
| (0.027) | |||
| Obs. | 733 | 733 | 733 |
| Adj. R-squared | 0.027 | 0.094 | 0.095 |
| Fixed effects | No | No | No |
Note: Average quarterly change in uninsured deposits from 2022:Q4 through 2023:Q2 is the outcome variable. All control variables use balance sheet data as of 2022:Q4. LFL is the ratio of cash and useable AFS securities to uninsured deposits and other runnable funding. Banks with low LFL ratios are defined as those with LFL ratios below 0.33 as of 2022:Q4. Deposit growth is winsorized at the 99th percentile. Excludes GSIBs and failed banks. Results are shown with robust standard errors. Significance: * p < 0.1, ** p < 0.05, *** p < 0.01.
Source: FR Y-9C, Call Reports, and S&P Global Capital IQ Pro.
Conclusion
In this note we introduce a new measure called lower friction liquidity (LFL), which is the ratio of a banks' most useable, liquid assets to their most runnable liabilities. LFL ratios provide a way to highlight banks that have less ability to meet outflows of runnable funding based on their liquidity positions, interest rate risk, and capital positions. We provide some evidence that markets overlooked the interaction of these vulnerabilities until SVB failed. We also share some preliminary evidence that suggests banks with low LFL ratios had less ability to retain their uninsured deposits post-SVB, relative to their peers.
It is unlikely that the next set of bank failures will look like the last. However, our work suggests that otherwise solvent institutions with viable business models could better position their balance sheet to meet larger and faster outflows without significantly depleting their capital. Examples of such strategies include discount window readiness and access to other liquidity facilities. For firms with elevated interest rate risk but sufficient liquidity, more capital could also help prevent a run equilibrium.
References
Board of Governors of the Federal Reserve System (2023). Review of the Federal Reserve's Supervision and Regulation of Silicon Valley Bank (PDF). Washington: Board of Governors, April.
Caglio, Cecilia, Jennifer Dlugosz, and Marcelo Rezende. "Flight to safety in the regional bank crisis of 2023." Available at SSRN 4457140 (2023).
Choi, Dong Beom, Paul Goldsmith-Pinkham, and Tanju Yorulmazer. Contagion effects of the silicon valley bank run. No. w31772. National Bureau of Economic Research, 2023.
Cipriani, Marco, Thomas M. Eisenbach, and Anna Kovner. "Tracing Bank Runs in Real Time." FRB of New York Staff Report 1104 (2024).
Drechsler, Itamar, et al. "Banking on uninsured deposits." Available at SSRN 4411127 (2023).
Fischl-Lanzoni, Natalia, et al. "Investor Attention to Bank Risk During the Spring 2023 Bank Run." FRB of New York Staff Report 1095 (2024).
Flannery, Mark J., and Sorin M. Sorescu. "Partial effects of fed tightening on us banks' capital." Available at SSRN 4424139 (2023).
Glancy, David, et al. "The 2023 Banking Turmoil and the Bank Term Funding Program." (2024).
Haddad, Valentin, Barney Hartman-Glaser, and Tyler Muir. "Bank fragility when depositors are the asset." Available at SSRN 4412256 (2023).
Jiang, Erica Xuewei, et al. "Monetary tightening and US bank fragility in 2023: Mark-to-market losses and uninsured depositor runs?." Journal of Financial Economics 159 (2024): 103899.
Metrick, Andrew. "The failure of silicon valley bank and the panic of 2023." Journal of Economic Perspectives 38.1 (2024): 133-152.
1. Seay and Kimble are staff in the Division of Financial Stability at the Federal Reserve Board. The views in this Note are solely those of the authors and should not be interpreted as reflecting the views of the Board of Governors of the Federal Reserve System. We thank William Bassett, Skander Van den Heuvel, Chase Ross, Nathan Swem, Cindy Vojtech, and Phillip Weed for their helpful comments. Return to text
2. Agency mortgage-backed securities (MBS) are an example of a high duration, high quality liquid asset (HQLA). MBS are recorded at fair value in the liquidity coverage ratio, but if they are booked as held-to-maturity securities, fluctuations in their fair values have no impact on regulatory capital, as long as they are not sold. However, large declines in the fair value of securities can become a concern for banks facing liquidity pressures, in the event that they are forced to sell the securities and realize fair value losses. Selling HTM securities "taints" the entire portfolio and can weigh significantly on bank capital. Return to text
3. A diverse funding base can reduce the likelihood and severity of future deposit runs. For example, shifting business models toward less reliance on individual depositors with outsized deposit balances and toward diverse deposits across several industries are actions consistent with a more resilient funding model. Return to text
4. For further discussion on run rate equilibriums in an environment with rising rates see Drechsler et al. (2023), Haddad et al. (2023), Jiang et al. (2023). Return to text
5. See Flannery and Sorescu (2023) for additional estimates of fair value losses and their impact on bank capital for all call report filers. Return to text
6. All banks' regulatory capital positions are exempt from fair value losses on HTM securities and loans. MACET1 ratios do not adjust for the fair value of liabilities, which can also decrease as yields rise. For additional detail on how the value of deposits can change as yields rise, see Drechsler, Savov, Schnabel, and Wang (2023). Return to text
7. Banks pledge securities and loans to shore up liquidity. FR Y-9C or Call Reports contain total securities pledged, but do not provide a split of AFS and HTM pledged securities. Thus, for any bank that pledges AFS securities, LFL may overstate liquidity. Return to text
8. Consider the extreme case of SVB. Its deposit base was almost entirely uninsured, and it had invested heavily in high duration securities prior to the large increase in long-term yields, which left its market-adjusted equity negative in 2022. The firm failed after it announced a surprise capital raise of about $2 billion to cover losses that it had realized to meet the higher cash demand of its depositors. Tapping its HTM portfolio would exacerbate solvency concerns, and it was unprepared to secure additional borrowings quickly. Its failure demonstrated that interest rate risk mismanagement can severely limit the usability of high-quality assets – either by monetization or by selling outright. SVB had an LFL ratio of about 0.20 in the quarter prior to its failure, implying that it could cover just 20 percent of its runnable funding by liquidating cash and AFS securities. Similarly, FRC's LFL ratio was about 0.05 during 2022:Q4 – putting it in the bottom percentile of the LFL distribution. See Barr (2023) and Metrick (2023) for further details on SVB's failure. Return to text
9. All GSIBs can sell their entire AFS portfolios without breaching their capital requirements. GSIBs and other large banks have access to other sources of liquidity, such as their trading book, which enhances their liquidity positions beyond what is explored in this note. Return to text
10. Banks may loss minimize if they are forced sell a large portion of their securities holdings. Opaque data limit our ability to calculate LFL ratios with liquidation ordering, as Call Report data do not contain detailed information on the maturity distribution of unencumbered securities by security type. Return to text
11. During 2022:Q4, most firms could liquidate their entire AFS portfolio without breaching their total CET1 requirements. For the small set that could not, we maximize AFS sales by setting post-stress CET1 ratios equal to individual banks' total CET1 requirements. About one-fourth of banks would fall below their total CET1 requirements in the extreme scenario where they are forced to realize fair value losses on their HTM portfolios. Return to text
12. Caglio et al. (2023) show large banks' deposits increased after the failure of SVB, beyond what can be explained by reliance on uninsured deposits and fair value losses on securities. In addition, we exclude large banks' as they have additional levers to manage their liquidity that are not reflected in LFL ratios. Return to text
13. Cipriani et al. (2024) show that banks that endured runs bolstered their cash positions by increasing borrowings shortly after SVB's failure. Glancy et al. (2024) provide some evidence that banks that borrowed from the bank-term funding program had higher reliance on uninsured deposits and larger securities fair value losses on average. Return to text
14. Choi et al. (2023) highlight that investors appeared to price reliance on uninsured deposits, but not the realization of fair value losses, prior to the failure of SVB. Fischl-Lanzoni et al. (2024) also explore how investor attention on uninsured deposits and unrealized losses shifted after the run on SVB started. Return to text
15. There is roughly a 6-week lag separating quarter-end and the release of FR Y-9C and Call Report information. This would date the release of 2023 Q1 balance sheet information around the middle of May. Our sample ends May 31st. Return to text
16. We are interested in whether depositors were 'awakened' to these risks following SVB's failure. We focus on quantities rather than deposit pricing as presumably the decision faced by depositors' sudden concern for credit risk or loss of confidence, can be characterized as a binary decision between staying or fleeing, independent of the renumeration rate. Return to text
Seay, Matthew P., and Shawn M. Kimble (2024). "The interaction of bank leverage, interest rate risk, and runnable funding," FEDS Notes. Washington: Board of Governors of the Federal Reserve System, August 30, 2024, https://doi.org/10.17016/2380-7172.3605.
Disclaimer: FEDS Notes are articles in which Board staff offer their own views and present analysis on a range of topics in economics and finance. These articles are shorter and less technically oriented than FEDS Working Papers and IFDP papers.