FEDS Notes
April 24, 2025
Tracking consumer sentiment versus how consumers are doing based on verified retail purchases
Sinem Hacıoğlu Hoke, Leo Feler, Samantha Mitchell, and Jack Chylak1
Despite low unemployment, moderating inflation and anchored inflation expectations, and rising incomes since mid-2022, surveys at the end of 2024 continued to report that consumer sentiment remained unusually low, below levels at the onset of the pandemic and on par with levels during the Great Financial Crisis. Why was there this discrepancy between consumer sentiment and the real economy?
This note summarizes the results of a household survey that aims to understand how changes in household incomes and spending between 2019 and 2024 and how behavioral changes households made to adapt to the economic environment shaped their economic sentiment. It includes nearly 10,000 representative panelists' responses to various questions collected over two waves in October and November 2024.2 Using micro spending data, we link survey responses to respondents' total annual spending to gauge how actual spending and household-specific price levels for everyday retail purchases changed between 2019 and 2024. Being able to connect sentiment with verified spending is a novel contribution, above and beyond previous studies that explored economic sentiment in the post-pandemic period.
Our results indicate that:
- The more people thought the prices they paid rose faster than their incomes, the worse they said they were doing.
- Consumers were more likely to overestimate than to underestimate the inflation they experienced. Those consumers who overestimated their verified inflation said they felt worse about economic conditions.
- Most respondents reported higher household incomes in 2024 versus 2019 but still said they did not feel good about the economy due to the effort they exerted to adapt to the economic environment.
- After adjusting for inflation, verified spending on everyday retail items remained strong even among those who reported having lower incomes or among those who said they felt worse about the economy in 2024 compared with 2019.
Taken together, we show that what consumers have been saying differs from what they have been doing during the post-pandemic period; consumers say they feel worse, but through the end of 2024, they are buying more – not just spending more – than they did in 2019. This disconnect between what consumers have been saying and doing suggests that consumer sentiment surveys on their own have become weaker indicators of future consumer behavior and of the health of US consumers. While it is important to recognize how consumers feel, we should exercise caution when using consumer sentiment surveys to infer future consumer behavior given this recent disconnect between what consumers say and do.
Consumer sentiment about current conditions has remained low despite rising wages and moderating inflation
Over the past few years, there has been a change in how overall consumer sentiment corresponds with sentiment regarding incomes and prices. Usually, consumer sentiment moves closely with sentiment regarding income growth. More recently, sentiment has been moving closely with sentiment regarding price levels.
Figure 1 plots three lines from the University of Michigan's Survey of Consumers. Consumer sentiment fell to historic lows in mid-2022, lower than during the Great Financial Crisis and during the depths of the pandemic. In late-2024, consumer sentiment remained substantially lower than pre-pandemic levels. Historically, consumer sentiment moves in tandem with concerns regarding lower income and higher prices on household finances, and sharp drops in consumer sentiment tend to precede or coincide with recessions. This time, the sustained drop in consumer sentiment following the pandemic has not preceded or coincided with a recession. Perhaps one of the reasons for this anomaly is that the link between overall consumer sentiment and sentiment regarding income seems to have broken in mid-2022, which is evident in the inset box that shows the series from 2019 onwards. Since mid-2022, consumer sentiment has been moving more closely with sentiment regarding higher prices than with sentiment regarding income. This situation similarly occurred during the inflationary episodes of the 1970s and early 1980s. In other words, during inflationary episodes, consumers seem to put more weight on higher prices than on higher incomes when assessing their current economic conditions, and as long as income growth remains robust, consumers continue spending even though in sentiment surveys, they say they feel pessimistic about the economy.
Figure 1. The index of consumer sentiment and percentage of consumers who mention high prices and lower incomes as reasons for their financial situation being worse than a year ago
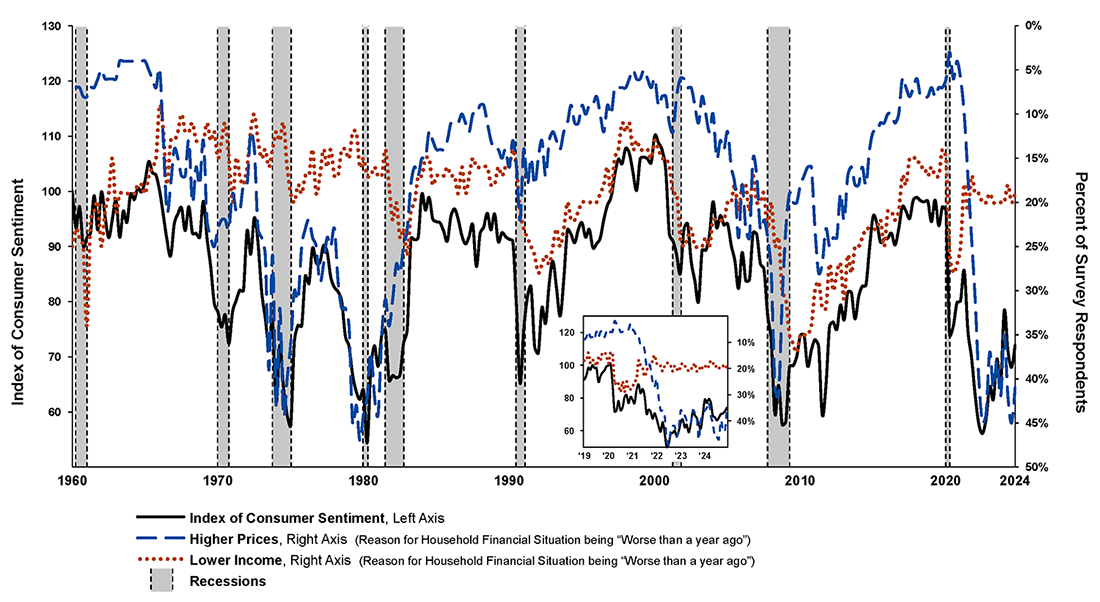
Note: In the black solid line, we report the quarterly Index of Consumer Sentiment, on the left vertical axis. The blue dashed and orange dotted lines report the share of consumers citing higher prices and lower incomes, respectively, as the reasons for their financial situation being worse compared to a year ago. The right axis is inverted: more negative sentiment (a higher share of consumers expressing negative sentiment) related to higher prices and lower incomes appears at the bottom. Shaded areas indicate periods of recessions as defined by the National Bureau of Economic Research where appropriate: April 1960 to February 1962, December 1969 to November 1970, November 1973 to March 1975, January 1980 to July 1980, July 1981 to December 1982, July 1990 to March 1991, March 2001–November 2001, December 2007–June 2009 and February 2020–April 2020. The inset box zooms in on the same three series in monthly frequency from 2019 onwards.
Source: University of Michigan, Table 1 (The Index of Consumer Sentiment) and Table 7 (Reasons for opinions about household financial situation – prices are higher (worse than a year ago) and lower income (worse than a year ago)).
Linking household surveys with panel data to better understand the rationale for low consumer sentiment
To better understand households' sentiment regarding current economic conditions, we use a custom household survey run by Numerator, a consumer panel data and survey company.3 The survey received nearly 10,000 responses in two waves in October and November 2024.4
To understand how respondents' economic sentiment is linked to changes in income and spending, the survey first asked panelists how they feel in 2024 compared with 2019, approximately how much they earned in 2024 compared with 2019, and how much they are spending in 2024 compared with 2019.5
- How they feel: 43 percent of respondents said they were doing worse or much worse, 32 percent of respondents said they were doing about the same, and 25 percent of respondents said they were doing better or much better.
- Changes in self-reported income: 26 percent of respondents said they have lower household income in 2024 compared with 2019. Some of these respondents reported that they or someone in their household lost their job or retired. 31 percent said their incomes increased 0-10 percent. 22 percent reported income increases of 10-30 percent. And the remaining 21 percent reported income increases greater than 30 percent.6
- Changes in self-reported versus experienced inflation: We compare how much more households said they were spending now for the items they buy versus what their transaction data, collected by Numerator, shows for experienced inflation. To calculate experienced inflation, we take the items consumers bought in 2019 and track the price changes for those items through 2024 while keeping consumers' baskets constant. We use each consumer's 2019 purchases to calculate weights and construct an individualized consumption basket for each consumer.
Figure 2 compares self-reported versus experienced inflation, providing a matrix for how households responded to the survey question (on the left axis) versus what their verified purchases showed (on the top axis). 61.8 percent of consumers experienced inflation of 20-30 percent, in line with the cumulative CPI increase for everyday retail purchases like groceries and general merchandise between 2019 and 2024, but only 28.8 percent of consumers said they experienced inflation of 20-30 percent in their survey responses. Most consumers over-estimated the extent of inflation they experienced. For example, 24.0 percent of consumers said they experienced inflation greater than 40 percent, on average, across their everyday retail purchases. Based on verified purchases, we see only 1.7 percent of consumers experienced inflation greater than 40 percent between 2019 and 2024. Some consumers also under-estimated the extent of inflation they experienced, but a greater share of consumers over-estimated than under-estimated their experienced inflation.
Figure 2. Survey responses for perceived inflation versus experienced inflation based on verified purchases between 2019 and 2024
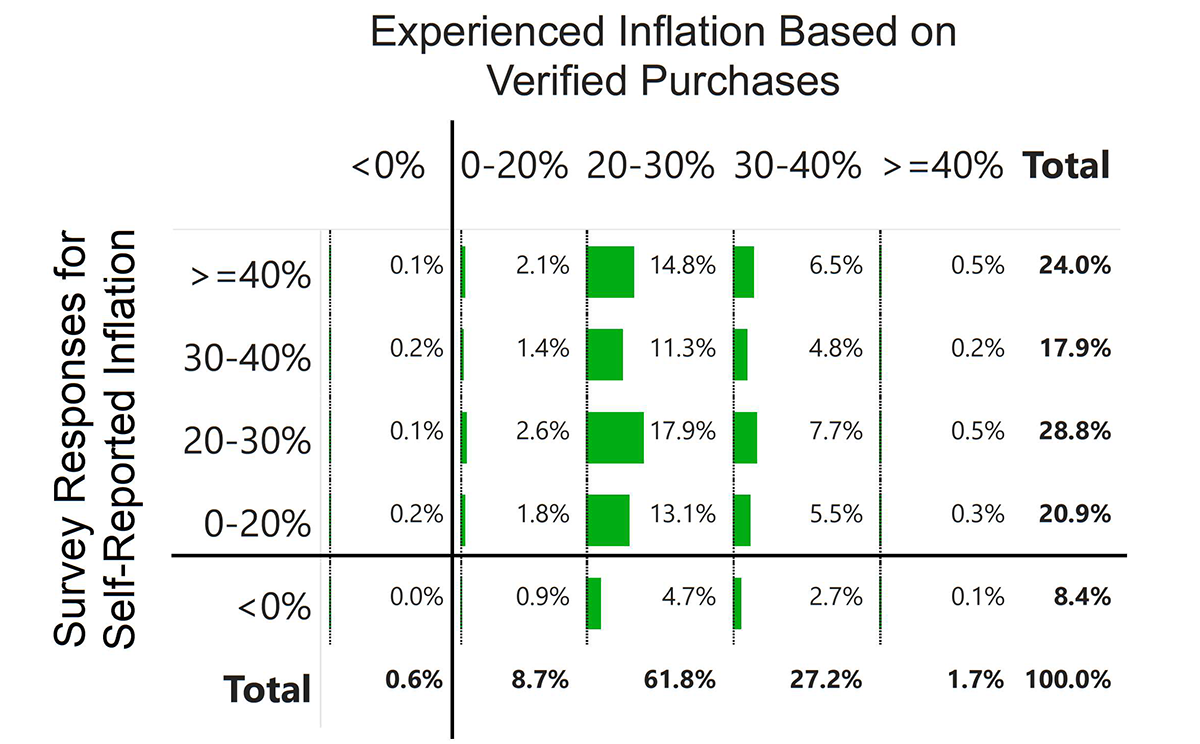
Note: We queried the transaction data from 2019 and 2024 for the survey respondents to determine the lowest category level in the Numerator hierarchy for items purchased in both years. For each respondent, we calculated the 2024 share of average spend for each lowest category among those purchased in both 2019 and 2024. This share was then multiplied by the category's 2019–2024 percent change in average spend (a proxy for price) across the full Numerator panel, yielding the respondent's average experienced inflation. These values were then rounded to align with the survey response format (increments of 5 between -50 and 50). The green bars indicate level of intensity based on the respective percentage whenever the value is above 1 percent.
Source: Authors' calculations using the survey data from Numerator.
- Changes in perceived purchasing power: We next combine changes in self-reported income and inflation to capture how households think their purchasing power changed relative to 2019. In Figure 3, the horizontal axis shows the difference between how much households said their income increased versus how much they said their spending increased. If the change in income and spending is the same, most respondents should fall in the 0 percent to 10 percent bin. If a respondent's change in perceived spending is greater than the change in their income, they will be in the negative bins; conversely, if their change in income is greater than their change in spending, they will be in the positive bins. The widths of the bins are proportional to the share of surveyed panelists in each bin. We segment the height of the bins based on how panelists said they were doing in 2024 relative to 2019.
Figure 3. Sentiment in 2024 compared with 2019 by the difference between the change in annual income and change in self-reported spending
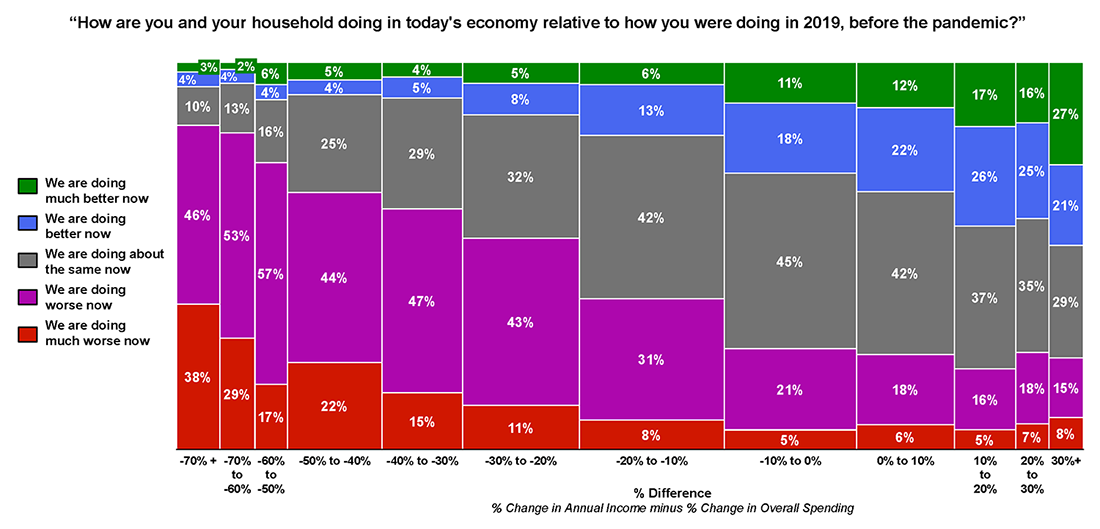
Notes: Sentiment by the difference between change in annual income and change in overall spending, between 2019 and 2024. Sentiment is percent of respondents that responded to 'How are you and your household doing in today's economy relative to how you were doing in 2019, before the pandemic?' choosing one of the options amongst the listed five: we are doing i) much better now; ii) better now; iii) about the same now; iv) worse now and v) much worse now. Decomposed by the difference between change in annual income and reported change in overall spending in question 'How much more or less would you say you and your household are spending now for the items you buy compared with 2019?'. percent Change in Annual Income calculation: ["About how much do you and your household earn now per year?" divided by "About how much did you and your household earn per year in 2019?" – 1] * 100. Columns include values from the lower bound up to (but excluding) the upper bound, but "30 percent to 50 percent" column includes 50 percent. The width of the bins is proportional to the share of the percent change amongst the full set of respondents. 17.6 percent of responses dropped due to inconsistent income entries. Columns include values from the lower bound up to (but excluding) the upper bound. Height of the bins based on how consumers said they were doing in today's economy relative to 2019. Green bars indicate the sentiment response of 'We are doing much better now'. Blue bars indicate 'We are doing better now.' Grey bars indicate 'We are doing about the same now'. Purple bars indicate 'We are doing worse now.' Red bars indicate 'We are doing much worse now.' Key identifies in order from top to bottom.
Source: Authors' calculations using the survey data from Numerator.
Most respondents felt their annual income did not keep up with their spending but recall that consumers tend to over-estimate the extent of retail price inflation they experienced. Only 23 percent of respondents reported that their incomes grew at the same rate or faster than their spending. The more consumers said their income did not keep up with spending, the greater the share who said they were doing worse or much worse in today's economy compared with 2019.
Let's look at what consumers do, not just what they say
We saw from Figure 2 that consumers tend to over-estimate their inflation experience. Do consumers also under-estimate the extent to which incomes kept up with inflation? The survey asked panelists to choose between the following three options to gauge their perceptions of how much their incomes changed compared with retail prices: i) Our incomes went up by more than the prices we pay for items we buy; ii) Our incomes went up about the same as the prices we pay for items we buy; iii) Our incomes went up by less than the prices we pay for items we buy.
Only 14 percent of respondents said their incomes went up more than prices, 33 percent said their incomes went up about the same as prices, and 53 percent said their incomes went up less than prices. Of those who reported their incomes went up less than prices, 65 percent said they felt worse or much worse in 2024 compared with 2019. On average, respondents felt the prices they paid have increased more than their incomes, and they feel worse or much worse than they did in 2019.
The Numerator data allow us to link panelists' survey responses with their retail spending.7 In the top panel of Figure 4, we show box plots for the change in real annual spending (adjusted for inflation) by sentiment from 2019 to 2024. Despite substantial variation, most panelists are buying more in 2024, after adjusting for inflation, compared with 2019. Panelists' sentiment tends to improve the more they are able to buy. In the bottom panel of Figure 4, we show panelists' change in real annual spending (adjusted for inflation) by the categorical change in their income based on our calculations using their self-reported incomes in 2019 and 2024. Spending increases with income, as expected, but even when respondents reported lower income compared with 2019, they are still buying more. These two figures and the survey responses collectively show that despite deteriorating sentiment, retail spending remained strong across panelists, even when they said they experienced declines in their incomes since 2019.8
Figure 4. Change in real (inflation-adjusted) annual spending between 2019 and 2024 by sentiment and income
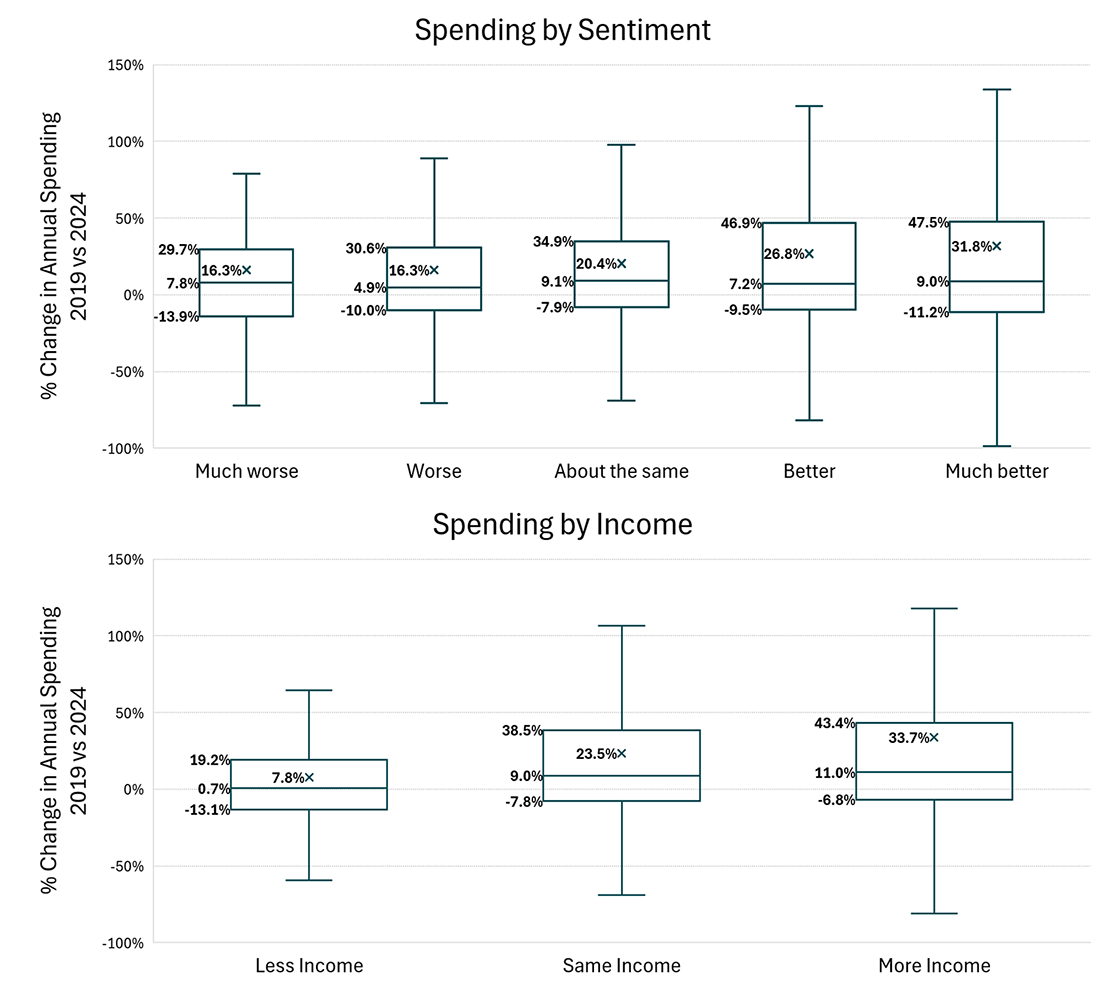
Notes: Spending by sentiment (top) and spending by change in income (bottom). The boxes represent the first and the third quartiles (25th and 75th percentiles respectively) of spending, and the lines in the boxes show the median spending. Average spending is marked with an 'x'. Whiskers extend to minimum and maximum values, excluding outliers. Spending and income are both adjusted for inflation. Inflation adjustment uses 2024 year-end Consumer Price Index (CPI) (FRED: CPIAUCSL) when 2019 year-end CPI is indexed to 100. By using a consistent inflation adjustment, we abstract from potentially differing inflation experiences of different income groups in this analysis. Sentiment is based on responses to 'How are you and your household doing in today's economy relative to how you were doing in 2019, before the pandemic?' choosing one of the options among the following five: we are doing i) much better now; ii) better now; iii) about the same now; iv) worse now and v) much worse now. percent Change in Annual Income calculation: ["About how much do you and your household earn now per year?" divided by "About how much did you and your household earn per year in 2019?" – 1] * 100. "Same Income" category includes percent changes between –5 percent and +5 percent. "Less Income" is income changes that are smaller than –5 percent and "More Income" is more than +5 percent.
Source: Authors' calculations using Numerator survey and panel data.
Why are consumers unhappy?
We have shown that sentiment deteriorates as changes in spending outpace changes in income. But people are not only spending more – we adjust for inflation – they are buying and consuming more in 2024 compared with 2019.
Recent papers explore the potential reasons behind deteriorating sentiment in high inflation periods. Stantcheva (2024) (PDF) documents that people dislike inflation because of perception. People perceive that prices increase while wages do not seem to catch up. People do not associate increases in their income with inflation-adjustments but instead with personal achievements they have earned or deserve. Although the labor market has been strong, with wages rising faster than inflation, the negative sentiment associated with inflation has been an offsetting factor in judging today's conditions and how they compare with the past. More recently, Lewin, Orchard and Dasgupta (2025) show that consumer's education-group specific inflation rate is more predictive of their well-being than the education-group specific unemployment rate or wage growth. Guerreiro, Hazell, Lian and Patterson (2024) document that actions workers take to earn more income affect their well-being, and inflation adjustments on wages do not fully reflect the effort workers exert even when incomes catch-up with price changes.
Here we show that lower sentiment about the economy is also related to changes people made to adapt to economic circumstances. To understand changes people made between 2019 and 2024 to cut costs, the survey asked two questions: i) how much effort have you put into cutting back on expenses since 2019; ii) have you made changes to your shopping behaviors such as clipping coupons, buying items when they are on promotion, shopping at lower-priced retailers, shopping around to find the best prices, buying in bulk to save money, or buying more store brands instead of brand name items.9
First, 80 percent of panelists said they put a lot or some effort into cutting expenses. Only 5 percent percent said they had not been trying to cut back on expenses. Second, as Figure 5 shows, negative sentiment increases with the number of "Yes" answers to the changes households made to cut back: the more changes households made, the worse they feel.
Figure 5. How many changes have people made to their spending between 2019 and 2024? Those who are doing worse say they've done more to cut back
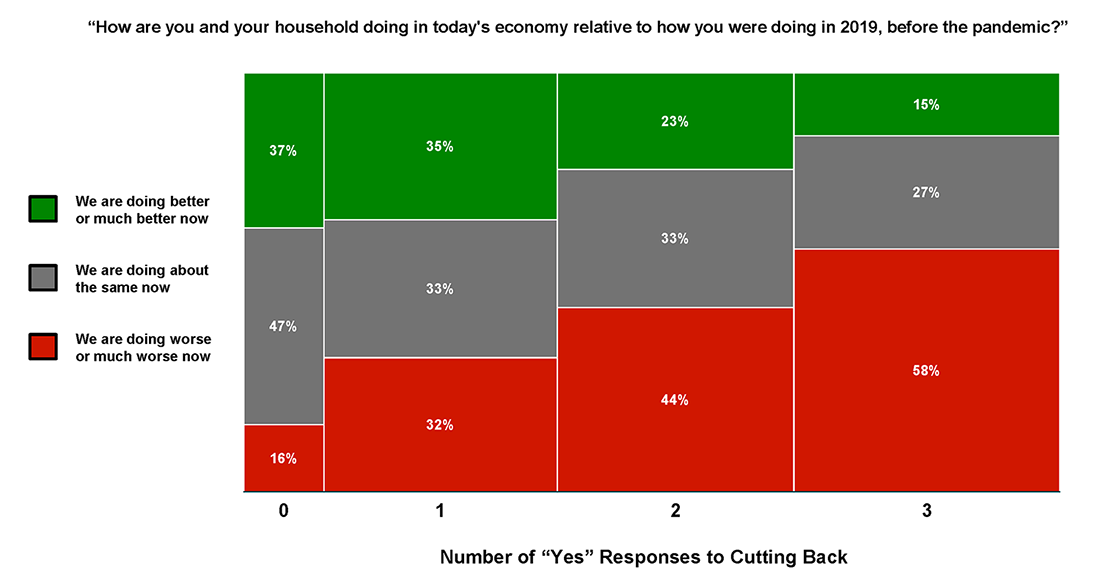
Note: 0 (n=949), 1 (n=2,325), 2 (n=2,695), 3 (n=3,249); Sentiment split by count of "Yes" responses to the following answers: (1) "I now clip coupons" or "I now try to buy items more when they are on sale or promotion"; (2) "I now shop at lower-price retailers" or "I now shop more at multiple different retailers to try to find the best prices for items I buy" or "I now do more research to see where items I buy are less expensive"; (3) "I now try to buy items in bulk to save money" or "I now try to buy more store brands rather than brand name items". The widths of the bins are proportional to the share of respondents who answered "Yes" to zero, one, two, or all three of these groups of questions. Key identifies in order from top to bottom.
Source: Authors' calculations using the survey data from Numerator.
Next, the survey asked panelists if they changed jobs in order to earn a higher wage, if they took on additional jobs, and if they regularly work more hours per week now.10 As we show in the left panel of Figure 6, respondents who changed jobs to earn a higher wage were more likely to say they were doing better. But as the right panel of Figure 6 shows, respondents who said they took on additional jobs or now regularly work more hours per week were more likely to say they were doing worse.
Figure 6. Changes that may have impacted household incomes between 2019 and 2024: Taking on additional jobs or working more hours is associated with doing worse now than in 2019
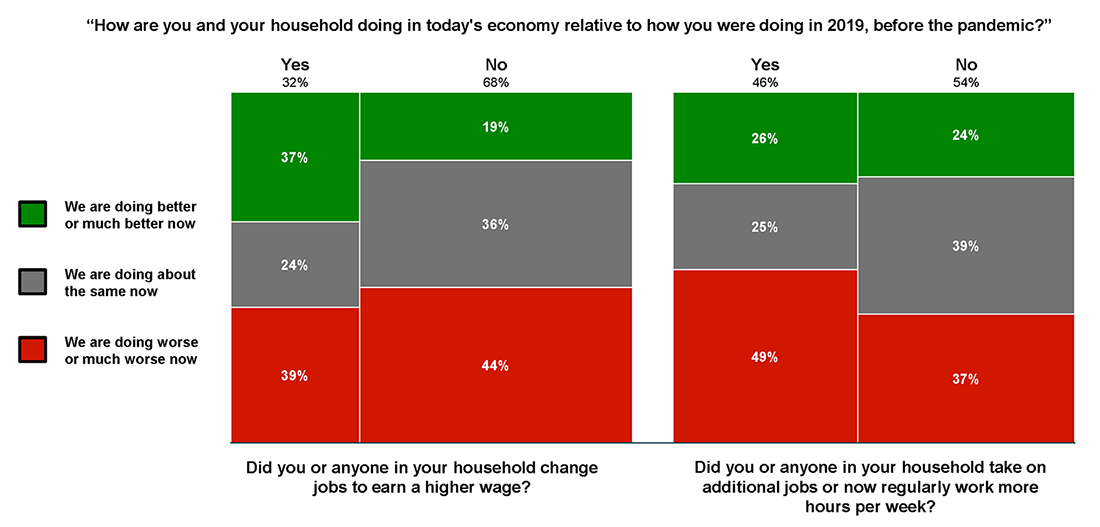
Note: Responses to change jobs (n=2,538); take on additional jobs or regularly working more hours (n=3,945); split by: "How are you and your household doing in today's economy relative to how you were doing in 2019, before the pandemic?" The width of the bins is proportional to the share of the respective answer amongst the full set of respondents. Height of the bins based on how consumers said they were doing in today's economy relative to 2019. Key identifies in order from top to bottom.
Source: Authors' calculations using the survey data from Numerator.
Concluding remarks
In this note, we summarize our observations from an economic sentiment survey linking panelists' responses to verified purchases. Consumer sentiment deteriorated since 2019, but spending remained strong even among those who felt they were doing much worse or experienced income losses as of 2024.
People's negative sentiment seems to be driven by the perception that incomes have not kept up with prices, even though real spending has increased, and by the effort they exerted to adapt to rising prices. Although sentiment improves with higher incomes, the more people said they had to make changes to their behaviors since 2019 to reduce spending, the worse is their sentiment. Moreover, those who experienced increases in their incomes still reported negative sentiment, citing the need to work more hours or take on additional jobs to earn extra income. In contrast with much of the history of consumer sentiment measures since the 1960s but similar to the history of consumer sentiment during other inflationary episodes, consumer sentiment in 2024 was more closely related to concerns about higher prices than to concerns about lower income. This situation may reverse as inflation continues to decline or if the labor market weakens.
References
Cavallo, Alberto and Oleksiy Kryvtsov (2024). "Price Discounts and Cheapflation During the Post-Pandemic Inflation Surge," Journal of Monetary Economics.
Guerreiro, Joao, Jonathan Hazell, Chen Lian, and Christina Patterson (2024). Why Do Workers Dislike Inflation? Wage Erosion and Conflict Costs. NBER Working Paper 32956.
Hacioglu Hoke, Sinem, Leo Feler, and Jack Chylak (2024). "A Better Way of Understanding the US Consumer: Decomposing Retail Sales by Household Income," FEDS Notes. Washington: Board of Governors of the Federal Reserve System, October 11, 2024.
Lewin, Nicolas, Jacob Orchard, and Kabir Dasgupta (2025). "Do People Care More About Inflation or Wage Growth?," FEDS Notes. Washington: Board of Governors of the Federal Reserve System, March 28, 2025.
Stantcheva, Stefanie (2024). Why do We Dislike Inflation? Spring 2024 Brookings Papers on Economic Activity (BPEA).
1. The analysis and conclusions set forth herein are those of the authors and do not indicate concurrence by other members of the research staff or the Board of Governors of the Federal Reserve System. The use of commercially provided data here is for research purposes only and does not imply endorsement, recommendation, or favoring of any brand, product, service, or company by the Board of Governors or the Federal Reserve System. Return to text
2. The survey questions and results can be found on https://go.numerator.com/rs/567-EJP-123/images/Numerator_Survey_on_Consumer_Sentiment_and_Behaviors_Pre_and_Post_Election.pdf. Return to text
3. Our previous FEDS note provides details on how Numerator collects data and surveys consumers. See Hacıoğlu Hoke, Sinem, Leo Feler, and Jack Chylak (2024). "A Better Way of Understanding the US Consumer: Decomposing Retail Sales by Household Income," FEDS Notes. Washington: Board of Governors of the Federal Reserve System, October 11, 2024. The Numerator panel data contain 150,000 users who self-identify as the primary shopper of the household and whose transactions are continuous and complete for a period of at least 12 months. Numerator selects these 150,000 users from over 1 million users in a way that is demographically and nationally representative. Numerator then weights and balances households to ensure a match with Census demographic data and to ensure households' detailed purchases, when summed by retailer or by manufacturer, align with quarterly earnings reports of major retailers and consumer packaged goods manufacturers. Numerator collects data from households in several ways. Using a mobile phone app called "Receipt Hog", consumers can (1) snap and upload a picture of their paper receipts, (2) allow Numerator to scrape their emails for digital receipts, and (3) link loyalty and membership accounts (such as Amazon, UberEats, Walmart, and Home Depot accounts), which Numerator then scrapes for transaction information. Panelists are rewarded with coins redeemable for Amazon or Visa gift cards or for cash through PayPal. On average, Numerator rewards panelists approximately $10 per month for providing their purchase information and completing surveys. The Numerator data also include demographic information collected through surveys on household income, age, education, zip code, household size, race/ethnicity, and various other measures. In addition to ongoing surveys designed to capture household demographic characteristics, Numerator runs periodic surveys to understand consumer sentiment and panelist behaviors. Numerator data does not capture spending on majority of services or housing. Return to text
4. The first wave of the survey was rolled out to a random subset of 10,000 Numerator panelists on October 28, 2024 and 4,600 panelists responded by November 3, 2024. The survey paused during the week of the election. The second wave started with 10,000 different Numerator panelists on November 12, 2024 and concluded on November 19, 2024 with 4,618 respondents. Overall, the survey received responses from 9,218 panelists. We checked to see if responses differed meaningfully before and after the election. They did not. We therefore combined information from the two survey waves into one analysis. Return to text
5. Here are the details of questions asked to the panelists:
1) How are you and your household doing in today's economy relative to how you were doing in 2019, before the pandemic?
Respondents could choose among five options:
- We are doing much better now;
- We are doing better now;
- We are doing about the same now;
- We are doing worse now;
- We are doing much worse now.
2) About how much do you and your household earn now per year?
3) About how much did you and your household earn per year in 2019?
Respondents could enter approximate numbers for current and 2019 income levels, or skip these questions to provide a rough estimate in percent changes of how much their household income changed between 2019 and 2024.
4) How much more or less would you say you and your household are spending now for items you buy compared with 2019?
Respondents could choose from -50 percent to 50 percent on a sliding scale, in increments of 5 percent. Return to text
6. The breakdown of increases beyond 10 percent: 12 percent said their household incomes increased 10-20 percent; 10 percent said their household incomes increased 20-30 percent; 5 percent said their household incomes increased 30-40 percent; 4 percent said their household incomes increased 40-50 percent; 12 percent said their household incomes increased more than 50 percent.
Note that these questions are not asked consecutively in the survey and respondents see one question at a time. So, we have no reason to think that respondents responded to questions by inferring their savings rate. Return to text
7. The Numerator data consist of a monthly rolling static panel of 150,000 representative US households whose transactions are complete and continuous for at least for 12 consecutive months. A subset of survey panelists, 1,566 out of 9,218 surveyed, have been in the static panel since 2019, so we can track their spending over time. We re-weight this subsample to ensure they are representative. Return to text
8. We note here that our spending and income measures are adjusted for inflation, but heterogenous inflation experiences by different income groups (as reported in Cavallo and Kryvtsov (2024), https://www.sciencedirect.com/science/article/pii/S0304393224000977) might change the extent of the increase in spending. Return to text
9. The details of the questions asked to the panelists:
1) How much effort would you say you and your household have put into cutting back on expenses since 2019?
- A lot of effort
- Some effort
- A little effort
- We have not been trying to cut back on expenses
2) Have you made any of the following changes to your shopping behaviors compared with 2019?
Respondents could select any or all that apply among the choices below, which we then grouped together to facilitate our analysis:
- "I now clip coupons" or "I now try to buy items more when they are on sale or promotion"
- "I now shop at lower-priced retailers" or "I now shop more at multiple different retailers to try to find the best prices for items I buy" or "I now do more research to see where items I buy are less expensive"
- "I now try to buy items in bulk to save money" or "I now try to buy more store brands rather than brand name items"
- "No, I have not made these changes to my shopping behaviors"
10. The details of the question asked to the panelists:
Please answer yes or no to the following questions. Between 2019 and now:
- Did you or anyone in your household change jobs in order to earn a higher wage?
- Did you or anyone in your household take on additional jobs?
- Are you or anyone in your household now regularly working more hours per week?
Hacıoğlu Hoke, Sinem, Leo Feler, Samantha Mitchell, and Jack Chylak (2025). "Tracking consumer sentiment versus how consumers are doing based on verified retail purchases," FEDS Notes. Washington: Board of Governors of the Federal Reserve System, April 24, 2025, https://doi.org/10.17016/2380-7172.3767.
Disclaimer: FEDS Notes are articles in which Board staff offer their own views and present analysis on a range of topics in economics and finance. These articles are shorter and less technically oriented than FEDS Working Papers and IFDP papers.