FEDS Notes
December 04, 2020
Treasury Market Functioning During the COVID-19 Outbreak: Evidence from Collateral Re-use
Sebastian Infante and Zack Saravay
Introduction
In March 2020, uncertainty over the COVID-19 pandemic caused severe stress in U.S. financial markets. Most notably, the U.S. Treasury market, amongst the deepest and most liquid financial markets in the world, experienced a sharp deterioration in liquidity conditions. Specifically, Fleming and Ruela (2020) document a severe impairment of Treasury market functioning, as indicated by a sharp increase in bid/ask spreads, a decline in market depth, and an increase in price impact measures. These events prompted the Federal Reserve to take emergency actions, expanding its repo operations and Treasury purchases, significantly alleviating market stress.
A reported driver behind the Treasury market’s dysfunction was an oversized increase in selling pressure from both foreign official and private investors, concentrated in off-the-run Treasury securities. The broker-dealer sector largely absorbed these sales, increasing the amount of capital that dealers committed to the Treasury market. Consequently, dealers’ willingness to intermediate the Treasury market declined as internal risk controls and regulatory pressures tightened, which resulted in the market dysfunction.
In this piece, we provide supporting evidence for the aforementioned narrative, but highlight a different possible mechanism: the low level of dealer lending through secured financing transactions (SFTs) relative to dealer positions.1 Our perspective is through the lens of a firm-level measure of collateral re-use called the collateral multiplier. This measure captures the total amount of securities dealers deliver through SFTs relative to how many they hold that are financed through SFTs. Intuitively, the collateral multiplier measures the amount of securities dealers make available to counterparties, capturing how efficiently dealers borrow, lend, and generally intermediate markets using SFTs.
We document that as liquidity conditions in the Treasury market deteriorated in the first two weeks of March 2020, the Treasury collateral multiplier significantly decreased, reaching its lowest point in our sample in mid-March.2 Consistent with these patterns, we find that while dealers' total SFT activity increased during March, much of it was to fund their own inventory rather than expand their secured lending.3 We also find that the borrower composition of dealers' lending did not change, indicating that different types of borrowers' access to dealers was evenly distributed. The Fed's actions to support market liquidity coincided with a sharp increase in the collateral multiplier in the second half of March, suggesting the actions were effective in improving dealers' market making activity. The collateral multiplier increased more after the announcement of further asset purchases than after the sizable expansion of the repo program, consistent with Infante and Saravay (2020), who document a robust positive relationship between Federal Reserve Treasury holdings and Treasury re-use.
We interpret the large drop in the collateral multiplier as a reduction in dealers' willingness or ability to intermediate the Treasury cash market. Thus, one possible explanation for the market disruption in March is that dealers did not proportionally expand their secured lending relative to their inventory.4 From the perspective of Treasury re-use, relative to normal times, dealers did not make their securities as available to other market participants. While it is possible that the relative shortfall in support may have been driven by a reduction in levered investors' demand for Treasuries or their funding relative to aggregate market activity, it seems unlikely given the dispersion in Treasury prices.5 We conjecture that this reduction in re-use affected market functioning.
Dealers' unwillingness to increase the amount of lending through SFTs repos may have been driven, in part, by dealer constraints. These could stem from internal risk limits to certain counterparties and markets, or regulatory initiatives that limit dealer balance sheet size. In particular, He, Nagel, and Song (2020) and Duffie (2020) suggest that the supplementary leverage ratio (SLR), a regulatory initiative which is particularly onerous for Treasury market intermediation, restricted dealers from participating, resulting in the market disruption. Specifically, He, Nagel and Song (2020) argue that regulatory balance sheet costs reduced dealers' incentives to provide repos to speculative investors, impairing market functioning, which is consistent with our findings.
Conceptual framework for the collateral multiplier
U.S. Treasury re-use, defined as the delivery of Treasuries sourced through SFTs to be returned at a later date, is a widespread practice that supports market functioning though the efficient distribution of cash and securities. Using data from the FR 2052a Complex Institution Liquidity Monitoring Report, we are able to construct a measure of Treasury re-use at the individual dealer level. We take a simple average amongst the 9 largest primary dealers affiliated with GSIBs to produce a measure of market-wide activity. Our measure, called the collateral multiplier, is akin to a money multiplier—it measures the firm's total amount of SFT liabilities relative to the amount of assets it owns that are financed by SFTs. Specifically, the collateral multiplier (money multiplier) measures SFTs (deposits) as a multiple of the total amount of Treasuries (reserves) owned.6
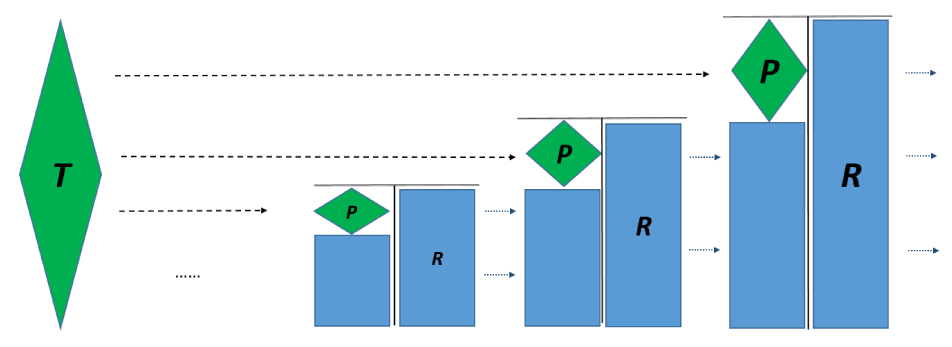
Figure 1 gives a stylized illustration of how the collateral multiplier measures the total amount of Treasuries dealers "multiply." The green diamond on the left represents all of the Treasuries available to dealers (T). Each T-account to the right represents an individual dealer, with the dealer furthest to the right being the largest. The blue squares on the liability (right) side of each dealer represent the dealer's secured funding (R), and the blue squares on the asset (left) side of each dealer represent the dealer's secured financing. Dealers also directly hold Treasuries, represented by the smaller green diamonds (P). The largest dealer furthest to the right obtains secured funding outside the dealer community.7 However, for the remaining dealers, all of their funding comes from another dealers' financing. In this stylized setting, if every dealer has the same collateral multiplier (m = R/P), then the total sum of all secured funding (R's) is equal to the multiplier (m) times T. In other words, dealers are creating m times more liabilities than there are assets, which can be interpreted as dealers "multiplying" the total amount of Treasuries available.8
We interpret m as measuring dealers' intermediation of securities. Specifically, if m is large (small), then dealers are distributing many (few) Treasuries to clients/counterparties, affecting their ability to trade in the Treasury cash market. The collateral multiplier depends on the total amount of Treasuries available, dealers' ability and/or willingness to intermediate the Treasury cash market, and investor demand for Treasuries and repo backed by Treasuries.
An important takeaway from this conceptual framework is that changes in the supply of Treasuries available to dealers will affect the level of the multiplier. Keeping the total amount of SFTs constant, an increase in the total amount of Treasuries should decrease the collateral multiplier. Intuitively, a larger supply of Treasuries reduces the need to re-use them. Specifically, Treasury issuance or aggregate selling of Treasuries by dealer clients would both increase the supply available to dealers, driving the multiplier down. Purchases of Treasuries by the Federal Reserve would decrease the supply, driving the multiplier up. Infante and Saravay (2020) empirically test these predictions, confirming that supply effects are a significant driver of collateral re-use. Interestingly, they find that supply effects are particularly strong in response to changes in the total amount of Federal Reserve holdings on Treasuries.
Collateral re-use during the COVID-19 pandemic
During the first two weeks of March, there were numerous reports of illiquidity in the Treasury cash market. Market participants described the decrease in market liquidity to be driven, in part, by increased selling of Treasuries, which increased dealers' positions and hindered their market making abilities.
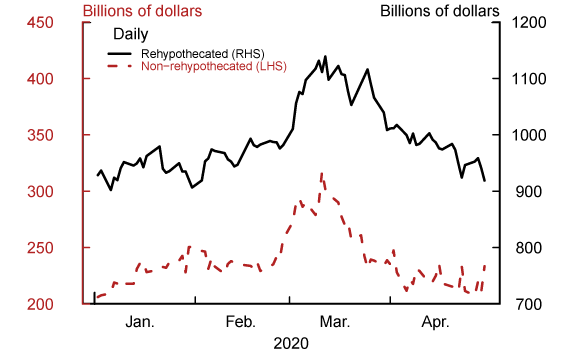
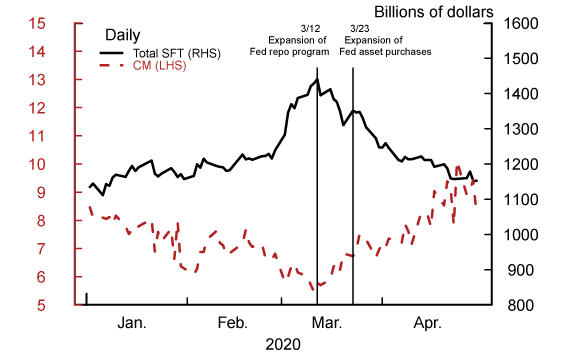
Amidst these liquidity problems, total Treasury SFT volumes increased notably, as dealers financed their new positions. Figure 2 shows the total volume of outgoing SFTs, split into rehypothecated and non-rehypothecated transactions. Rehypothecated SFTs are sourced from an incoming SFT transaction, while non-rehypothecated are sourced from dealers' own positions. The data show that SFT volumes increased for both rehypothecated and non-rehypothecated transactions during the first half of March, suggesting increased market activity. However, the increase in rehypothecated transactions was proportionally much smaller than the increase in dealers' positions. This point is highlighted by the simultaneous drop in the collateral multiplier, as shown in Figure 3. The multiplier reached its lowest level in our sample period during the week when market participants reported the most challenging liquidity conditions. The multiplier fell to 5.5 in the second week of March. For context, the average value of the multiplier during 2019 was 7.5, with a standard deviation of 0.6.
Source: Federal Reserve Board, Form FR 2052a, Complex Institution Liquidity Monitoring Report.
Source: Federal Reserve Board, Form FR 2052a, Complex Institution Liquidity Monitoring Report.
The significant decline of the collateral multiplier in early March demonstrates that as dealers' Treasury positions increased, they did not increase their secured lending proportionally, suggesting that their intermediation of the Treasury repo market was impaired. If dealers had increased the amount of rehypothecated repos relative to long positions, their re-use would likely have "normalized." This expansion of rehypothecated repo would have backed reverse repos, in part, for speculative investors such as hedge funds to take on levered long positions. Reverse repos are by far the most common contract type used to source collateral for rehypothecation – on average, over 70 percent of rehypothecated collateral was sourced from reverse repos during 2020 (see Figure 4). Notably, the composition of counterparties for reverse repo lending remained stable during March, as shown in Figure 5, demonstrating that the proportionally low level of secured lending affected all different types of borrowers. These observations demonstrate that dealers' secured lending activity during March was historically low relative to their Treasury positions. We speculate that dealers' inability or unwillingness to expand their secured lending, especially to speculative investors like hedge funds, potentially contributed to the market disruption in March.
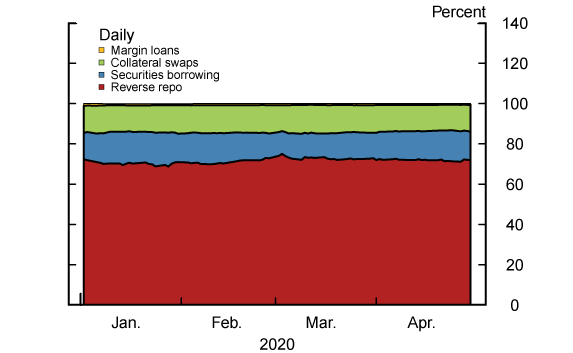
Note: Items in key correspond with each segment of shaded area, in order from top to bottom.
Source: Federal Reserve Board, Form FR 2052a, Complex Institution Liquidity Monitoring Report.
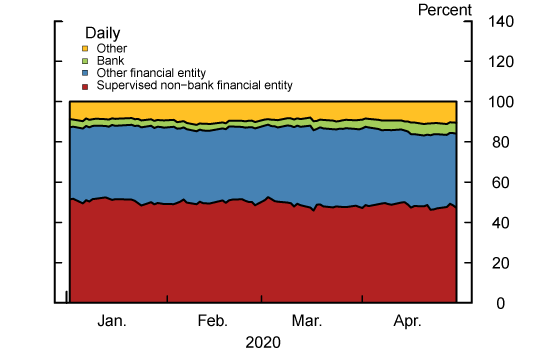
Note: Items in key correspond with each segment of shaded area, in order from top to bottom.
Source: Federal Reserve Board, Form FR 2052a, Complex Institution Liquidity Monitoring Report.
In the second half of March, emergency actions by the Fed to improve liquidity conditions in the Treasury market, which coincided with an increase in the collateral multiplier, though each action seemed to have differential effects. On March 12th, the Fed announced an increase in its repo program along with relatively minor changes to its reinvestment policy to purchase longer-dated tenors. The first action would have alleviated funding conditions for strained dealers and the second would have directly taken longer-dated Treasuries off dealer balance sheets. In response to these actions, we only see a mild increase in the collateral multiplier and the total amount of secured funding. The limited impact of the increase in Fed repo was likely due to dealers' balance sheet constraints, which may be driven, in part, by internal risk management practices and regulations that dis-incentivize them from further increasing their balance sheets. On March 15th and March 23rd, the Fed announced, among other things, significant expansions of its asset purchase programs. These announcements coincided with a much sharper increase in the collateral multiplier, consistent with the strong sensitivity between Federal Reserve Treasury holdings and Treasury re-use documented by Infante and Saravay (2020).
Conceptually, the effect of these developments on the collateral multiplier can be visualized from Figure 1. All else equal, increased client selling causes an increase in the aggregate supply of Treasuries held by dealers. From the perspective of Figure 1, the green diamond T would increase, resulting in a decrease in the collateral multiplier. Along the same lines, all else equal, Fed purchases of longer-dated Treasuries cause a decrease in the aggregate supply, resulting in an increase in the collateral multiplier. Our conceptual framework also gives a simple interpretation of how the take-up in the Fed's repo program may affect the collateral multiplier. Specifically, an increase in take-up would result in an increase in the total amount of SFTs, the right-most blue rectangle, putting upward pressure on the collateral multiplier. Finally, from our framework the SLR can be interpreted as a restriction on the size of dealers' balance sheet. From this perspective, the rule would have limited the total amount of SFTs to the dealer sector, even if funding were readily available. While this rule would not affect the collateral multiplier of an individual dealer directly, it would limit the amount of re-use for a fixed supply of Treasury securities.
Conclusion
As liquidity in the Treasury market deteriorated in March 2020, U.S. dealers' secured financing activity actually increased. However, a closer look reveals that the increase in total activity was small relative to dealers' extremely elevated Treasury positions, as demonstrated by the historically low levels of the collateral multiplier. This relatively low level of secured lending was broad-based across counterparty types, lending credence to the story that dealers' inability or unwillingness to lend to speculative investors in sufficient quantities contributed to the market disruption. While we cannot discard the possibility that the low level of secured lending was driven by a reduction in investors' demand for Treasuries or their funding, we think this outcome seems unlikely given the dispersion in prices.
These observations provide additional insights into what impaired the Treasury market and what policies were more effective to alleviate stress. Schrimpf, Shin, and Suscko (2020) argue that increased margin calls and forced selling by levered investors contributed to the market turmoil. These dynamics may have affected an important fraction of the levered investor community, which could have contributed to the deterioration in market functioning. However, our evidence shows that on aggregate, the amount of secured lending backed by Treasuries increased. While this lending certainly supported market functioning, our analysis suggests that the increase was not large enough given dealers' historically high Treasury positions, highlighting the importance of Treasury re-use for dealers' ability to make markets.
Actions by the Fed in the second half of March, particularly significant increases to asset purchases, coincided with a sharp increase in the level of the multiplier, suggesting that these actions were successful in improving dealers' intermediation of the Treasury market.
References:
Barth, D, and Kahn, J. (2020), `Basis Trades and Treasury Market Illiquidity,' No. 20-01. Office of Financial Research, US Department of the Treasury.
Duffie, D. (2020), `Still the world's safe haven? Redesigning the U.S. Treasury market after the COVID-19 crisis,' Hutchins Center Working Paper, Brookings Institution, Number 62.
Fleming, M. and Ruela, F. (2020), `Treasury Market Liquidity during the COVID-19 Crisis,' Liberty Street Economics, Federal Reserve Bank of New York.
He, Z., Nagel, S. and Song, Z. (2020), `Treasury inconvenience yields during the covid-19 crisis.' (No. w27416). National Bureau of Economic Research.
Huh, Yesol and Sebastian Infante (2018). "Bond Market Intermediation and the Role of Repo," Finance and Economics Discussion Series 2017-003. Washington: Board of Governors of the Federal Reserve System, January
Infante, S., Press, C. and Saravay, Z. (2020), 'Understanding collateral re-use in the US financial system,' AEA Papers and Proceedings 110, 482–486.
Schrimpf, A., Shin, H. S. and Sushko, V. (2020), `Leverage and margin spirals in fixed income markets during the Covid-19 crisis,' (No. 2). Bank for International Settlements.
1. SFTs include repurchase agreements (repos), securities lending contracts, collateral swaps, firm shorts, and customer shorts. Return to text
2. Data collection of FR-2052a started in 2016. Return to text
3. These observations are consistent with Barth and Kahn (2020) who document that the amount of sponsored reverse repo did not drop thorough the COVID-19 crisis. Return to text
4. Huh and Infante (2020) provides a stylized model on how repo supports bond market intermediation, capturing key features that relate the cash market with the specific issue and general collateral repo markets. Return to text
5. Barth and Kahn (2020) document a significant widening of the Treasury futures basis during this time, suggesting there were profitable near-arbitrage opportunities. Return to text
6. See Infante, Press, Saravay (2020) for more information on the collateral multiplier. Return to text
7. The arrows in the figure represent how many times the each security is used. Dashed arrows represent the purchase of a security, while solid arrows represent SFTs. In this stylized setting, the collateral multiplier also measures the length of the "collateral chain"—how many time one security is used in multiple transactions. Return to text
8. This stylized view of dealer balance sheets illustrates how one collateral class is used and re-used. In reality, dealer balance sheets have other types of assets (e.g., holding of different collateral classes) and liabilities (e.g., equity). Return to text
Infante, Sebastian, and Zack Saravay (2020). "Treasury Market Functioning During the COVID-19 Outbreak: Evidence from Collateral Re-use," FEDS Notes. Washington: Board of Governors of the Federal Reserve System, December, 04 2020, https://doi.org/10.17016/2380-7172.2755.
Disclaimer: FEDS Notes are articles in which Board staff offer their own views and present analysis on a range of topics in economics and finance. These articles are shorter and less technically oriented than FEDS Working Papers and IFDP papers.
