FEDS Notes
June 14, 2024
Who Buys Treasuries When the Fed Reduces its Holdings
Lucy Cordes and Erin Ferris1
The Federal Reserve (Fed) began to decrease the size of its balance sheet on June 1, 2022, entering a phase of "balance sheet reduction" or "quantitative tightening."2 The balance sheet shrinks when the Fed reinvests maturing Treasury securities only to the extent that they exceed a monthly cap. During the first three months of balance sheet reduction, this cap was set at $30 billion per month for Treasury securities, and in September 2022 the cap was increased to $60 billion per month (Federal Reserve Board, 2022). On June 1, 2024, the Fed decreased the cap to $25 billion per month.
Between June 2022 and May 2024, the size of the System Open Market Account (SOMA), which contains the securities held by the Fed, declined by $1.6 trillion, as shown in Figure 1. Treasury security holdings declined by $1.3 trillion, including about $1.2 trillion in Treasury coupons (securities with maturities of more than one year when issued).3 This decrease puts upward pressure on long-term Treasury yields as a greater proportion of newly issued securities need to be held by the private market (Bonis et al., 2017). However, the effect on yields can depend in part on which sectors purchase this additional private market supply of Treasury coupon securities and how "interest elastic" their demand is. Carpenter et al. (2015) show that the household sector—which includes domestic leveraged investors such as hedge funds—sold Treasury securities to the Fed during large-scale asset purchases (LSAPs), but it is an open question as to whether the same sectors that sell to the Fed during the expansion of its balance sheet through LSAPs buy the securities that roll off its balance sheet during periods of balance sheet reduction.
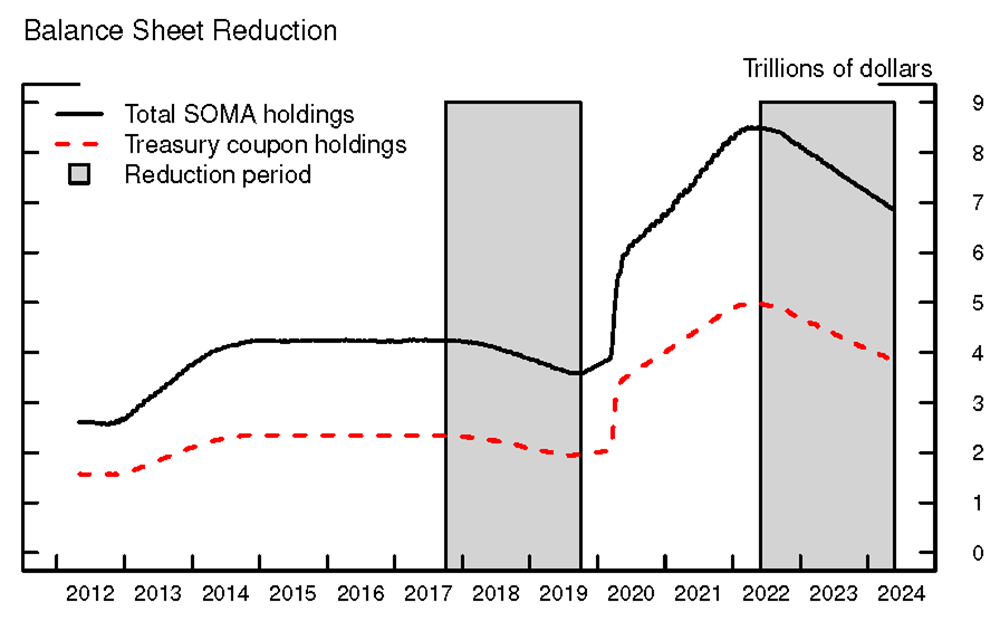
Source: Board of Governors of the Federal Reserve System, Factors Affecting Reserve Balances.
In this note, we use quarterly Treasury security holdings data from the Financial Accounts of the United States in conjunction with SOMA holdings data and Treasury security issuance data from the U.S. Treasury to determine which sectors purchased the Treasury securities that the Fed no longer holds. We also incorporate more recent data from the Enhanced Financial Accounts to break out holdings of hedge funds from other parts of the household sector. We focus on the two most recent balance sheet reduction periods: the period between 2017 and 2019 and the period that began on June 1, 2022. We find that, in the 2017-2019 period, households and hedge funds bought significantly more Treasury securities. However, when applying the same analysis to the 2022 balance sheet reduction period, we do not find that hedge funds purchased the increased private market supply. Instead, other sectors such as dealers, insurance companies, and the rest of the world seem to have stepped in.
Background and Methodology
To determine which sectors are purchasing the Treasury securities the Fed no longer holds, we extend the analysis of LSAPs, or quantitative easing, in Carpenter et al. (2015) to balance sheet reduction periods. Carpenter et al. (2015) determined the sectors from which the Fed purchased securities on the private market, examining the efficacy of so-called "preferred habitat" models, which propose that investors have different objectives, and therefore have different preferred security portfolios. Preferred habitat models suggest a channel through which quantitative easing works – that is, some investors prefer to hold longer-term securities and are less willing to substitute away from them during LSAPs. When the Fed buys Treasury securities, thereby reducing the quantity of safe, long-term assets available to the private market, price inelastic investors should continue to purchase the securities even as long-term yields decrease. Carpenter et al. (2015) found that the Fed predominantly purchased securities from households and speculate that domestic hedge funds, which are counted as part of the household sector in the Financial Accounts of the United States, were driving their result. However, they did not have the data to confirm this.
We apply Carpenter et al. (2015)'s panel regression approach to understand what type of investor absorbed the additional supply of Treasury securities during balance sheet reduction. We use data from the Financial Accounts of the United States to calculate quarterly changes in Treasury security holdings for various sectors: broker-dealers, banks, private insurance companies and pension funds, funds (including money market funds, mutual funds, closed-end funds, and ETFs), the Rest of the World, and households, which captures all Treasuries not accounted for in other sectors. Beginning in 2012-Q4, aggregate balance sheet data for all hedge funds that file Form PF with the Securities and Exchange Commission were published quarterly in the Enhanced Financial Accounts, and domestic hedge fund holdings became available in the Financial Accounts of the United States. We use these data to include three additional sectors in our regression: all hedge funds, domestic hedge funds, and "foreign" hedge funds that are domiciled abroad (calculated by taking the difference between all hedge fund and domestic hedge fund holdings). Quarterly changes in the Fed's holdings of Treasury securities come from daily Factors Affecting Reserve Balances data, and changes in total outstanding Treasury coupon securities are calculated using public debt data from the United States Treasury.
We estimate the following quarterly panel regression between 2012Q4 and 2023Q2:
$$\Delta TreasuryHoldings_{it} = \alpha_{i} + \beta_{1ipf} I_i I_p I_f \Delta SOMATreasuryCoupons_t + \beta_{2ipf} I_i I_p I_f \Delta TreasuryCouponsOutstanding_t +$$
$$\beta_{3ipf} I_i I_p I_f \Delta TreasuryHoldings_{i, t-1} + X_{it} + \varepsilon_{it}$$,
pooling across sectors $$i$$. We split the sample into different time intervals to capture differences in overall market conditions stemming from the COVID-19 pandemic. Specifically, we use an indicator variable $$I_p$$ with $$p \in$$ {pre-COVID, COVID, post-COVID}. We also capture the differential effect of Fed balance sheet policy using an indicator variable $$I_f$$ with $$f \in$$ {LSAPs, reinvestments, reduction, and organic growth}. The dates corresponding to each time period $$p$$ and balance sheet phase $$f$$ are displayed in Figure 2.
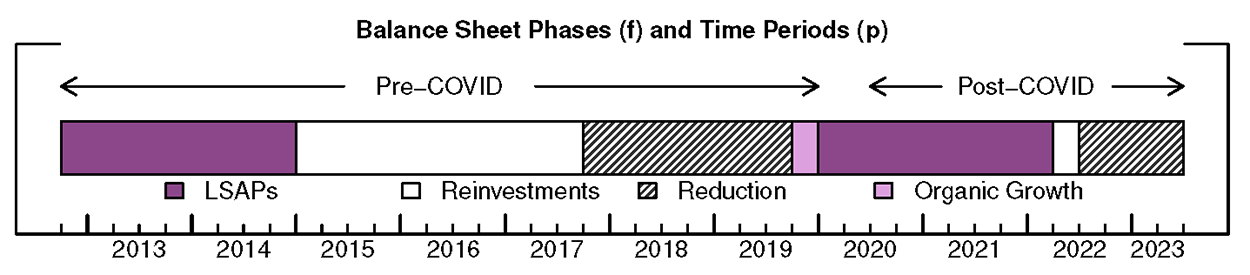
Note: During the "reinvestments" phase, the Fed replaces all maturing securities by purchasing an equal amount of newly issued securities. During the "organic growth" phase, the Fed purchases securities in order to ensure an ample supply of reserves.
We interact indicator variables $$I$$ with each variable on the right-hand side. $$X_{it}$$ is a vector of quarterly changes in covariates, including Treasury bills held in SOMA, Treasury bills outstanding, and use of the Fed's overnight reverse-repurchase facility, an alternative safe investment available to financial intermediaries.4 We use sector and quarter fixed effects to control for time-invariant sector characteristics and time trends. Rows 1 and 2 of Table 1 display the coefficients $$\beta_1$$ and $$\beta_2$$ for the pre-COVID balance sheet reduction phase.
Table 1: Results for Pre-COVID Balance Sheet Reduction
| Change in Treasury Security Holdings | ||||||||||
|---|---|---|---|---|---|---|---|---|---|---|
| Households (1) | Dealers (2) | Banks (3) | Private Insurance (4) | Funds (5) | Other (6) | Rest of the World (7) | All Hedge Funds (8) | Domestic Hedge Funds (9) | Foreign Hedge Funds (10) | |
| Pre-COVID Results | ||||||||||
| (1) Change in Fed Treasury coupon holdings | -1.629*** | -1.453*** | -0.046 | 0.009 | 0.753* | 0.056 | 1.416 | -1.822*** | 0.237*** | -2.099*** |
| (0.481) | (0.334) | (0.333) | (0.096) | (0.453) | (0.200) | (1.036) | (0.493) | (0.078) | (0.521) | |
| (2) Change in Treasury coupons outstanding5 | 0.302 | -0.018 | 0.505*** | 0.054 | 1.203*** | -0.335** | 1.973*** | -0.067 | -0.016 | -0.081 |
| (0.361) | (0.122) | (0.155) | (0.044) | (0.365) | (0.157) | (0.533) | (0.562) | (0.062) | (0.545) | |
| Post-COVID Results | ||||||||||
| (3) Change in Fed Treasury coupon holdings | -1.441 | -1.655*** | 0.268 | -0.470*** | -2.617 | -0.759*** | -2.212*** | 1.686*** | 0.138 | 1.693*** |
| (4.801) | (0.375) | (0.205) | (0.044) | (3.060) | (0.152) | (0.540) | (0.348) | (0.117) | (0.314) | |
| (4) Change in Treasury coupons outstanding | -2.528 | 0.467 | -0.352 | -0.369*** | 0.547 | -0.960*** | -1.960*** | -1.214*** | 0.063*** | -1.297*** |
| (2.938) | (0.295) | (0.261) | (0.031) | (1.759) | (0.127) | (0.323) | (0.167) | (0.023) | (0.178) | |
Note: 431 observations. *, **, *** indicate significance at the 10, 5 and 1 percent level, respectively. Newey-West heteroskedasticity consistent standard errors are shown in parentheses. Data begins in 2012-Q4 and ends in 2023-Q2.
Which sectors purchase the increased supply of Treasury securities?
The first row of columns (1) and (2) in Table 1 shows that, in the pre-COVID balance sheet reduction period, households and broker-dealers significantly increased their holdings of Treasury securities when the Fed's holdings declined.6 Since domestic hedge fund Treasury holdings are included as part of the household sector holdings in the Financial Accounts data, we are only able to disentangle the Treasury security holdings of domestic hedge funds from all other households using the Enhanced Financial Accounts data, results displayed in columns (8) – (10).
The first row of Table 1 shows that the estimates of $$\beta_1$$ from Equation 1 are quite similar for hedge funds and households. Interestingly, we find that domestic hedge funds decreased their Treasury security holdings as the Fed's balance sheet declined, and that it was foreign hedge funds that purchased the additional supply in the private market.
Figure 3 shows Treasury holdings of households and foreign and domestic hedge funds over the duration of our sample. While domestic hedge fund Treasury holdings have remained relatively flat over time, foreign hedge fund holdings increased substantially during balance sheet reduction periods. However, the Treasury International Capital (TIC) Treasury holdings data for the Cayman Islands, where many foreign hedge funds are domiciled, does not reflect this increase.7 This suggests that the "Rest of the World" sector in Financial Accounts of the U.S., for which TIC is the source, does not perfectly capture these investors, and thus some of the increase in foreign hedge fund holdings may end up in the household sector. We conclude that domestic hedge funds cannot explain the increase in household Treasury security holdings, but the increase may instead be partially attributable to foreign hedge funds.
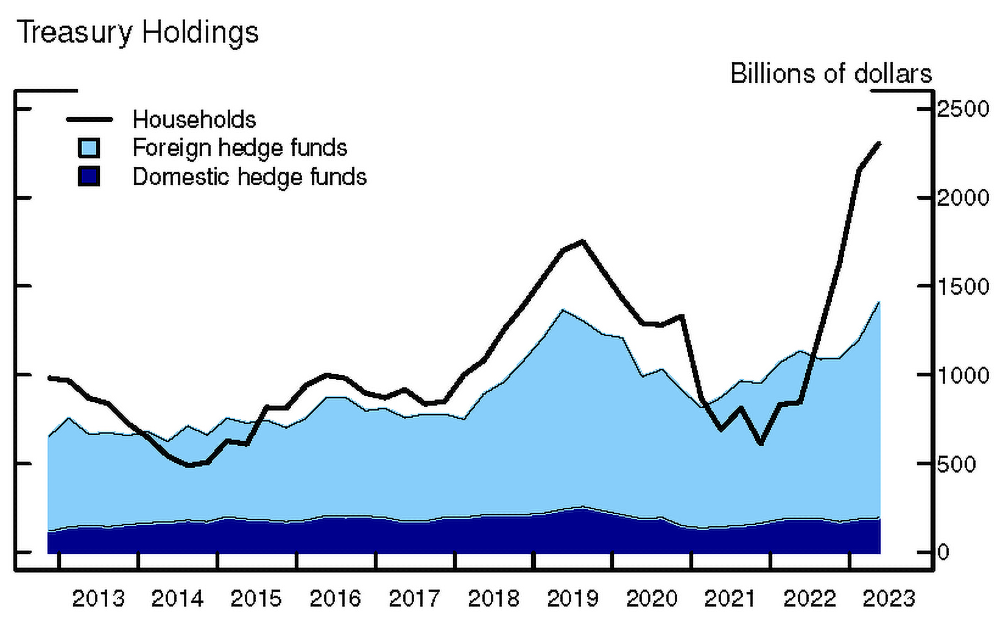
Source: Board of Governors of the Federal Reserve System, Financial Accounts of the United States; Board of Governors of the Federal Reserve System, Financial Accounts of the United States - Z.1 - Enhanced Financial Accounts.
Results from the balance sheet reduction period that began in June 2022
Results for the balance sheet reduction period that began in 2022 are displayed in rows (3) and (4) of Table 1. We find that households and dealers still appear to have purchased some of the additional supply of Treasury securities. In addition, we find that insurance companies and the rest of the world increased their holdings of Treasury securities during this period, in contrast to the pre-COVID balance sheet reduction. Interestingly, we also find a positive coefficient for hedge funds, indicating that they have held fewer Treasuries as the Fed has decreased its holdings.
One possible explanation is that the cash-futures basis trade, an arbitrage opportunity that is attractive to hedge funds and increases their demand for Treasury securities, only became profitable later in the balance sheet reduction period, when long-term Treasury yields rose relative to short-term yields (Barth et al., 2023; Glicoes et al., 2024). Unfortunately, we are unable to test this hypothesis given the available frequency of the data. Figure 3 also shows that household Treasury holdings have risen much more than hedge fund holdings, suggesting that the post-pandemic balance sheet reduction period may have prompted purchases by households or other investors captured in this residual sector.
Conclusion
Understanding the marginal buyer of Treasury securities during balance sheet reduction has implications for Treasury yield volatility. Our analysis establishes that households and broker-dealers purchased the additional supply of Treasury securities resulting from the Fed's 2017-2019 balance sheet reduction period. We find that Treasury security holdings of households are correlated with hedge fund holdings, and they appear to be related to foreign hedge funds rather than domestic hedge funds. We also find that the marginal buyer may change over time. Over the first year of the balance sheet reduction that began in June 2022, households purchased a large portion of Treasury securities the Fed no longer holds, but hedge funds did not make those purchases.
References
Barth, Daniel, R. Jay Kahn, and Robert Mann (2023). "Recent Developments in Hedge Funds' Treasury Futures and Repo Positions: is the Basis Trade "Back"?," FEDS Notes. Washington: Board of Governors of the Federal Reserve System, August 30, 2023.
Board of Governors of the Federal Reserve System, Plans for Reducing the Size of the Federal Reserve's Balance Sheet, May 4, 2022.
Bonis, Brian, Jane Ihrig, and Min Wei (2017). "The Effect of the Federal Reserve's Securities Holdings on Longer-term Interest Rates," FEDS Notes. Washington: Board of Governors of the Federal Reserve System, April 20, 2017.
Carpenter, S., S. Demiralp, J. Ihrig, E. Klee, 2015. "Analyzing Federal Reserve asset purchases: From whom does the Fed buy?," Journal of Banking & Finance 52, 230-244.
Glicoes, Jonathan, Benjamin Iorio, Phillip Monin, and Lubomir Petrasek (2024). "Quantifying Treasury Cash-Futures Basis Trades," FEDS Notes. Washington: Board of Governors of the Federal Reserve System, March 8, 2024.
1. We thank Sriya Anbil, Michael Batty, David Bowman, James Clouse, Sebastian Infante Bilbao, and Zeynep Senyuz for helpful conversations and feedback. The views expressed in this note are those of the authors and do not represent the views of the Board of Governors of the Federal Reserve System. Any errors or omissions are the responsibility of the authors. Return to text
2. Balance sheet reduction was ongoing at the date of publication. Return to text
3. The remaining $130 billion of Treasury securities that matured from the Fed's balance sheet were Treasury bills. The analysis presented in this note does not include approximately $350 billion in MBS redemptions over the same period. Return to text
4. We control for changes in SOMA bill holdings during the post-pandemic balance sheet reduction period only, as the Federal Reserve did not hold large quantities of bills from the start of our sample until fall 2019. Return to text
5. We find similar results when instead controlling for Treasury coupons in the private market, calculated as total Treasury coupons outstanding minus SOMA Treasury coupon holdings. Since Carpenter et al. (2015) control for total coupons outstanding, we display those results. Return to text
6. We further examine this result for primary dealers, a subset of the broker-dealer sector, by conducting the same analysis on a weekly and quarterly basis using holdings data reported to the Federal Reserve Bank of New York. We do not find evidence that it is primary dealers that are driving the increase in Treasury holdings in this sector. Return to text
7. We regressed foreign hedge fund Treasury holdings for hedge funds that file Form PF on Cayman Island Treasury holdings from TIC and did not find a statistically significant positive relationship. Return to text
Cordes, Lucy, and Erin Ferris (2024). "Who Buys Treasuries When the Fed Reduces its Holdings," FEDS Notes. Washington: Board of Governors of the Federal Reserve System, June 14, 2024, https://doi.org/10.17016/2380-7172.3512.
Disclaimer: FEDS Notes are articles in which Board staff offer their own views and present analysis on a range of topics in economics and finance. These articles are shorter and less technically oriented than FEDS Working Papers and IFDP papers.