IFDP Notes
March 09, 2018
Should We Be Concerned Again About U.S. Current Account Sustainability?
Shaghil Ahmed, Carol Bertaut, Jessica Liu, and Robert Vigfusson
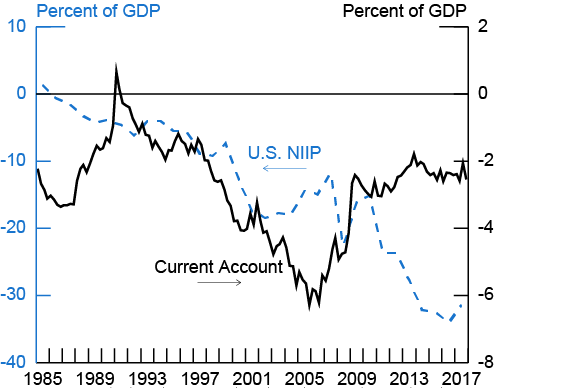
The U.S. net international investment position (NIIP)--the difference between a country's external financial assets and liabilities--as a share of GDP (the blue dashed line in Figure 1) in recent years has resumed its earlier deteriorating trend. The NIIP now exceeds negative 30 percent of nominal GDP, so that foreign financial claims on U.S. entities substantially exceed--and to an increasing degree--U.S. claims on foreign entities.2 Moreover, the U.S. current account (the black line), a measure of the net flow of financial claims, has also halted its improvement and moved modestly more into deficit as a share of GDP in recent years.
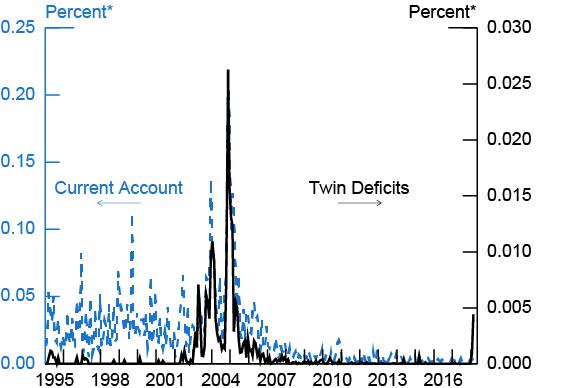
These developments could be sources of renewed concerns about the trajectory of U.S. international debt and about the sustainability of the U.S. current account deficit. As shown by the dashed blue line in Figure 2, though, no corresponding ratcheting-up of concerns about the U.S. current account can be gleaned from news sources; the number of times the U.S. current account is mentioned in the news per month, after rising sharply through the mid-2000s, declined considerably in frequency and has remained low in recent years. On the other hand, as indicated by the black line, we do see a slight uptick in references to U.S. "twin deficits" so far this year, though the frequency remains well below that of the mid-2000s.3
In this note, we compare the present situation to that prevailing in the mid-2000s, when concerns about the NIIP and the current account were at the forefront, and we examine the prospects for U.S. external sustainability going forward. Our key finding is that there appears to be much less ground for being concerned about U.S. external sustainability going forward now than in the mid-2000s.4
Metric for External Sustainability
The metric for external sustainability we use is a standard one and requires that the NIIP/GDP ratio stabilizes. Intuitively, if this ratio were to keep getting more negative, debt service would eventually end up consuming all of GDP. In turn, the stability of NIIP/GDP has implications for the current account because the latter is essentially the flow associated with the NIIP stock. A positive current account (surplus) in a given year implies that a country has been a net lender to the rest of the world during that year so that, abstracting from valuation changes, its NIIP increases, whereas the reverse is true for a negative current account (deficit). Therefore, again ignoring valuation changes, a stable NIIP/GDP implies that NIIP grows at the same rate as GDP. Labelling the growth rate of GDP as g, we can write:
$$CA_{t}=NIIP_{t}-NIIP_{t-1}=gNIIP_{t-1}$$ (1)
Dividing both sides by GDP, and rewriting a bit:
$$\frac{CA_{t}}{GDP_{t}}=g\times \frac{NIIP_{t}}{GDP_{t}}\times \frac{NIIP_{t-1}}{NIIP_{t}}$$ (2)
Equation (2) implies that in the long run the NIIP/GDP is stable when:
$$\frac{CA/GDP}{NIIP/GDP}=\frac{g}{1+g}\approx g$$ (3)
Thus, if the NIIP/GDP is stable then CA/GDP has to be stable also, with the ratio of the latter to the former equal to the growth rate of nominal GDP. For 2017, the current account deficit was around 2-1/2 percent of GDP and the NIIP/GDP ratio was about negative 32 percent, so that (CA/GDP)/(NIIP/GDP) expressed as a percentage was about 7-3/4 percent, well above the 4 percent increase actually recorded for U.S. nominal GDP growth.5 So at present, the necessary condition for stability is far from being satisfied. Yet, as shown in Figure 2, concerns about U.S. current account sustainability don't appear to be getting much attention.
The Situation Now versus the Early- to Mid-2000s
The early- to mid-2000s was a period when concerns about U.S. external sustainability were prominent. Going back to Figure 1, we can see where these concerns were coming from--the current account deficit was rapidly expanding and the NIIP was deteriorating sharply. More detail about that period can be found in Bertaut, Kamin, and Thomas (2009).
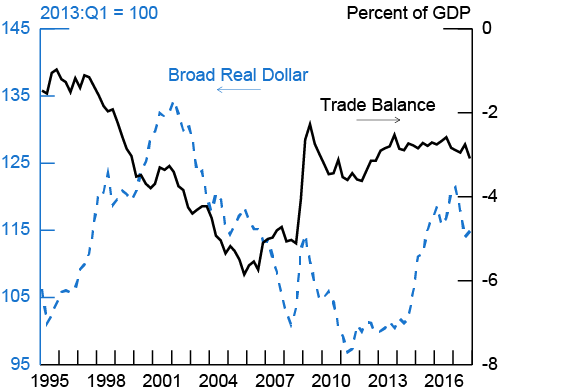
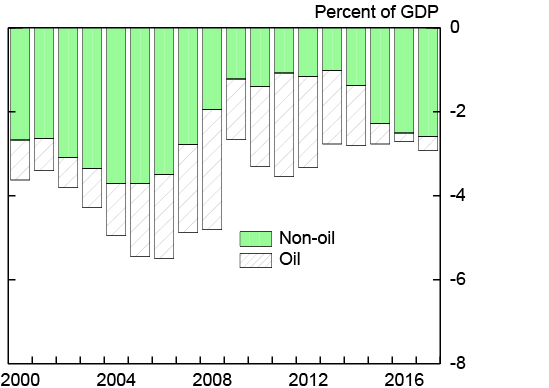
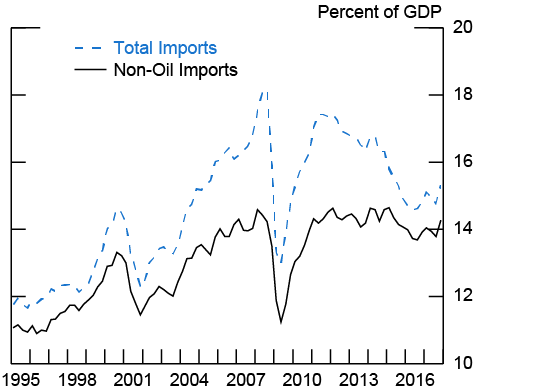
Given that the necessary condition for NIIP stability is still far from holding, why have concerns about U.S. current account sustainability faded? One reason is that the trade deficit (the black line in Figure 3) has remained relatively stable in recent years, even following the sizable appreciation of the foreign exchange value of the dollar over 2014 and 2015 (shown by the dashed blue line). This, in turn, can be traced to a couple of important factors: First, oil imports have decreased as U.S. oil production has ramped up; the gray hatched bars in Figure 4 show the diminished contribution of net oil imports to the trade deficit in recent years. Second, imports more generally have been weak. The ratio of imports to GDP (shown in Figure 5) has fallen despite the considerable dollar appreciation in part because the trade-sensitive components of domestic demand, such as equipment investment, were particularly weak in 2014 and 2015.
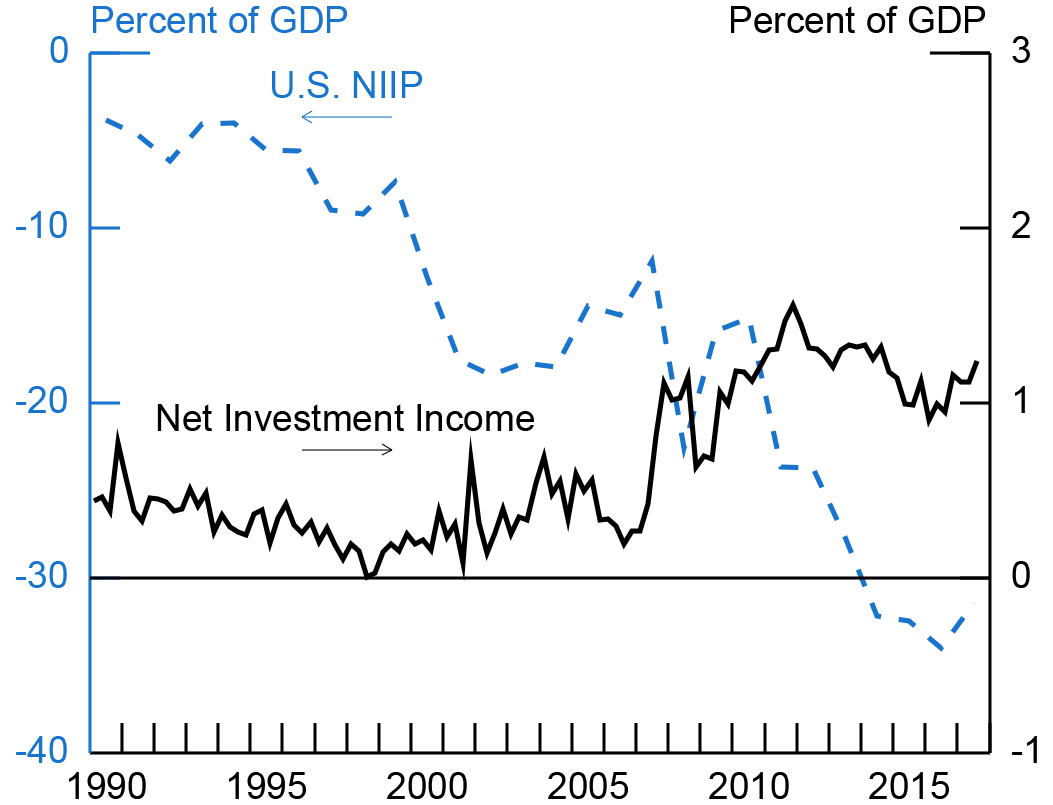
Another reason for the relatively benign concerns about the U.S. current account is that the U.S. continues to earn positive net investment income (NII) despite the increasingly negative NIIP (Figure 6). How is this possible? First, the stock of U.S. direct investment abroad is larger than foreign direct investment in the United States and earns more.6 Second, even though the U.S. has much larger portfolio liabilities vis-à-vis the rest of the world than portfolio assets, most liabilities are fixed-income instruments, whereas claims are tilted more toward equity. As such, with "low-for-long" interest rates and safe haven flows over the post-GFC period, U.S. net portfolio payments abroad since 2008 have actually decreased, even as the portfolio position has become more negative.
Looking Ahead
But what matters is where we are headed and whether the necessary condition for stability is going to be satisfied over the long run. To assess this, we need a model and some baseline assumptions to put into the model to obtain the relevant projections.
As in Bertaut, Kamin, and Thomas (2009), we use the Federal Reserve Board staff's partial equilibrium model of U.S. international transactions (USIT model). The USIT model consists of several hundred equations, including identities and many estimated behavioral equations pertaining to disaggregated trade flows (components of imports and exports), non-trade components of the current account (including investment income), and financing flows.7 From these equations, investment positions of various categories of investment can be obtained using the previous year's position, financial flows in that period, and valuation changes.
We use exogenous assumptions for the central determining factors in the equations of the USIT model to project U.S. external balances and positions going forward in various categories and then aggregate these. For U.S. and foreign real GDP growth, we use forecasts from the IMF's World Economic Outlook (WEO, October 2017, updated in January 2018) through 2021 and then generally flatline these after that, with one notable exception: For China, we extend the downward trend of the past ten years.8 For U.S. and foreign inflation, we again use WEO forecasts up to 2021 and then flatlined. U.S. short-term (3 month) and long-term (10 year) interest rates are obtained from Blue Chip Forecasts.9 The trade-weighted U.S. dollar is flatlined at its end-December 2017 value, although we later discuss the implications of dollar appreciation or depreciation going forward.
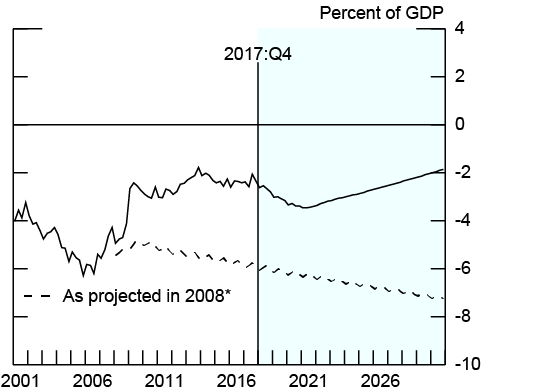
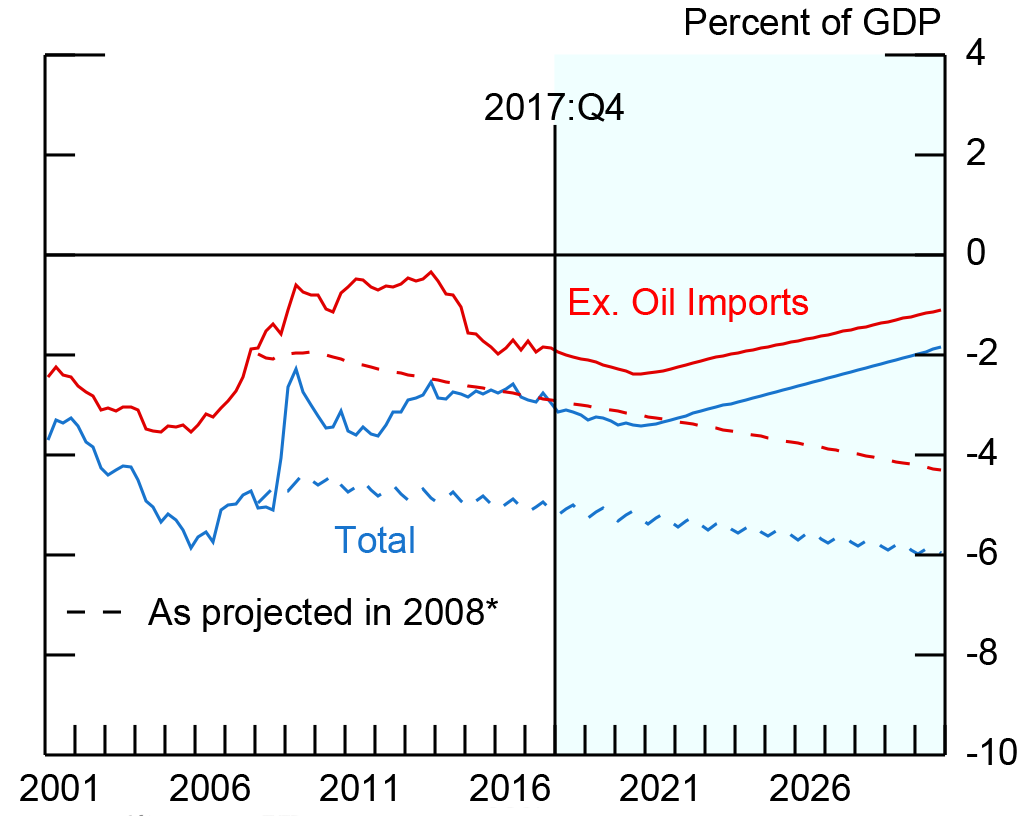
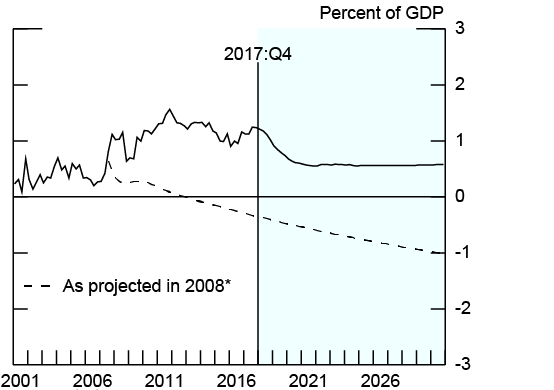
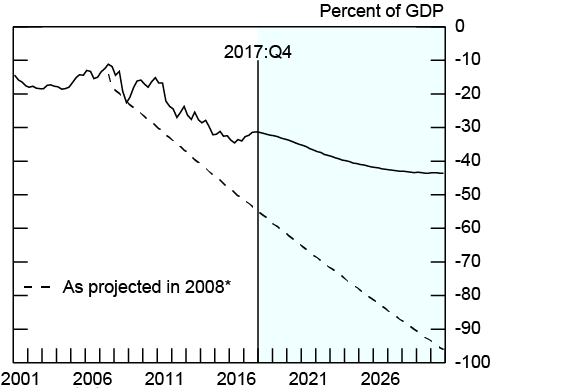
The results of the model simulations are shown in Figures 7-10. Under the baseline assumptions, in the near term the U.S. current account (Figure 7) and the trade balance (Figure 8) go more into deficit, reflecting the lagged effects of the dollar's appreciation from 2014 through 2016, but then the deficits begin to narrow around 2020 as these effects fade and the effects of stronger foreign growth and the dollar's more recent depreciation kick in. Note that the situation is very different from what was being projected in 2008--see Bertaut, Kamin, and Thomas (2009)--when these external deficits were projected to continue to increase as a share of GDP. At that time, interest rate and GDP growth projections for both the United States and our foreign trading partners were much higher. We also re-estimate the model periodically, and some of the estimated elasticities have also changed.
As shown in Figure 9, NII declines as interest rates rise (reversing the trend when interest rates were falling), but eventually stabilizes at about 0.5 percent of GDP. The NIIP as a share of GDP (Figure 10) continues to become more negative, but its deterioration slows as the current account deficit narrows, and it too eventually stabilizes, at a little over negative 40 percent of GDP. This suggests external sustainability in the long run, unlike what we were projecting in 2008.
Of course, assumptions matter. What if interest rates were to rise more sharply over the next few years than we have assumed in our forecast – by another 100 basis points by 2020, for example? In this case, NII would deteriorate more significantly but would stabilize at a level close to zero once interest rates peak. The current account balance would still narrow, though the improvement would be delayed a couple more years, and the NIIP would stabilize at a slightly more negative level. Assumptions on exchange rates also matter. For example, if the dollar were to resume appreciating, there would be more persistent pressures on the trade and current account deficits, NII would eventually become negative, and the NIIP would continue to deteriorate. On the other hand, if the dollar were to continue depreciating, the external deficits would narrow much faster and the NIIP as a share of GDP would stabilize more quickly as well.
Challenges of Our Approach
One challenge stems from the fact that we have focused on the necessary condition only of the stability of the NIIP/GDP ratio. Given that in our baseline assumption, the NIIP stabilizes at a bit more than negative 40 percent of GDP, a relevant question is whether a ratio of that magnitude can be maintained. The key is the willingness of foreigners to acquire more U.S. assets to finance a bigger NIIP position than now exists or whether U.S. assets would become too large a proportion of foreign portfolios well before that point is reached.
Gagnon (2017a), for example, has recently argued that no country has been able to maintain as large a NIIP as negative 50-60 percent of GDP without major adjustments, and so he views such a large ratio as being unsustainable for the United States.10 But in evaluating this argument, we should bear in mind the special place of the dollar as the world's major reserve and safe-haven currency. Moreover, how willing foreigners would be to hold more U.S. assets depends in part on the evolution of market capitalizations both in the U.S. and abroad. In the past, foreign holdings of U.S. Treasuries tripled between 2003 and 2016, but resulted in a relatively muted increase in the share of total world market cap held by foreigners. Finally, U.S. assets are still only a small fraction--less than 15 percent--of the aggregate portfolio of foreign investors. Our simulations suggest that even with the increased holdings implied by our NIIP projections, U.S. assets could still end up being less than 20 percent of the foreign portfolio.
Another challenge comes from the partial equilibrium nature of the model we use, which has some shortcomings. Is the U.S. current account path being projected here consistent with the paths of current accounts in the rest of the world? Our approach does not impose this consistency. For example, in the past a large part of global imbalances has been traced to excessive external deficits in the United States and excessive surpluses in China, so for overall sustainability to be maintained adjustments in both would be required. Although we do not impose that constraint, we nonetheless have seen global adjustments in that direction: China's surplus has been sharply reduced, and the surplus of the oil exporting countries has been eliminated. Also, in a general equilibrium approach, if the U.S. path of the current account, say, were found to be unsustainable, one of the mechanisms would be an adjustment of the dollar, but our partial equilibrium approach does not tell us how much the dollar would need to adjust.
But there are also tradeoffs as you go to a more general equilibrium approach. There are lots of details in our partial equilibrium approach that allow us to look at the composition of assets and liabilities. At a minimum, our partial equilibrium approach helps us understand and quantify the many transmission mechanisms from which more informed judgments can be made.
References
Bertaut, Carol C., Steven B. Kamin, and Charles P. Thomas (2009). "How Long can the Unsustainable U.S. Current Account Deficit be Sustained?" IMF Staff Papers, vol. 56, No. 3, pp. 596-632.
Chinn, Menzie (2017). "The Once and Future Global Imbalances? Interpreting the Post-Crisis Record," paper for the 2017 Jackson Hole Economic Policy Symposium, Federal Reserve Bank of Kansas City, https://www.kansascityfed.org/~/media/files/publicat/sympos/2017/chinn-paper.pdf?la=en
Chinn, M. D., B. Eichengreen, and H. Ito. (2013). "A Forensic Analysis on Global Imbalances," Oxford Economic Papers 66(2): 465-490.
Gagnon, Joseph E. (2017a). "The Unsustainable Trajectory of U.S. International Debt," Peterson Institute for International Economics, Real Time Economic Issues Watch, March. https://piie.com/blogs/realtime-economic-issues-watch/unsustainable-trajectory-us-international-debt
Gagnon, Joseph E. (2017b). "Curbing the Growth of U.S. International Debt," Peterson Institute for International Economics, Real Time Economic Issues Watch, March. https://piie.com/blogs/realtime-economic-issues-watch/curbing-growth-us-international-debt
Guvene, F., R. Mataloni, D. Rassier, and K. Ruhl. (2017). "Offshore Profit Shifting and Domestic Productivity Measurement," BEA Working Papers, https://bea.gov/papers/pdf/GMRR-2017.pdf
IMF External Sector Report, various years. International Monetary Fund, http://www.imf.org/en/Publications/SPROLLs/External-Sector-Reports
IMF World Economic Outlook, October 2017. International Monetary Fund, https://www.imf.org/en/Publications/WEO/Issues/2017/09/19/world-economic-outlook-october-2017
IMF World Economic Outlook Update, January 2018. International Monetary Fund, https://www.imf.org/en/Publications/WEO/Issues/2018/01/11/world-economic-outlook-update-january-2018
Phillips, S., L. Catão, L. Ricci, R. Bems, M. Das, J. Di Giovanni, D. Feliz Unsal, M. Castillo, J. Lee, J. Rodriguez and M. Vargas (2013), "The External Balance Assessment (EBA) Methodology," IMF Working Paper No. 13/272 (December). https://www.imf.org/external/pubs/ft/wp/2013/wp13272.pdf
*Percent of news stories originating from North America.
Source: Factiva. Data are shown through February 2018.
Source: BEA, FRB
Source: BEA and Staff Estimates
Source: BEA
Source: BEA
1. The authors are, respectively, Senior Associate Director, Deputy Associate Director, Senior Research Assistant, and Assistant Director and Section Chief in the International Finance Division, Board of Governors of the Federal Reserve System, Washington DC 20551 U.S.A and can be reached at [email protected], [email protected] and [email protected]. An earlier version of these findings were presented at the Inter-American Development Bank's Current Account Sustainability Conference held in Washington, DC on April 18, 2017, and we are grateful to the participants of that conference for useful comments. We also thank Joseph Gruber and Steven Kamin for many helpful suggestions. Nathan Mislang, Julio Monge, and Caleb Wroblewski provided excellent research assistance. The views expressed are solely the responsibility of the authors and should not be interpreted as reflecting the views of the Board of Governors of the Federal Reserve System or of any other person associated with the Federal Reserve System. Return to text
2. Recently, Gagnon (2017a) has highlighted this development. Note that our preferred measure of the NIIP evaluates direct investment at the "current cost" of replacing direct investment assets and liabilities. Gagnon's analysis uses the "market value" measure, which values owners' equity in direct investment using current prices of traded stocks. The NIIP is more negative (currently about negative 40 percent of GDP) according to the market value measure, because the substantial appreciation in U.S. equity prices in recent years has boosted the estimated value of our direct investment liabilities. Return to text
3. "Twin deficits" refers to the situation when an economy is running both a fiscal deficit and a current account deficit. Searches on the "U.S. trade deficit" reveal a similar pattern of newsworthiness qualitatively as for the current account, except that the frequency of mentions in the news rises significantly over the past year and a half. However, this increase appears to be mainly in relation to trade policy rather than sustainability concerns. News references are scaled by the total number of news stories originating from North America per month. Return to text
4. Concerns about "global imbalances", that is, the pattern of persistent current account deficits in some countries and persistent surpluses in others, have received a bit more attention in recent years, including through the introduction of the IMF's annual External Sector Report in 2012 (based on a methodology outlined in Phillips et al. (2013)). Causes of global imbalances have also been the focus of academic research, for instance by Chinn and co-authors (Chinn et al. (2013); Chinn (2017)). Discussions of global imbalances typically note that they have declined as a share of GDP since the global financial crisis. Return to text
5. Our calculations for 2017 are based on the current account and the NIIP through 2017:Q3, updated with trade balance data for Q4. Return to text
6. One contributing factor to the higher income earned on U.S. direct investment abroad has been the tendency for U.S. multinationals to establish affiliates in low-tax jurisdictions and to book profits in those locations. As discussed in Guvenen et al. (2017), this "profit shifting" practice has resulted in a larger U.S. trade deficit (because it reduces U.S. exports of intangibles such as intellectual property) but the flip side of this understatement of exports is higher recorded direct investment receipts. Importantly for our analysis, profit shifting does not affect the overall current account balance, which ultimately determines the expected evolution of the NIIP. Return to text
7. Note that the current account pins down aggregate financing flows but equations are specified that determine how these aggregate flows are allocated between direct investment and portfolio flows. Return to text
8. The continued downward trend in Chinese GDP growth reflects the general belief that potential growth there will continue to slow. We exclude Venezuela from our foreign aggregate because of the difficulty projecting a longer term forecast given the depths of its recession and current hyperinflation. Return to text
9. Because longer run Blue Chip forecasts have not been updated since last October, we make a judgmental adjustment to short-term interest rates in 2020 and 2021, based on the upward revision to the median projection of the Federal Funds rate by FOMC participants between the September and December projections. Return to text
10. In a companion post, Gagnon (2017b), he discusses possible policies to solve the problem, with his major recommendation being to encourage an orderly decline in the dollar. Note that our estimate of the NIIP stabilizing at a little over negative 40 percent of GDP is plausibly in the neighborhood of negative 50 percent of GDP if direct investment is measured by the market value. Return to text
Ahmed, Shaghil, Carol Bertaut, Jessica Liu, and Robert Vigfusson (2018). "Should We Be Concerned Again About U.S. Current Account Sustainability?," IFDP Notes. Washington: Board of Governors of the Federal Reserve System, March 2018., https://doi.org/10.17016/2573-2129.42.
Disclaimer: IFDP Notes are articles in which Board economists offer their own views and present analysis on a range of topics in economics and finance. These articles are shorter and less technically oriented than IFDP Working Papers.