April 07, 2025
Inflation Dynamics and the Phillips Curve
Governor Adriana D. Kugler
At Ec10b Principles of Economics Lecture, Department of Economics, Faculty of Arts and Sciences, Harvard University, Cambridge, Massachusetts
Governor Adriana D. Kugler presents a lecture about inflation dynamics and the Phillips Curve to students in Harvard University's Ec10b Principles of Economics class on Monday, April 7, 2025.
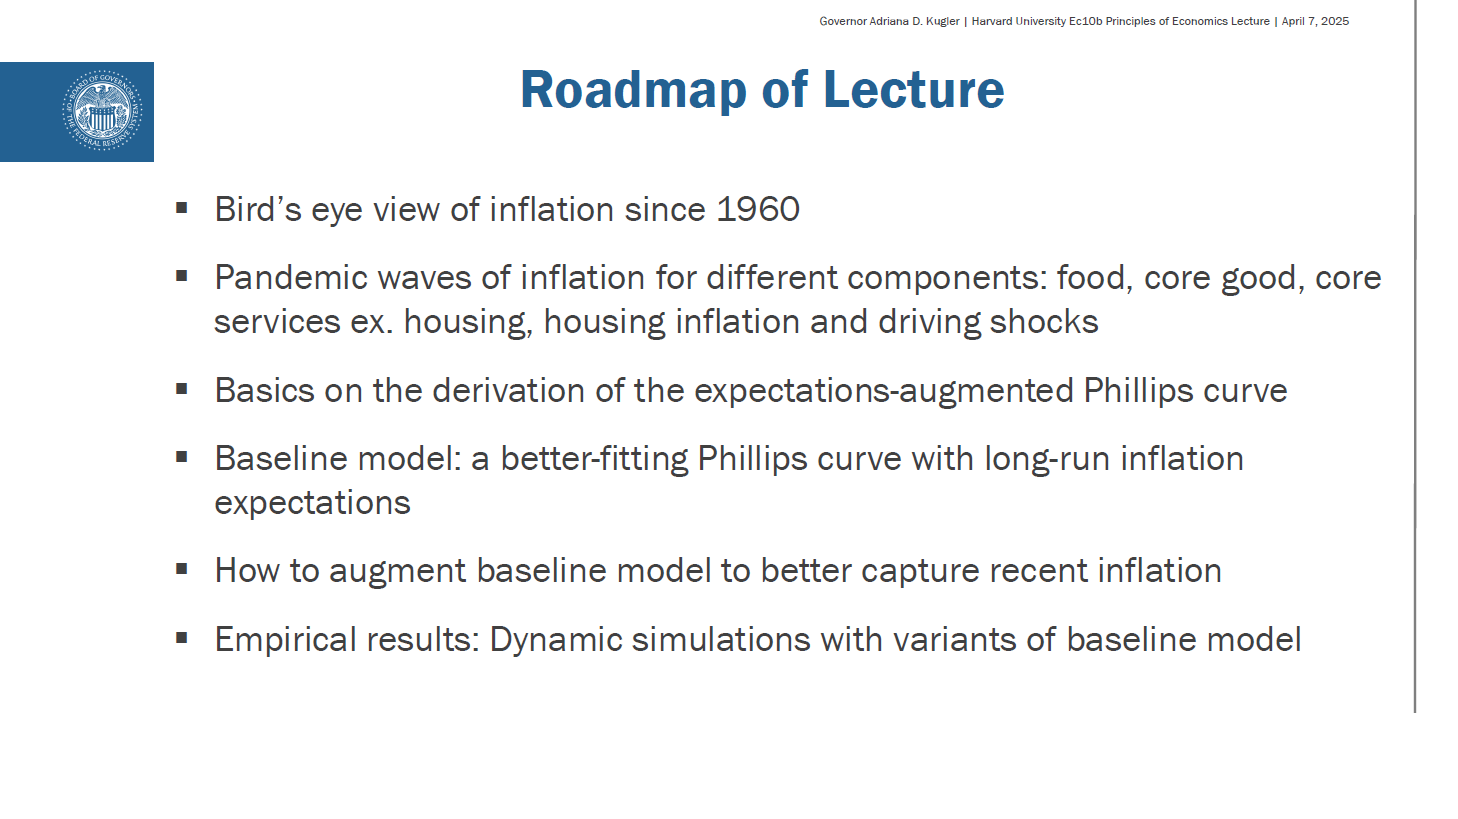
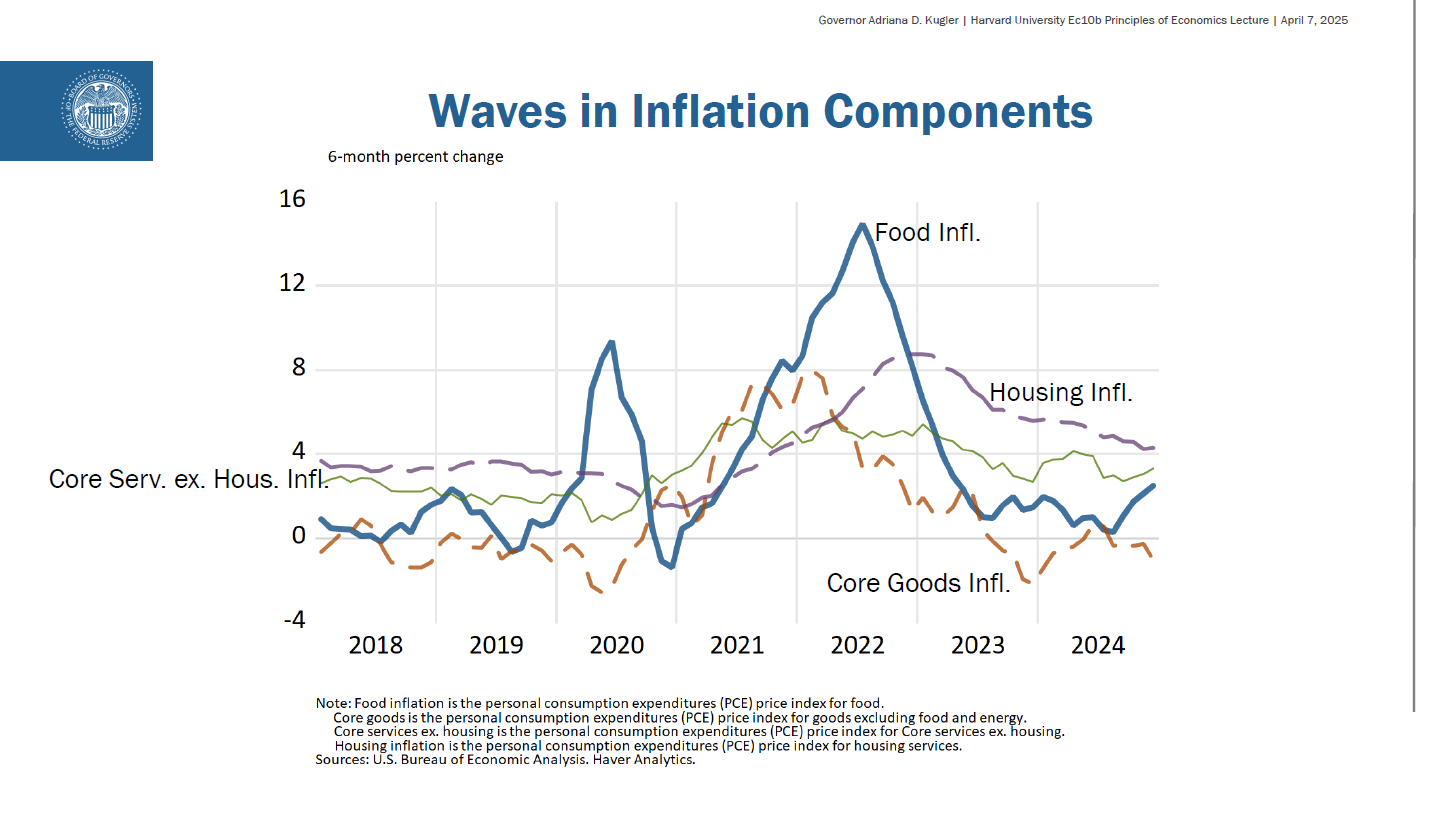
In the lecture she discusses how pandemic-era inflation came in a series of waves: food, core goods, core services and housing. She then talks about the Phillips curve as a model to capture inflation dynamics. Finally, Governor Kugler explores additional augmentations to the Phillips curve model that could help better explain the most recent inflation episode.
Here are the slides from her presentation.
- Slide 1. Roadmap of Lecture
- Slide 2. A Bird’s Eye View of Inflation
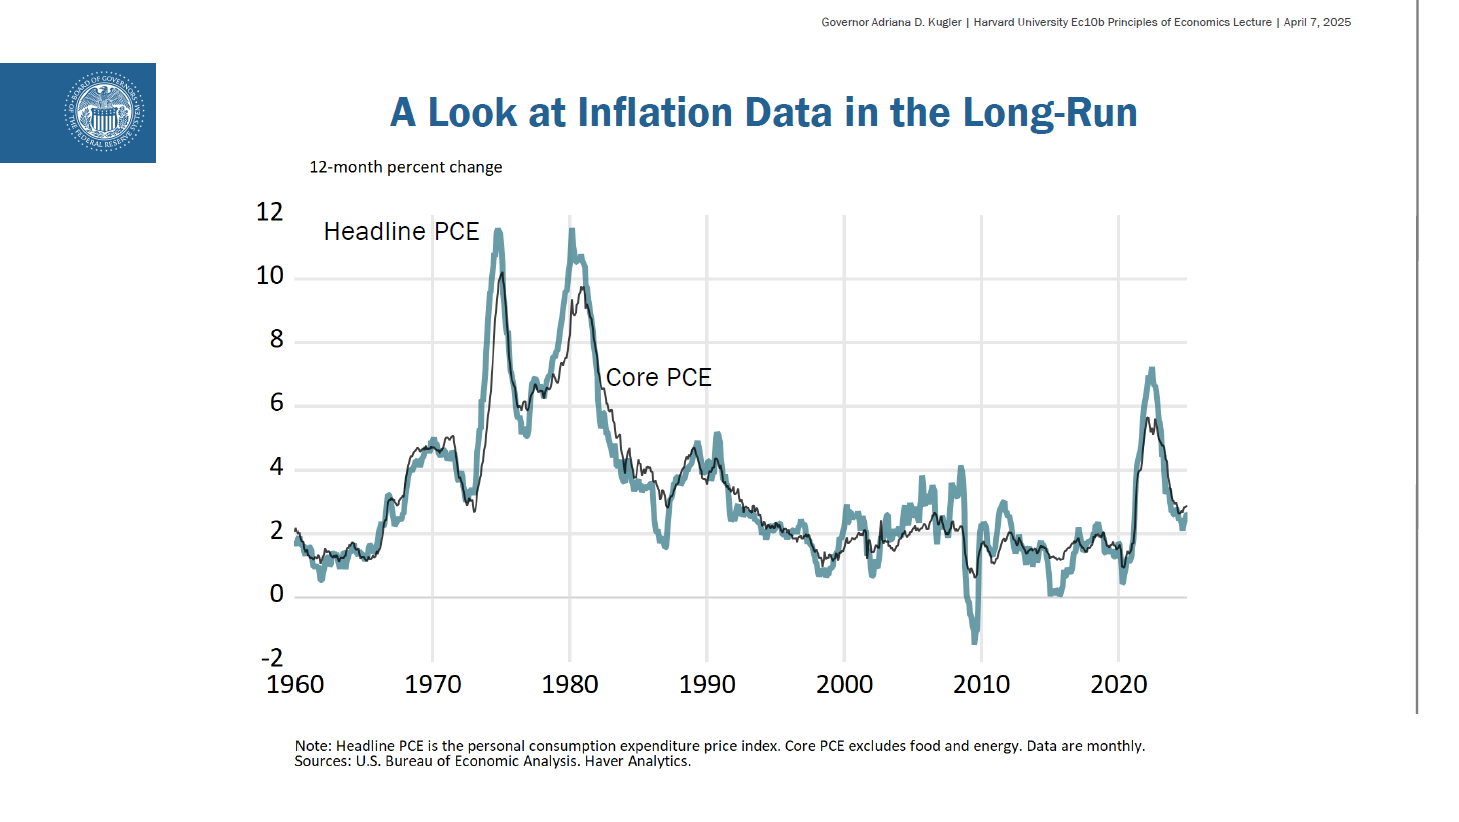
- Slide 3. A Look at Inflation Data in the Long-Run
- Slide 4. Inflation Waves
- Slide 5. Waves in Inflation Components
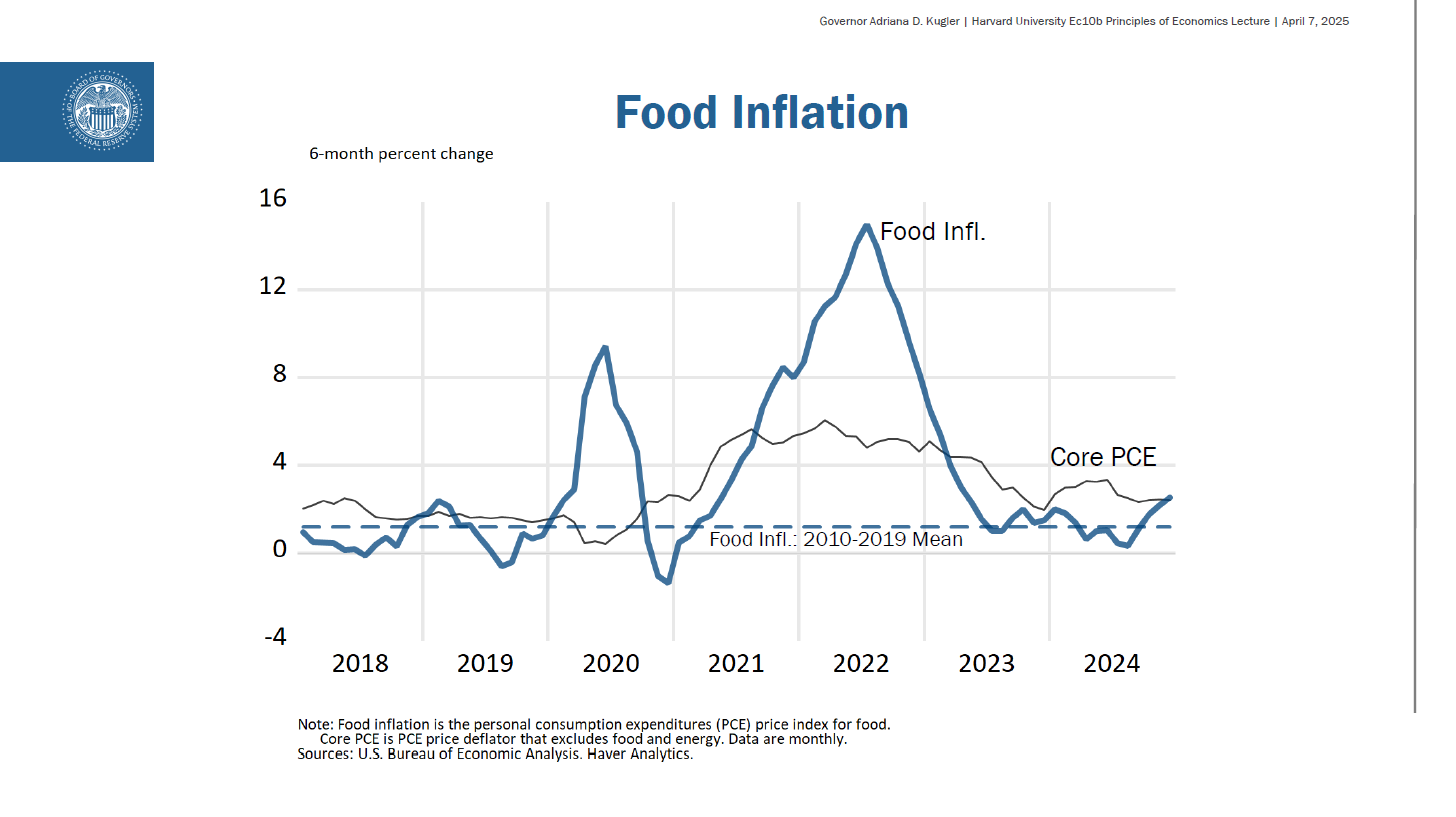
- Slide 6. Food Inflation
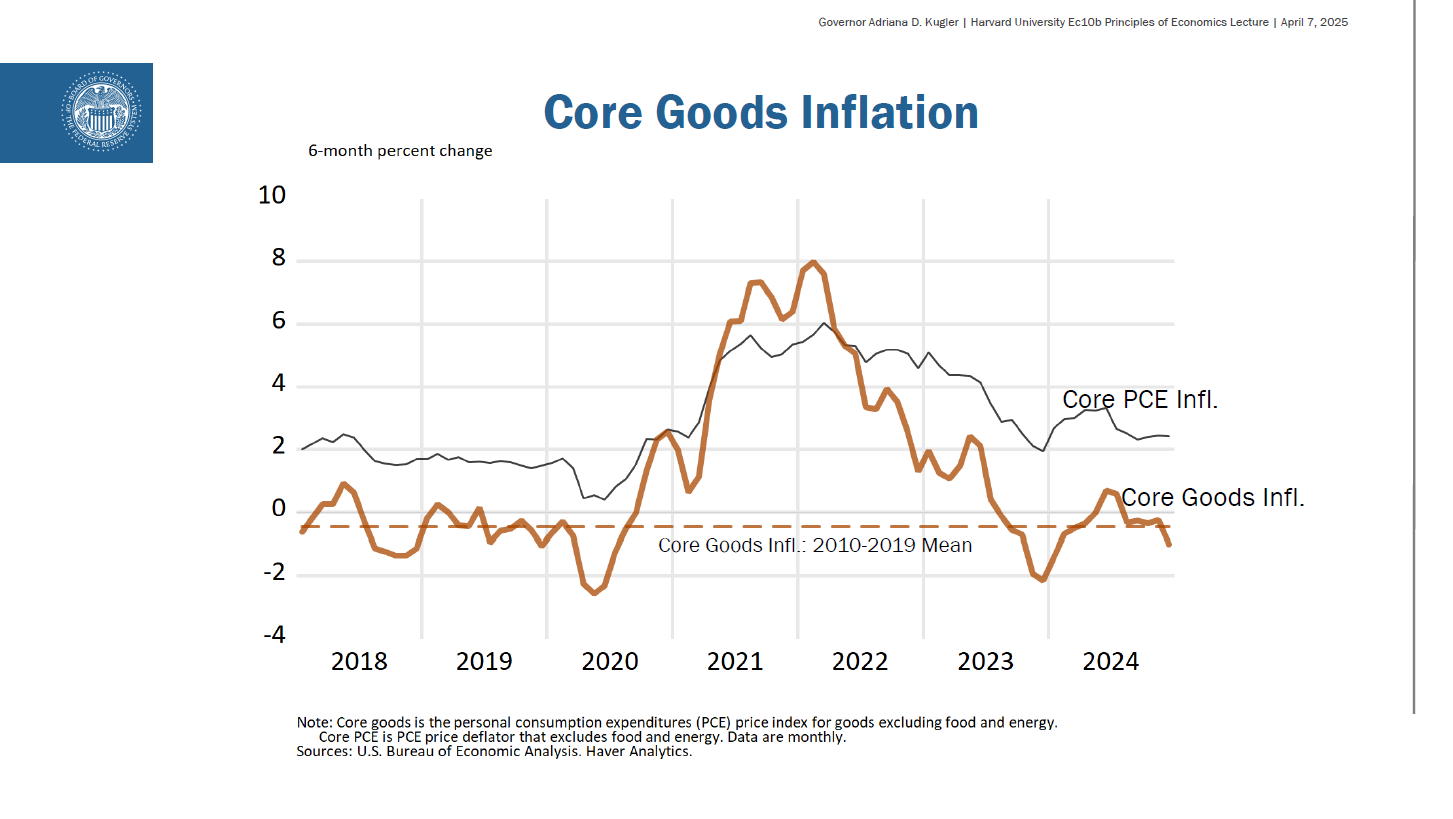
- Slide 7. Core Goods Inflation
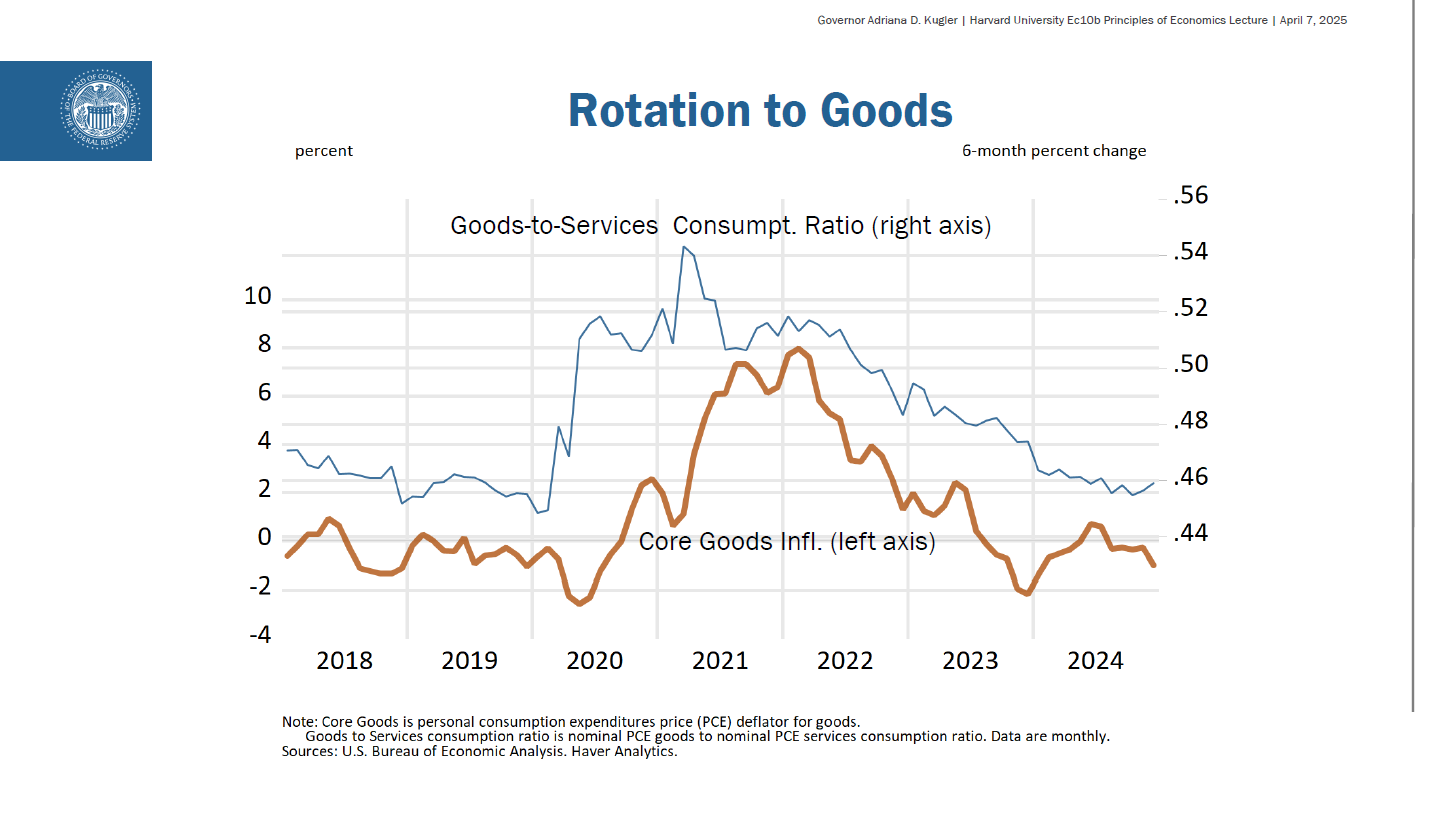
- Slide 8. Rotation to Goods
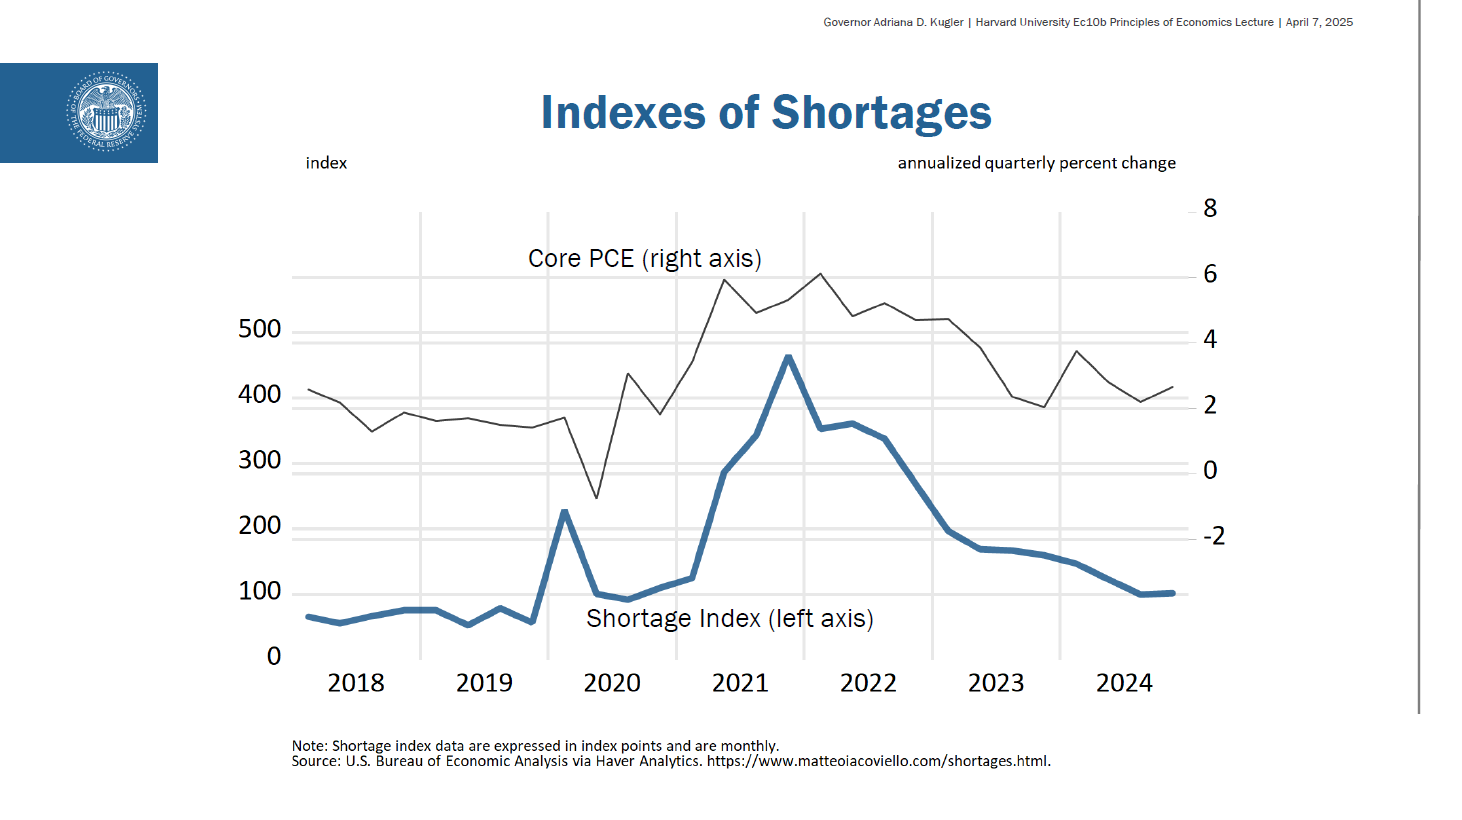
- Slide 9. Indexes of Shortages
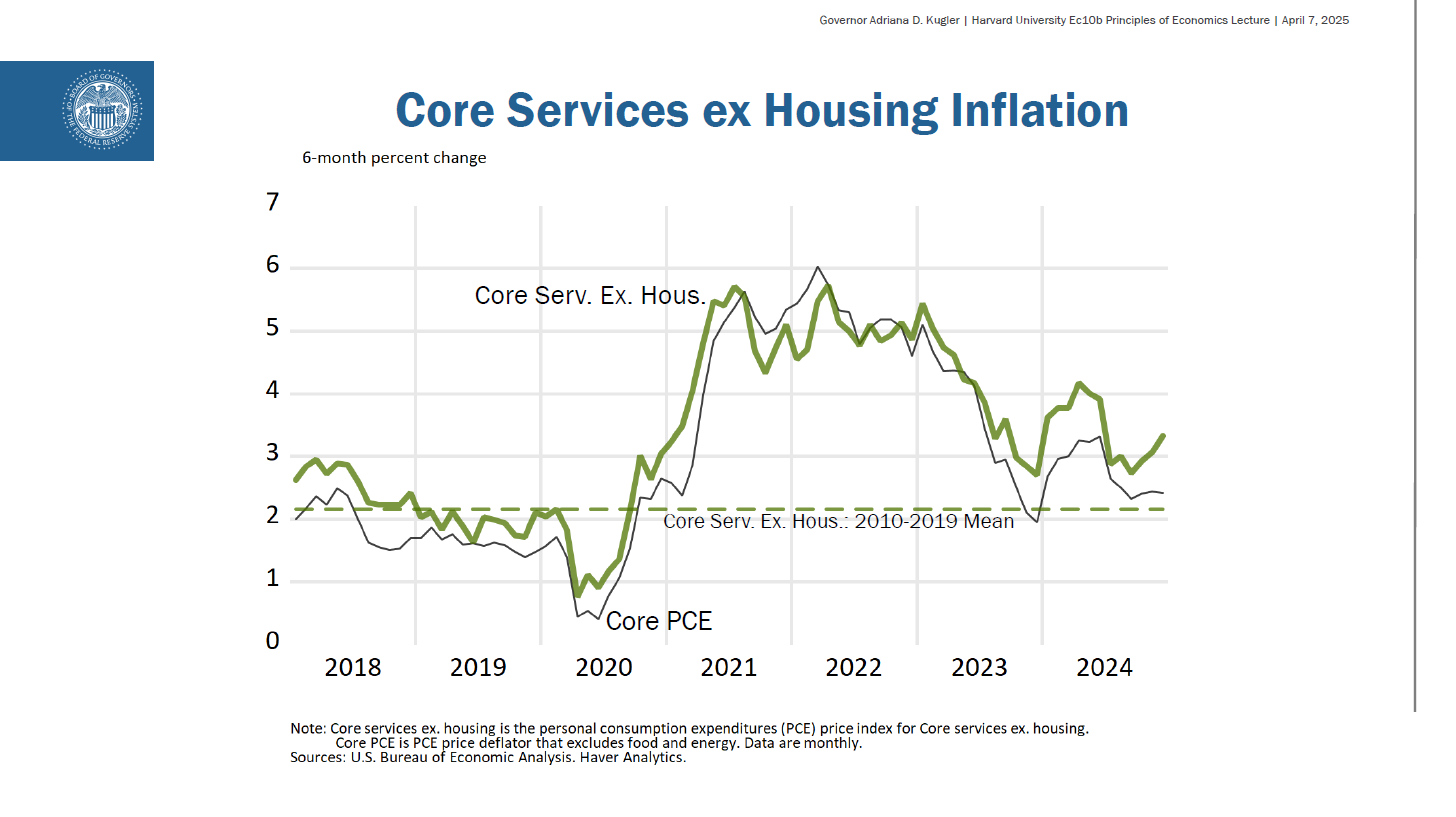
- Slide 10. Core Services ex Housing Inflation
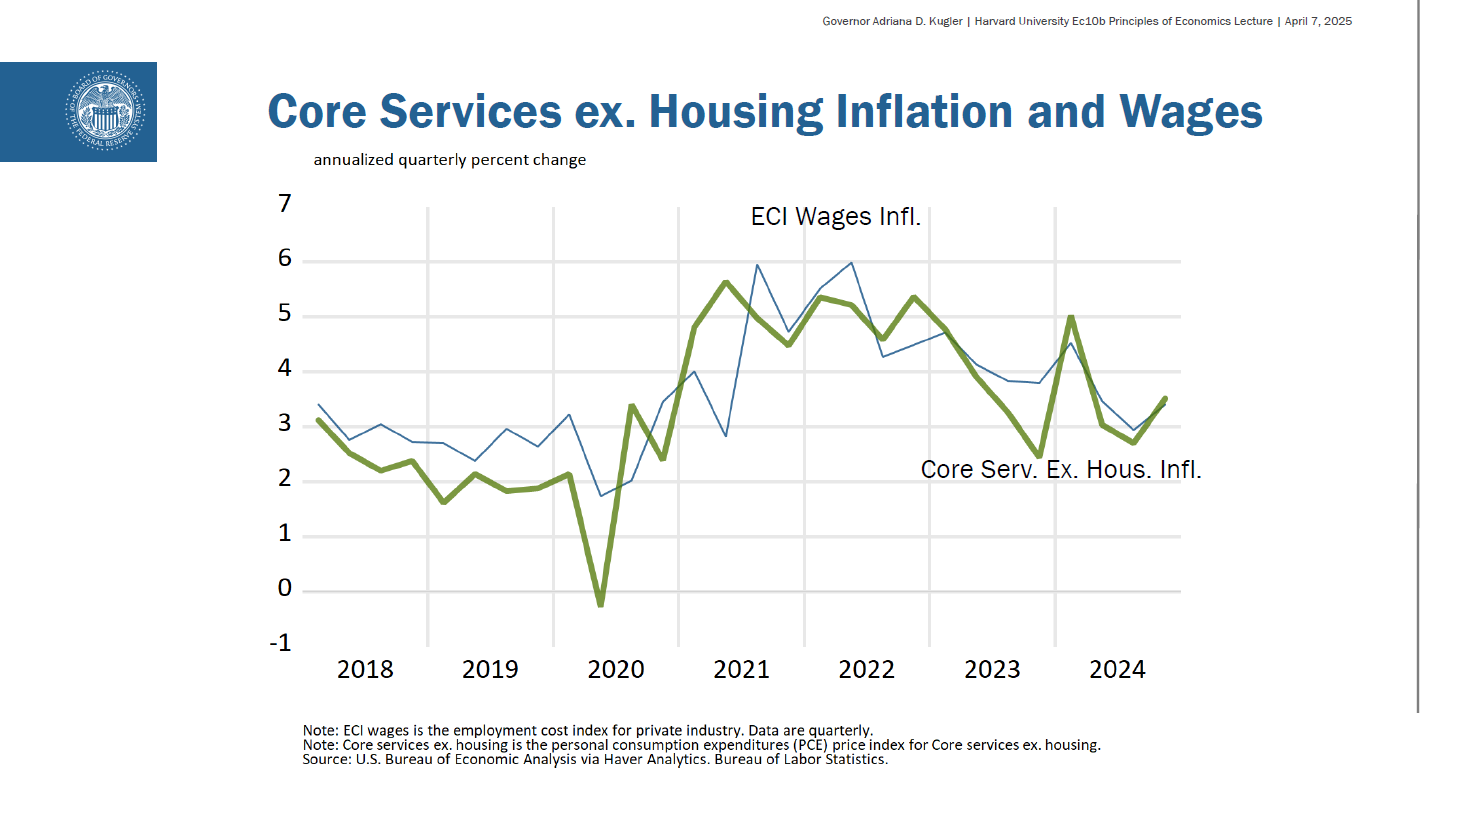
- Slide 11. Core Services ex. Housing Inflation and Wages
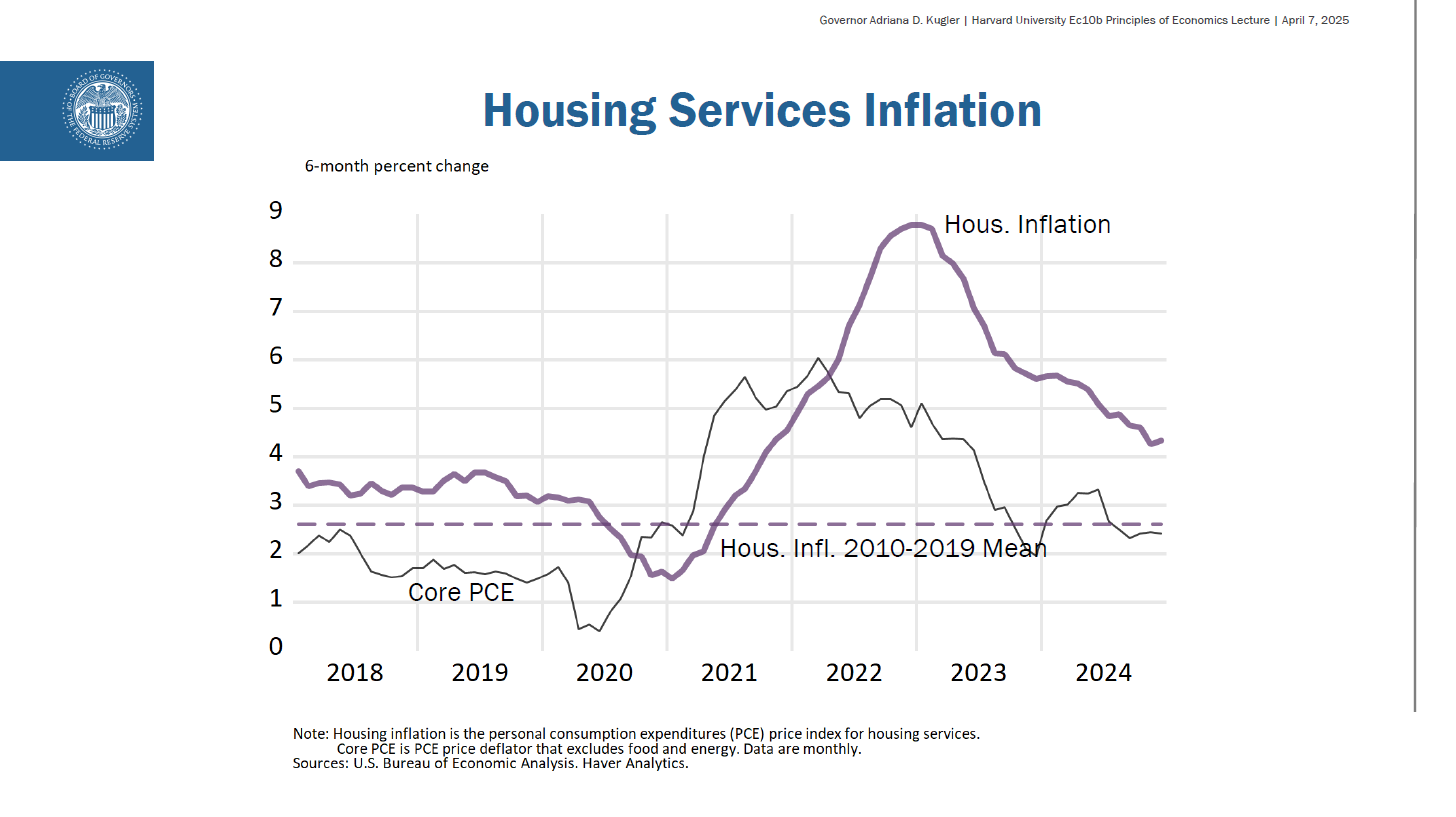
- Slide 12. Housing Services Inflation
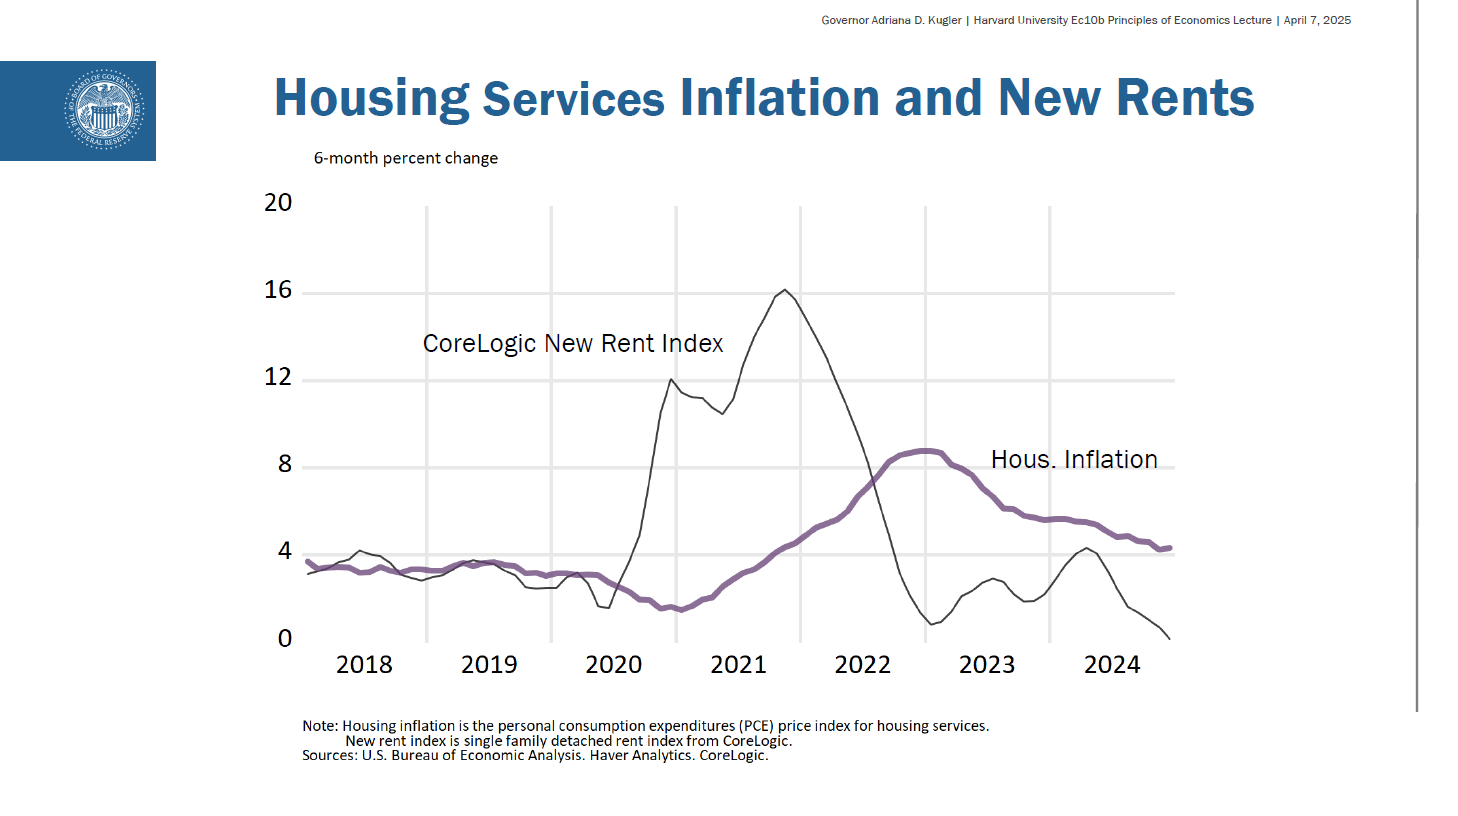
- Slide 13. Housing Services Inflation and New Rents
- Slide 14. The Phillips Curve(s)
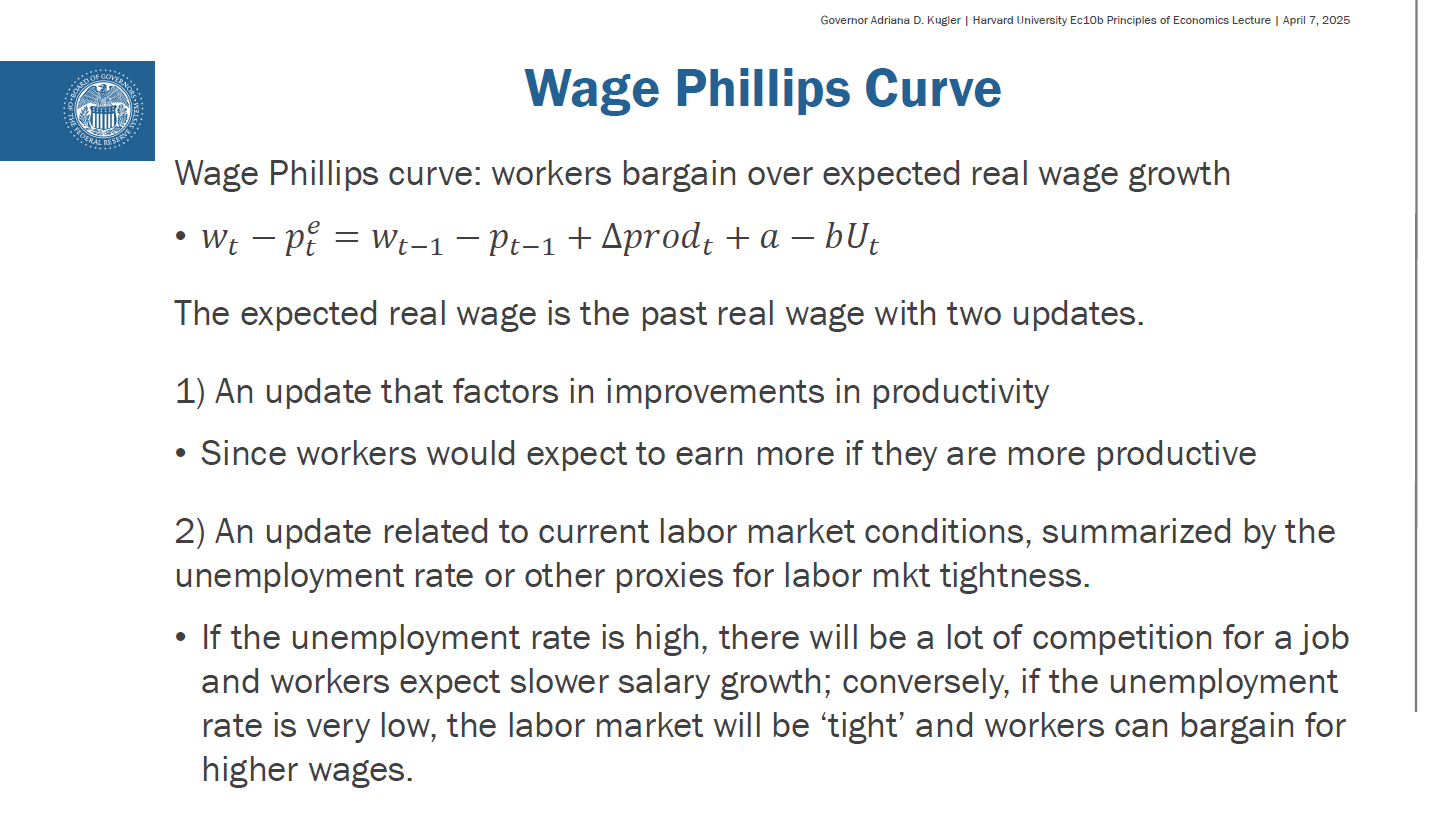
- Slide 15. Wage Phillips Curve
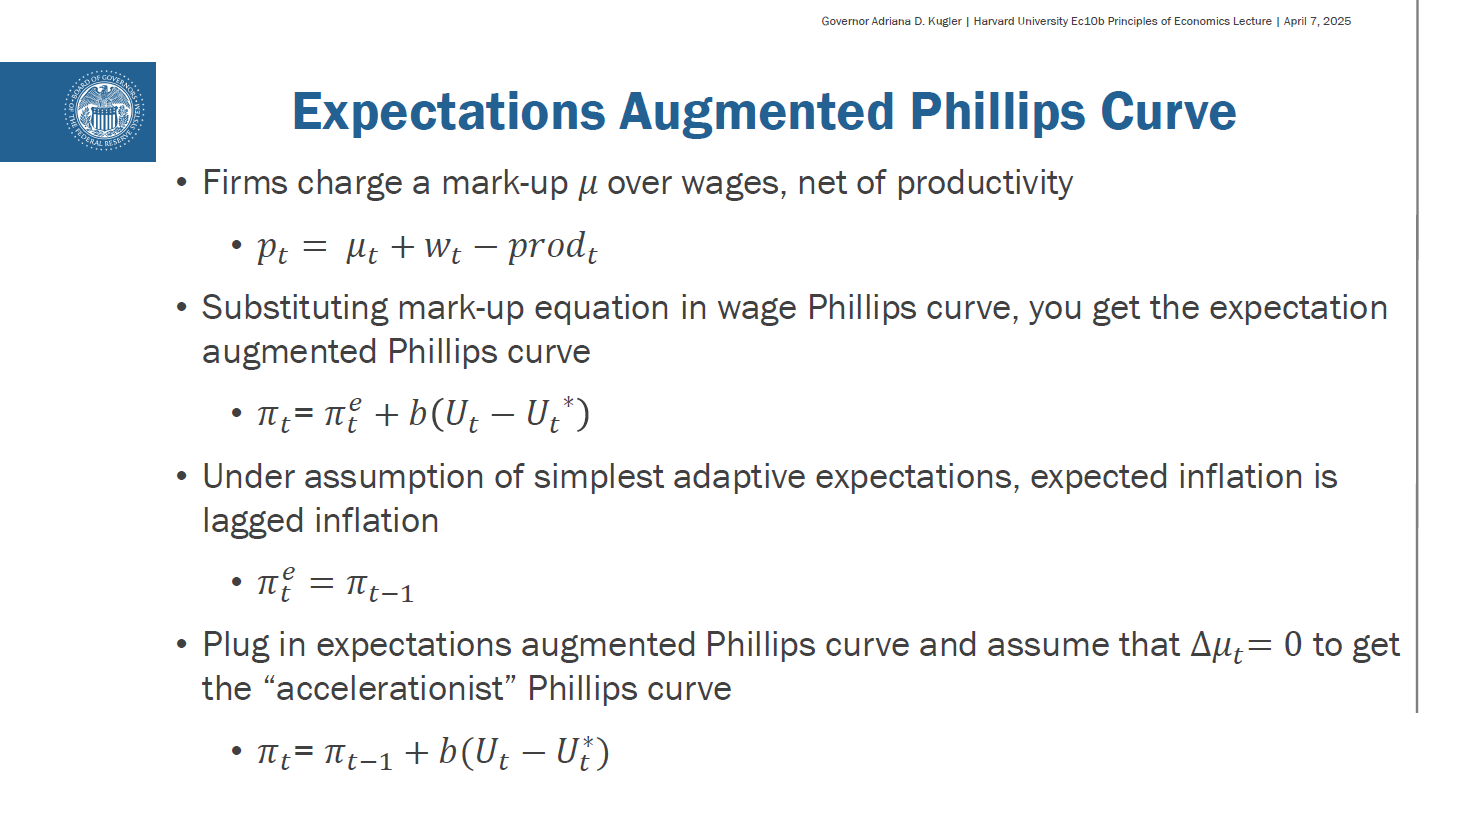
- Slide 16. Expectations Augmented Phillips Curve
- Slide 17. Some Empirical Results
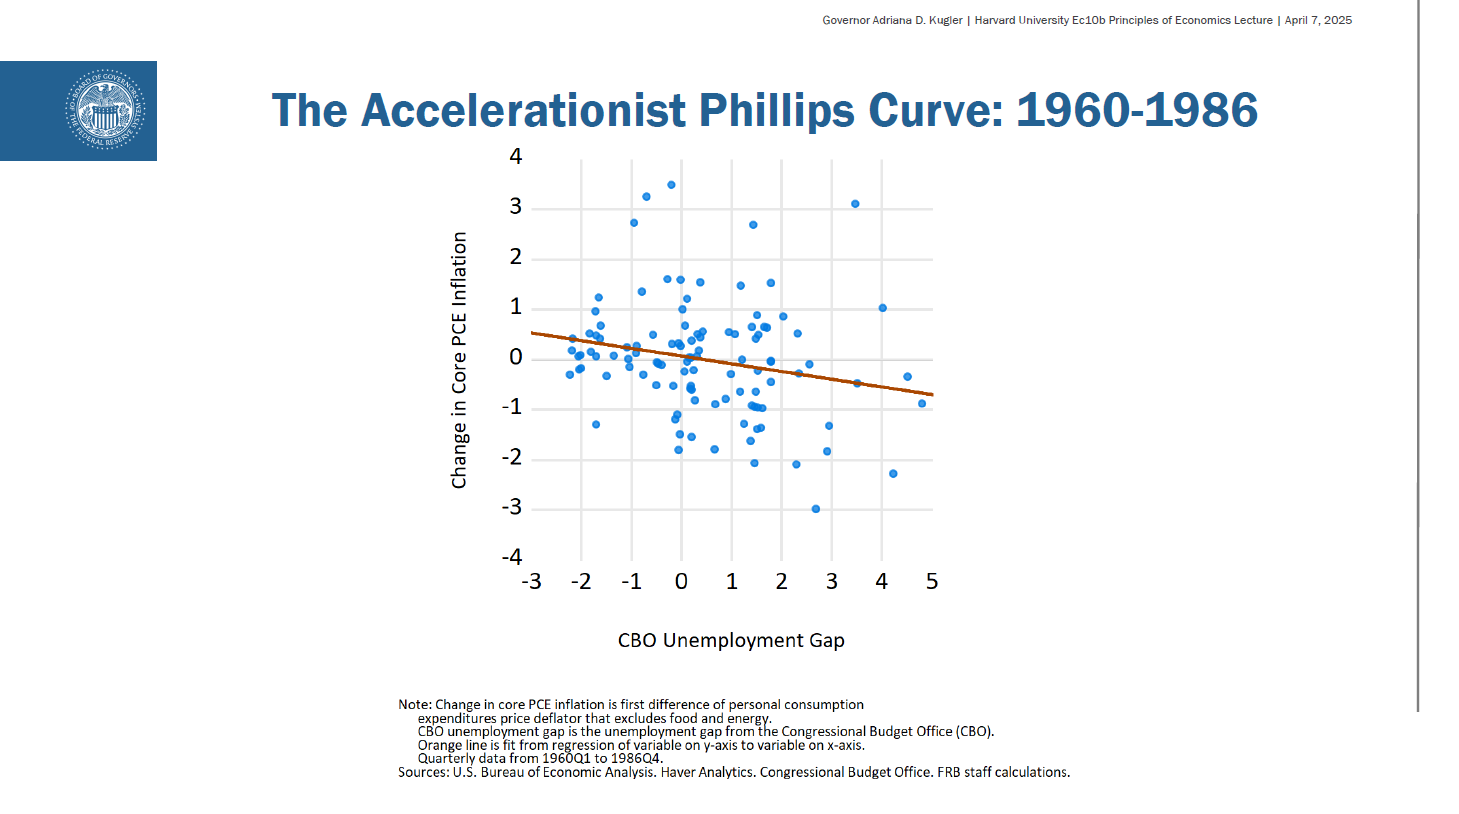
- Slide 18. The Accelerationist Phillips Curve: 1960-1986
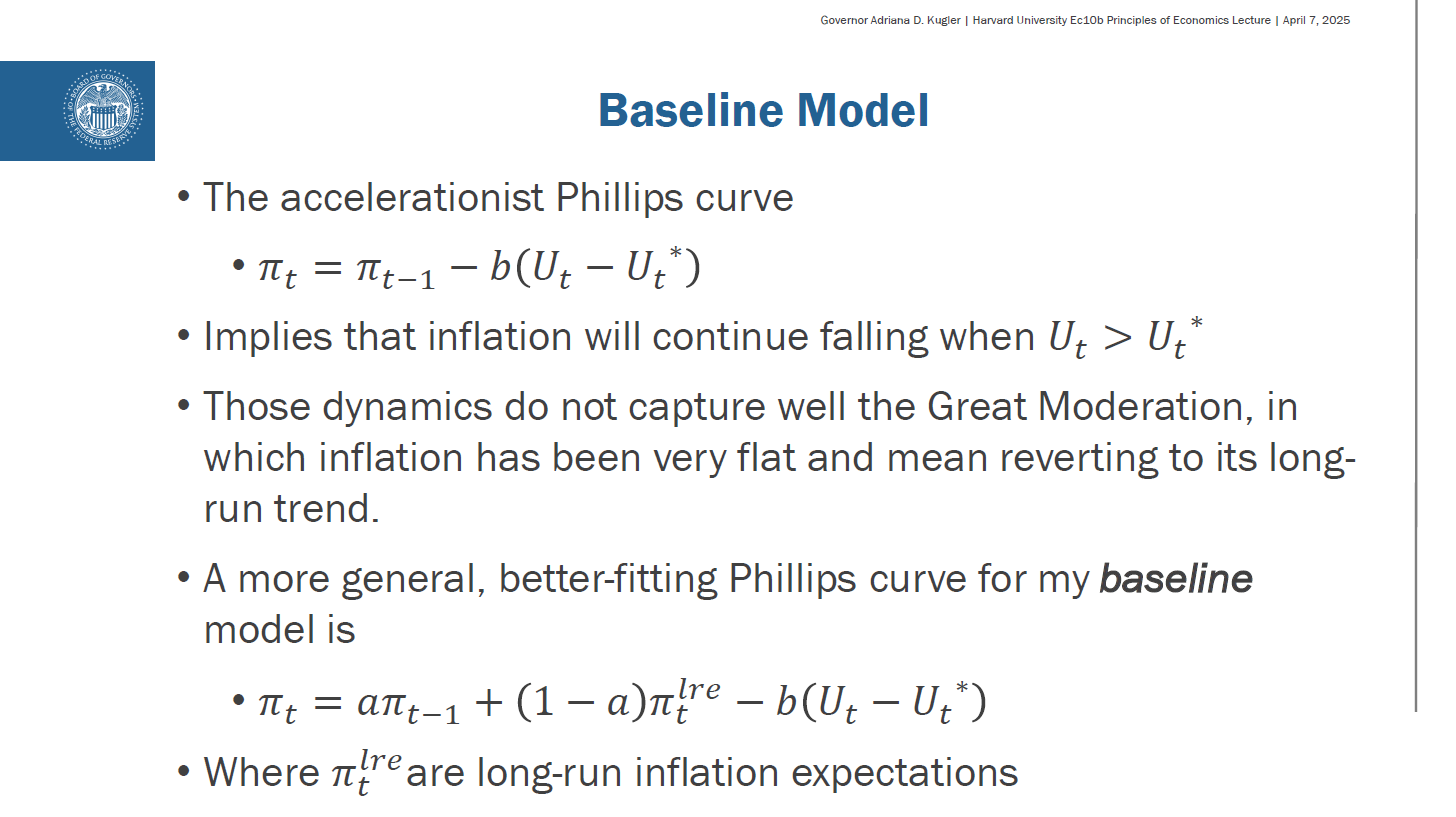
- Slide 19. Baseline Model
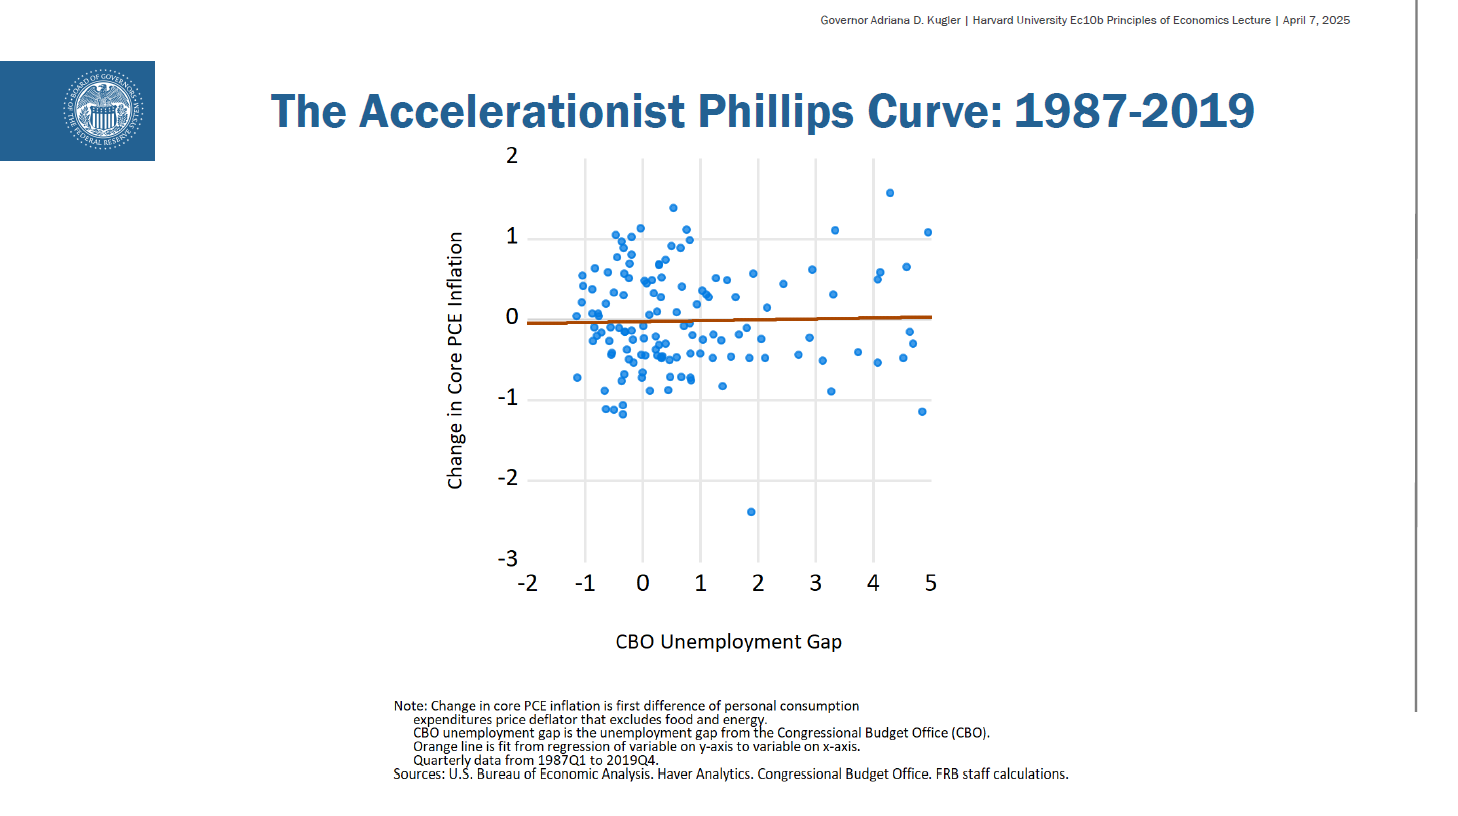
- Slide 20. The Accelerationist Phillips Curve: 1987-2019
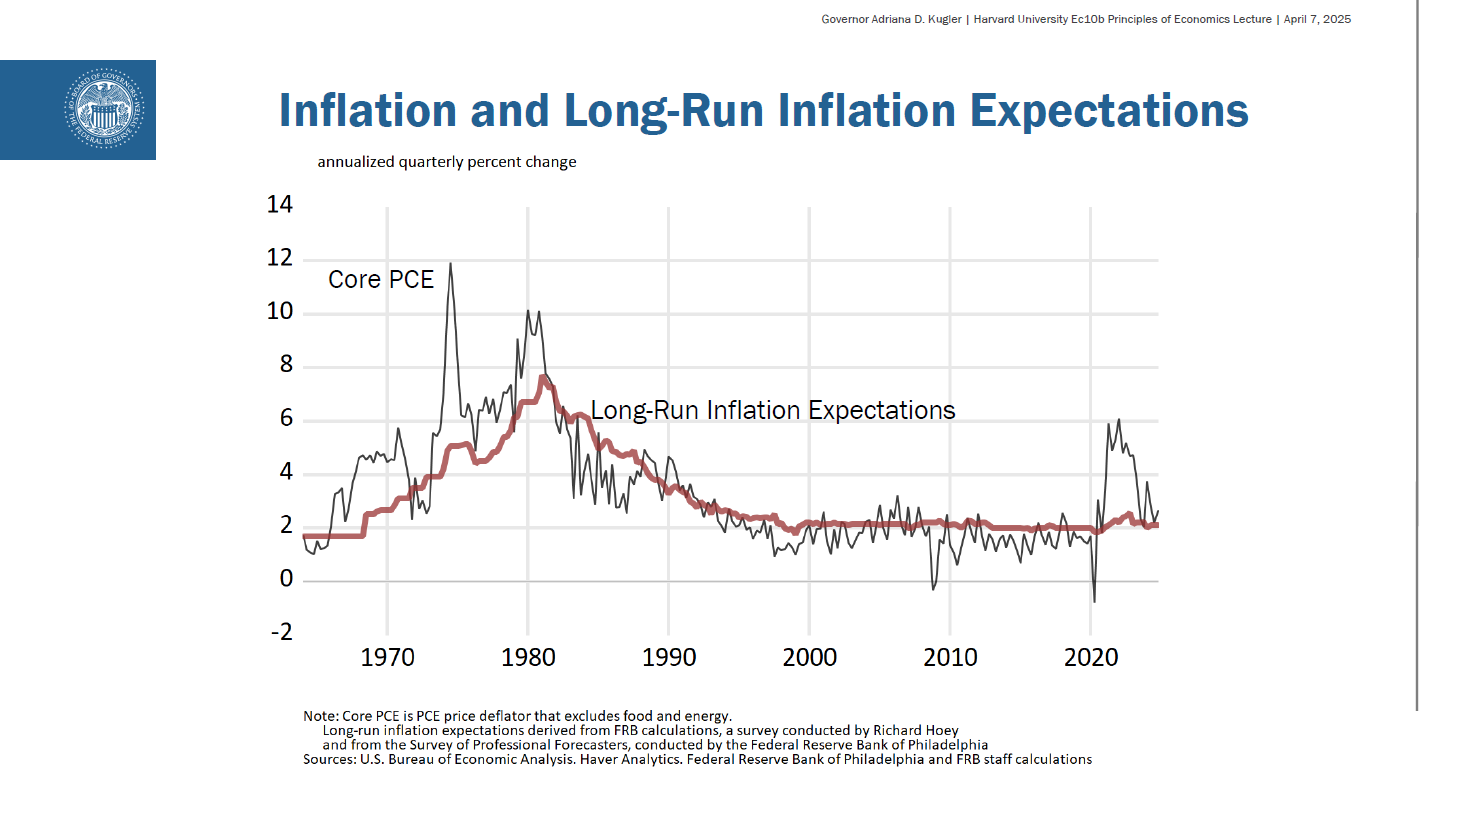
- Slide 21. Inflation and Long-Run Inflation Expectations
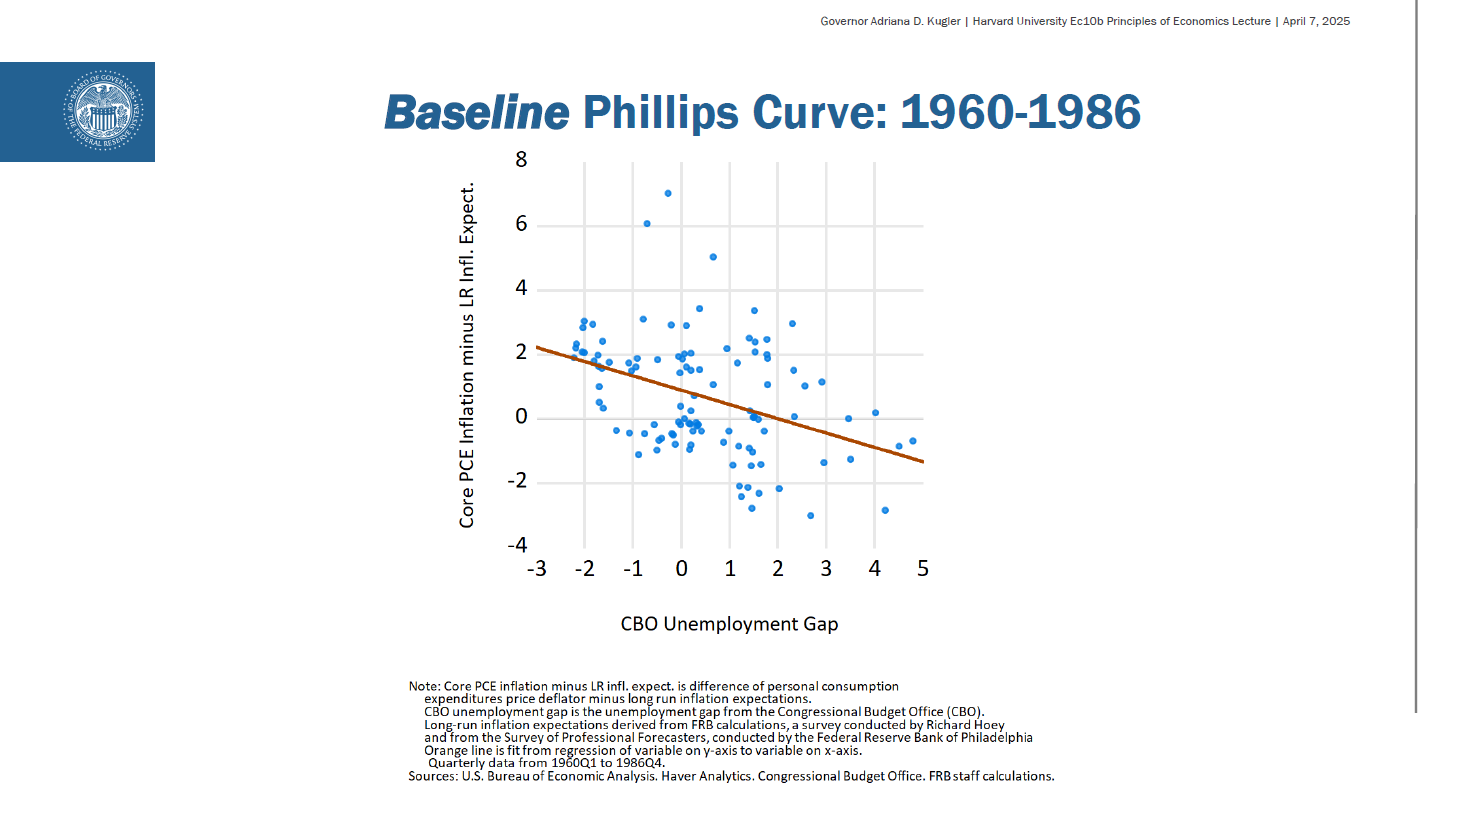
- Slide 22. Baseline Phillips Curve: 1960-1986
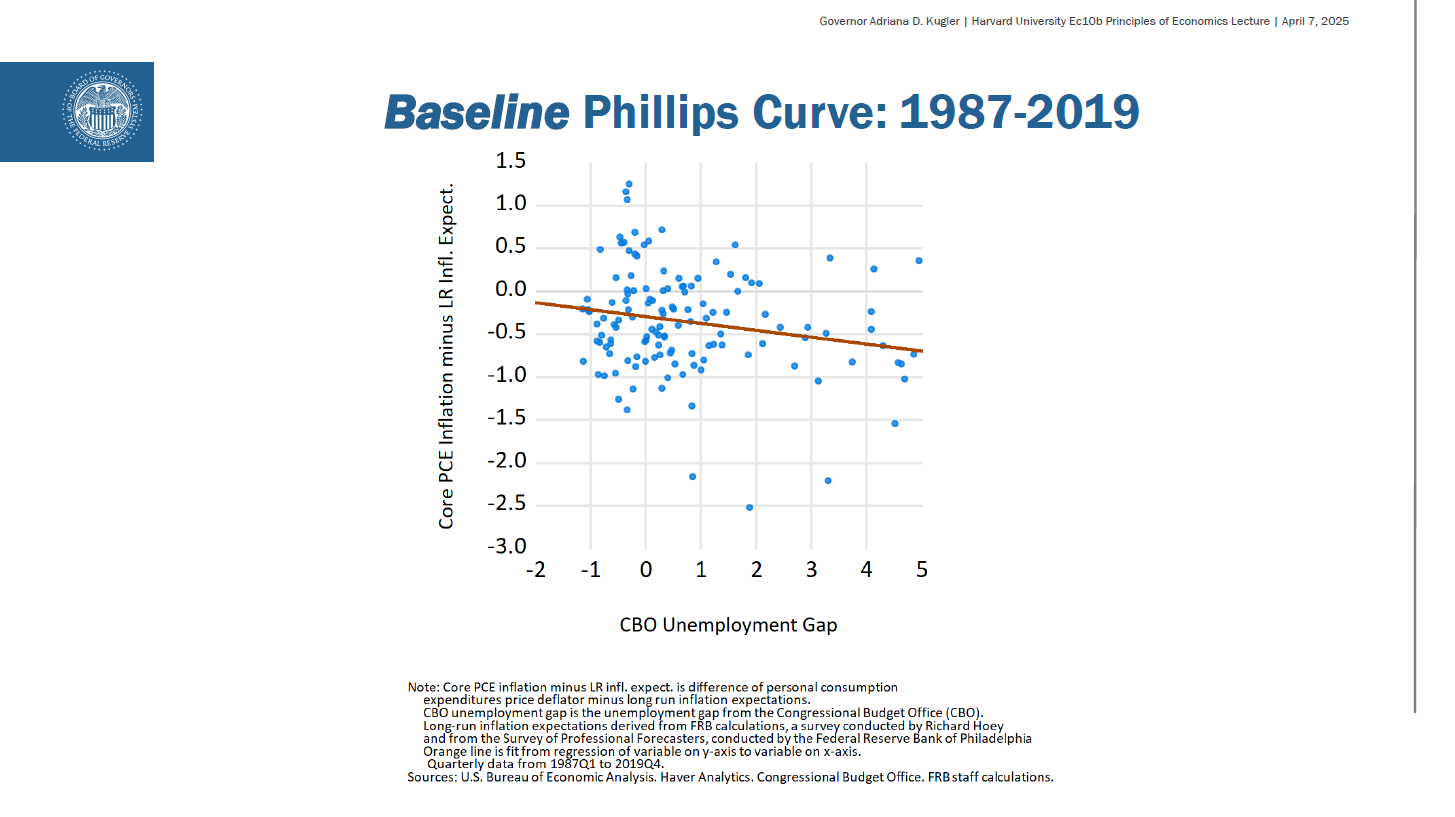
- Slide 23. Baseline Phillips Curve: 1987-2019
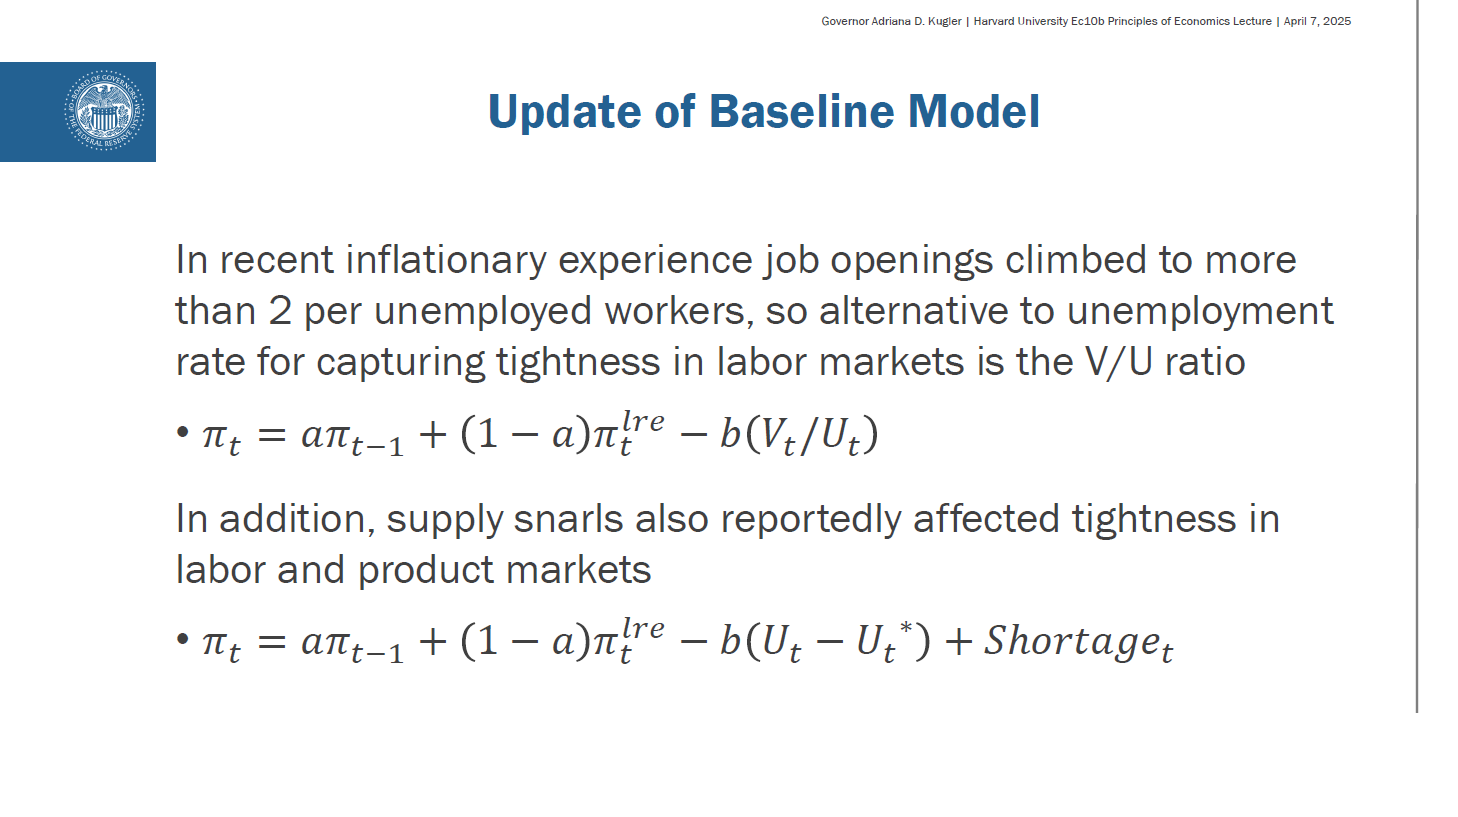
- Slide 24. Update of Baseline Model
- Slide 25. Additional Empirical Results
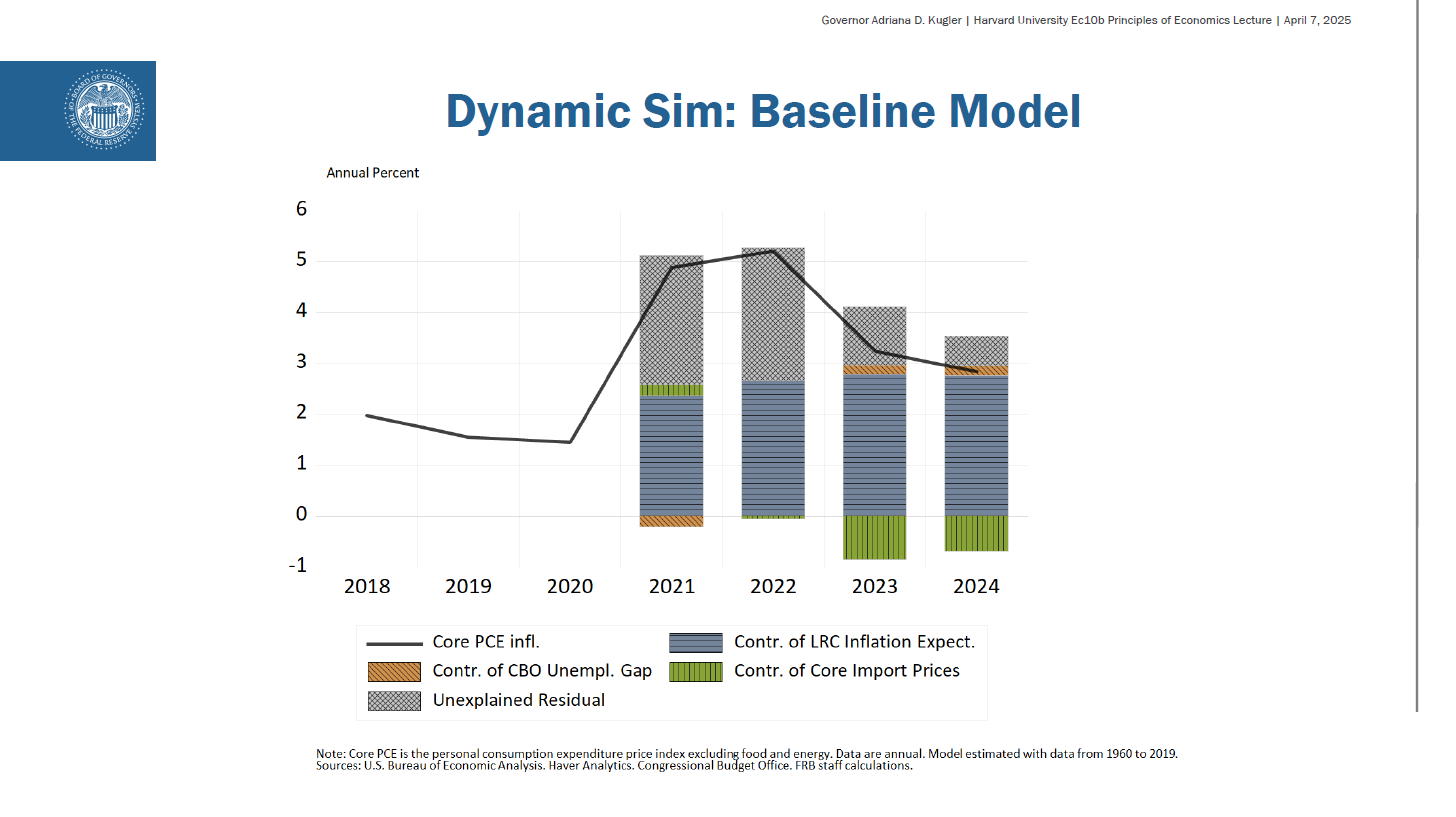
- Slide 26. Dynamic Sim: Baseline Model
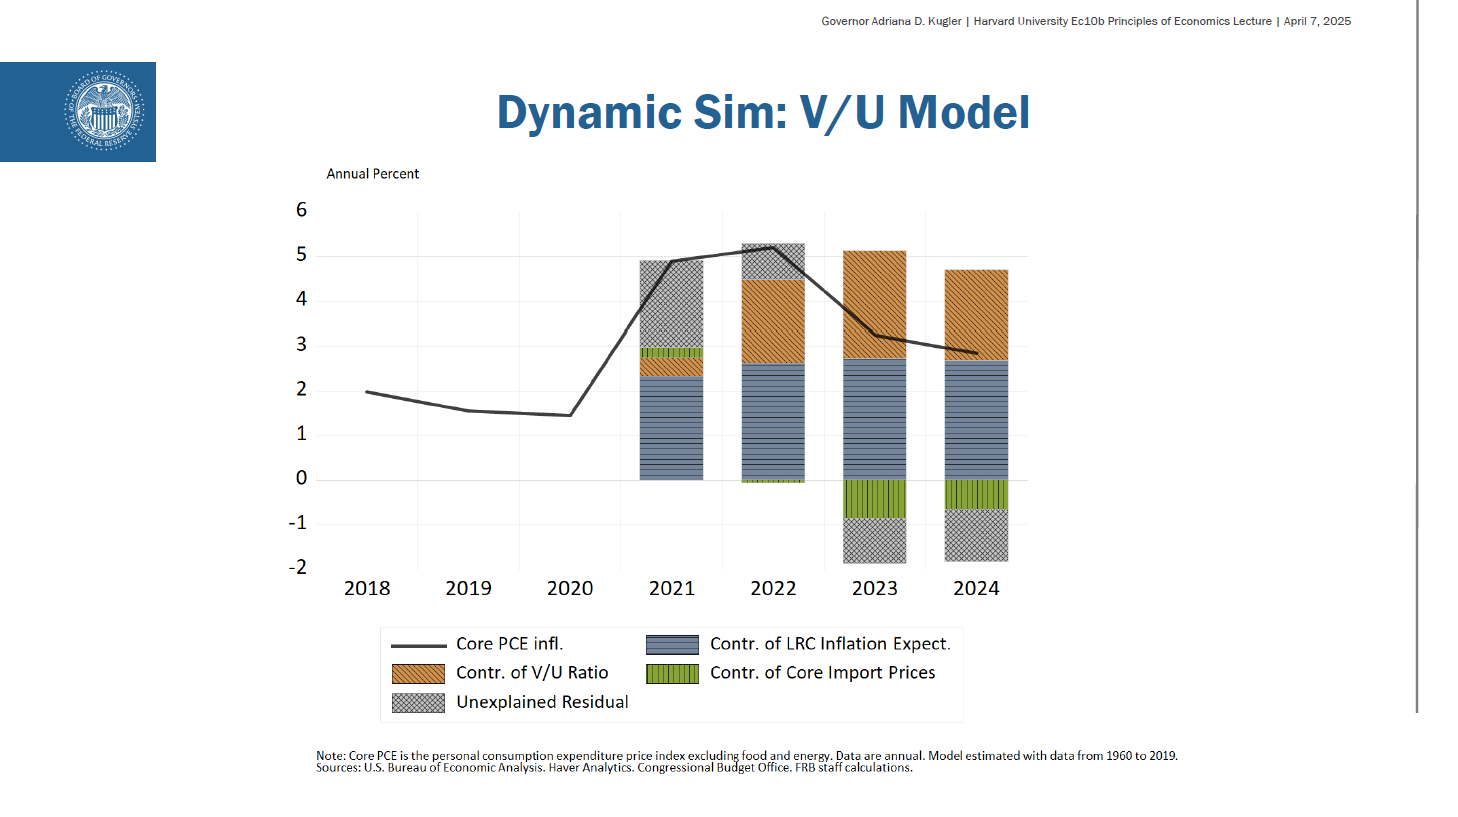
- Slide 27. Dynamic Sim: V/U Model
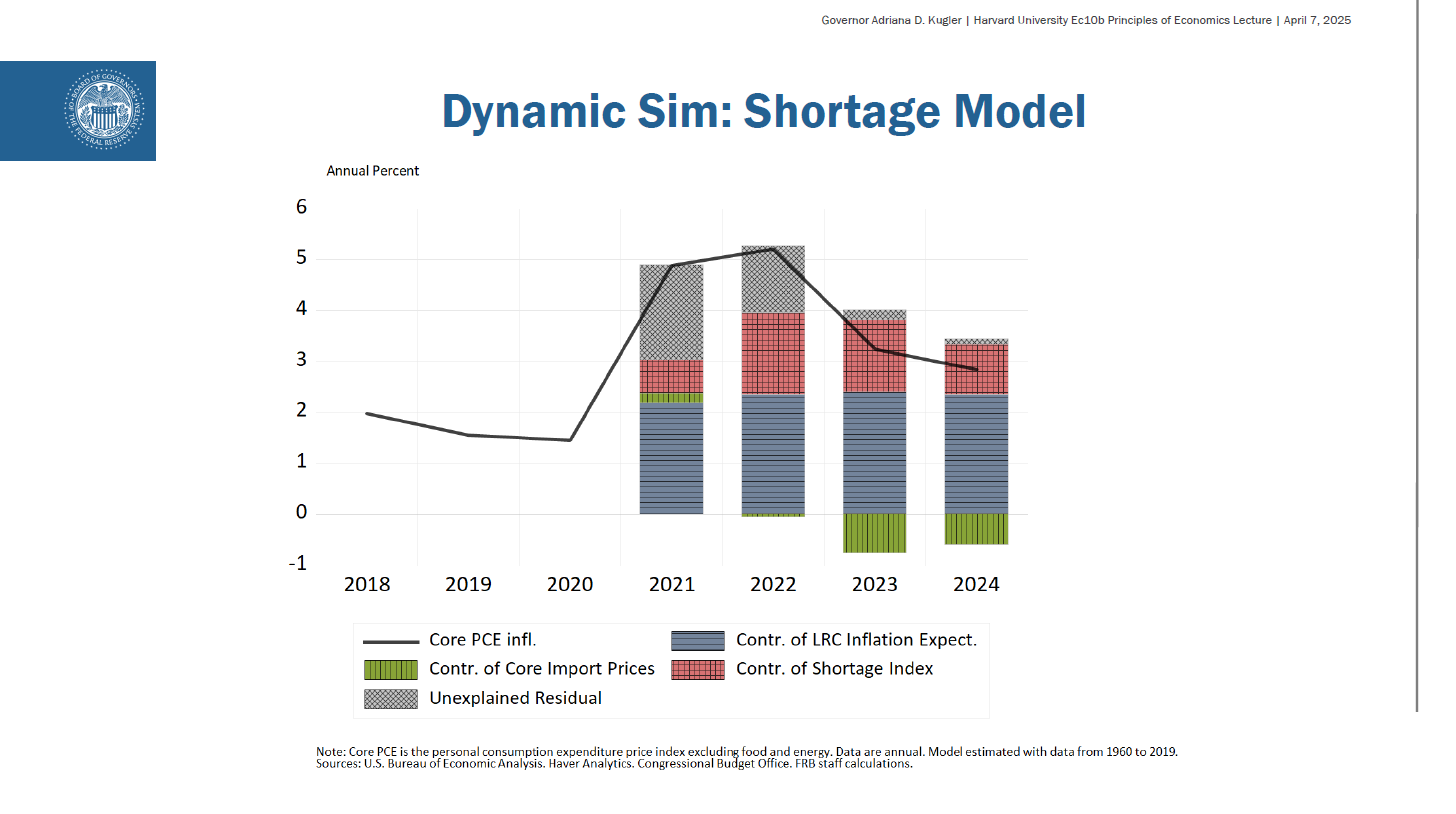
- Slide 28. Dynamic Sim: Shortage Model