October 17, 2014
Perspectives on Inequality and Opportunity from the Survey of Consumer Finances
Chair Janet L. Yellen
At the Conference on Economic Opportunity and Inequality, Federal Reserve Bank of Boston, Boston, Massachusetts
The distribution of income and wealth in the United States has been widening more or less steadily for several decades, to a greater extent than in most advanced countries.1 This trend paused during the Great Recession because of larger wealth losses for those at the top of the distribution and because increased safety-net spending helped offset some income losses for those below the top. But widening inequality resumed in the recovery, as the stock market rebounded, wage growth and the healing of the labor market have been slow, and the increase in home prices has not fully restored the housing wealth lost by the large majority of households for which it is their primary asset.
The extent of and continuing increase in inequality in the United States greatly concern me. The past several decades have seen the most sustained rise in inequality since the 19th century after more than 40 years of narrowing inequality following the Great Depression. By some estimates, income and wealth inequality are near their highest levels in the past hundred years, much higher than the average during that time span and probably higher than for much of American history before then.2 It is no secret that the past few decades of widening inequality can be summed up as significant income and wealth gains for those at the very top and stagnant living standards for the majority. I think it is appropriate to ask whether this trend is compatible with values rooted in our nation's history, among them the high value Americans have traditionally placed on equality of opportunity.
Some degree of inequality in income and wealth, of course, would occur even with completely equal opportunity because variations in effort, skill, and luck will produce variations in outcomes. Indeed, some variation in outcomes arguably contributes to economic growth because it creates incentives to work hard, get an education, save, invest, and undertake risk. However, to the extent that opportunity itself is enhanced by access to economic resources, inequality of outcomes can exacerbate inequality of opportunity, thereby perpetuating a trend of increasing inequality. Such a link is suggested by the "Great Gatsby Curve," the finding that, among advanced economies, greater income inequality is associated with diminished intergenerational mobility.3 In such circumstances, society faces difficult questions of how best to fairly and justly promote equal opportunity. My purpose today is not to provide answers to these contentious questions, but rather to provide a factual basis for further discussion. I am pleased that this conference will focus on equality of economic opportunity and on ways to better promote it.
In my remarks, I will review trends in income and wealth inequality over the past several decades, then identify and discuss four sources of economic opportunity in America--think of them as "building blocks" for the gains in income and wealth that most Americans hope are within reach of those who strive for them. The first two are widely recognized as important sources of opportunity: resources available for children and affordable higher education. The second two may come as more of a surprise: business ownership and inheritances. Like most sources of wealth, family ownership of businesses and inheritances are concentrated among households at the top of the distribution. But both of these are less concentrated and more broadly distributed than other forms of wealth, and there is some basis for thinking that they may also play a role in providing economic opportunities to a considerable number of families below the top.
In focusing on these four building blocks, I do not mean to suggest that they account for all economic opportunity, but I do believe they are all significant sources of opportunity for individuals and their families to improve their economic circumstances.
Income and Wealth Inequality in the Survey of Consumer Finances
I will start with the basics about widening inequality, drawing heavily on a trove of data generated by the Federal Reserve's triennial Survey of Consumer Finances (SCF), the latest of which was conducted in 2013 and published last month.4 The SCF is broadly consistent with other data that show widening wealth and income inequality over the past several decades, but I am employing the SCF because it offers the added advantage of specific detail on income, wealth, and debt for each of 6,000 households surveyed.5 This detail from family balance sheets provides a glimpse of the relative access to the four sources of opportunity I will discuss.
While the recent trend of widening income and wealth inequality is clear, the implications for a particular family partly depend on whether that family's living standards are rising or not as its relative position changes. There have been some times of relative prosperity when income has grown for most households but inequality widened because the gains were proportionally larger for those at the top; widening inequality might not be as great a concern if living standards improve for most families. That was the case for much of the 1990s, when real incomes were rising for most households. At other times, however, inequality has widened because income and wealth grew for those at the top and stagnated or fell for others. And at still other times, inequality has widened when incomes were falling for most households, but the declines toward the bottom were proportionally larger. Unfortunately, the past several decades of widening inequality has often involved stagnant or falling living standards for many families.
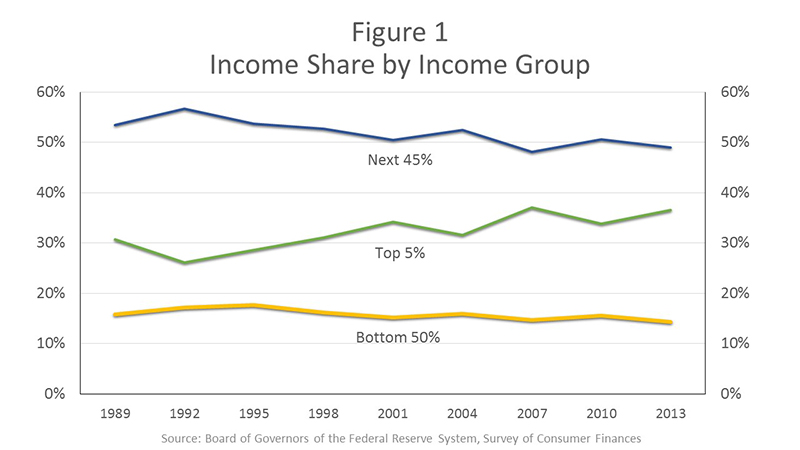
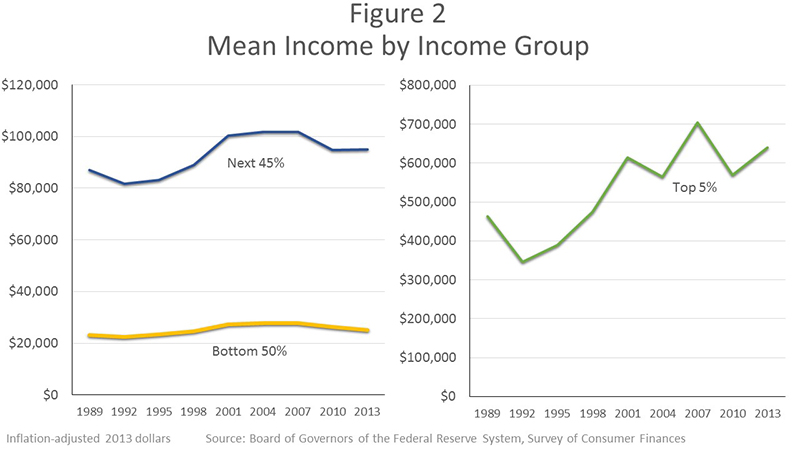
Since the survey began in its current form in 1989, the SCF has shown a rise in the concentration of income in the top few percent of households, as shown in figure 1.6 By definition, of course, the share of all income held by the rest, the vast majority of households, has fallen by the same amount.7 This concentration was the result of income and living standards rising much more quickly for those at the top. After adjusting for inflation, the average income of the top 5 percent of households grew by 38 percent from 1989 to 2013, as we can see in figure 2. By comparison, the average real income of the other 95 percent of households grew less than 10 percent. Income inequality narrowed slightly during the Great Recession, as income fell more for the top than for others, but resumed widening in the recovery, and by 2013 it had nearly returned to the pre-recession peak.8
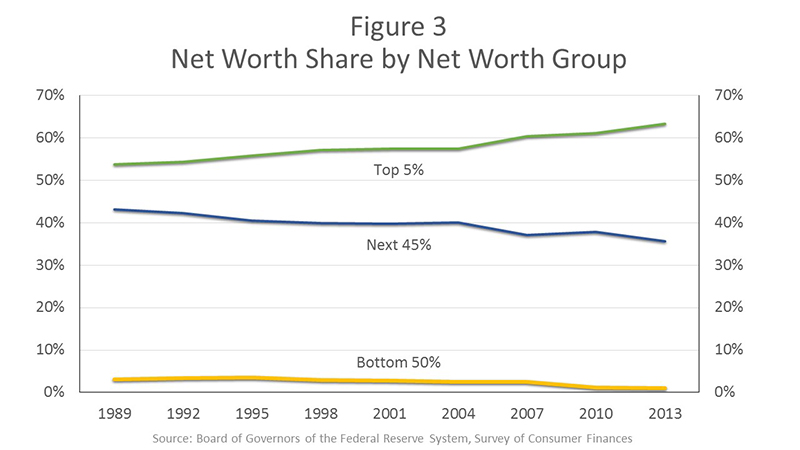
The distribution of wealth is even more unequal than that of income, and the SCF shows that wealth inequality has increased more than income inequality since 1989. As shown in figure 3, the wealthiest 5 percent of American households held 54 percent of all wealth reported in the 1989 survey. Their share rose to 61 percent in 2010 and reached 63 percent in 2013. By contrast, the rest of those in the top half of the wealth distribution--families that in 2013 had a net worth between $81,000 and $1.9 million--held 43 percent of wealth in 1989 and only 36 percent in 2013.
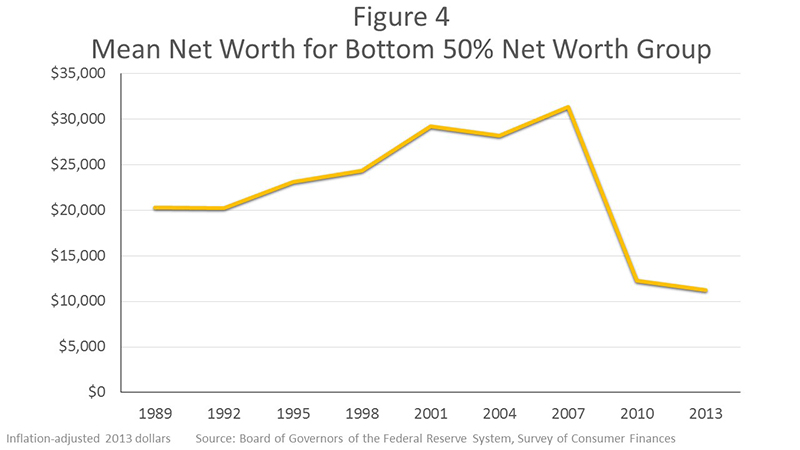
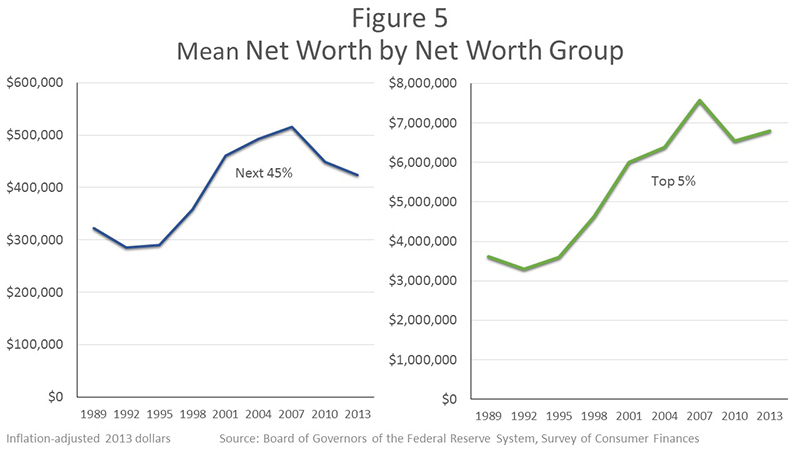
The lower half of households by wealth held just 3 percent of wealth in 1989 and only 1 percent in 2013. To put that in perspective, figure 4 shows that the average net worth of the lower half of the distribution, representing 62 million households, was $11,000 in 2013.9 About one-fourth of these families reported zero wealth or negative net worth, and a significant fraction of those said they were "underwater" on their home mortgages, owing more than the value of the home.10 This $11,000 average is 50 percent lower than the average wealth of the lower half of families in 1989, adjusted for inflation. Average real wealth rose gradually for these families for most of those years, then dropped sharply after 2007. Figure 5 shows that average wealth also grew steadily for the "next 45" percent of households before the crisis but didn't fall nearly as much afterward. Those next 45 households saw their wealth, measured in 2013 dollars, grow from an average of $323,000 in 1989 to $516,000 in 2007 and then fall to $424,000 in 2013, a net gain of about one-third over 24 years. Meanwhile, the average real wealth of families in the top 5 percent has nearly doubled, on net--from $3.6 million in 1989 to $6.8 million in 2013.
Housing wealth--the net equity held by households, consisting of the value of their homes minus their mortgage debt--is the most important source of wealth for all but those at the very top.11 It accounted for three-fifths of wealth in 2013 for the lower half of families and two-fifths of wealth for the next 45. But housing wealth was only one-fifth of total wealth for the top 5 percent of families. The share of housing in total net worth for all three groups has not changed much since 1989.
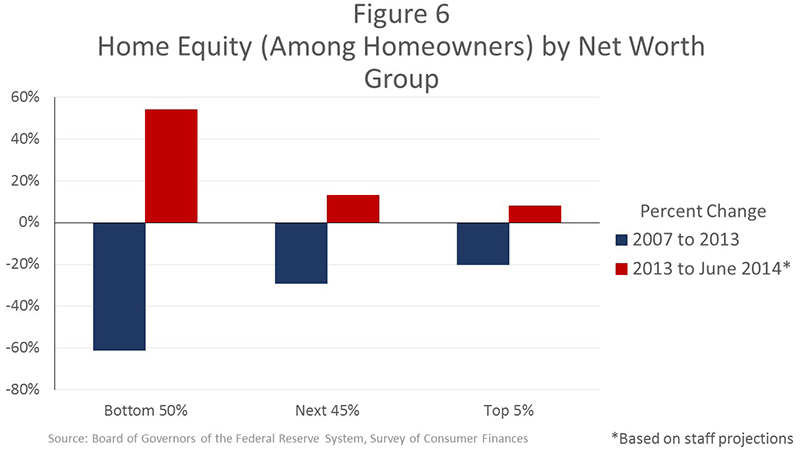
Since housing accounts for a larger share of wealth for those in the bottom half of the wealth distribution, their overall wealth is affected more by changes in home prices. Furthermore, homeowners in the bottom half have been more highly leveraged on their homes, amplifying this difference. As a result, while the SCF shows that all three groups saw proportionally similar increases and subsequent declines in home prices from 1989 to 2013, the effects on net worth were greater for those in the bottom half of households by wealth. Foreclosures and the dramatic fall in house prices affected many of these families severely, pushing them well down the wealth distribution. Figure 6 shows that homeowners in the bottom half of households by wealth reported 61 percent less home equity in 2013 than in 2007. The next 45 reported a 29 percent loss of housing wealth, and the top 5 lost 20 percent.
Fortunately, rebounding housing prices in 2013 and 2014 have restored a good deal of the loss in housing wealth, with the largest gains for those toward the bottom. Based on rising home prices alone and not counting possible changes in mortgage debt or other factors, Federal Reserve staff estimate that between 2013 and mid-2014, average home equity rose 49 percent for the lowest half of families by wealth that own homes.12 The estimated gains are somewhat less for those with greater wealth.13 Homeowners in the bottom 50, which had an average overall net worth of $25,000 in 2013, would have seen their net worth increase to an average of $33,000 due solely to home price gains since 2013, a 32 percent increase.
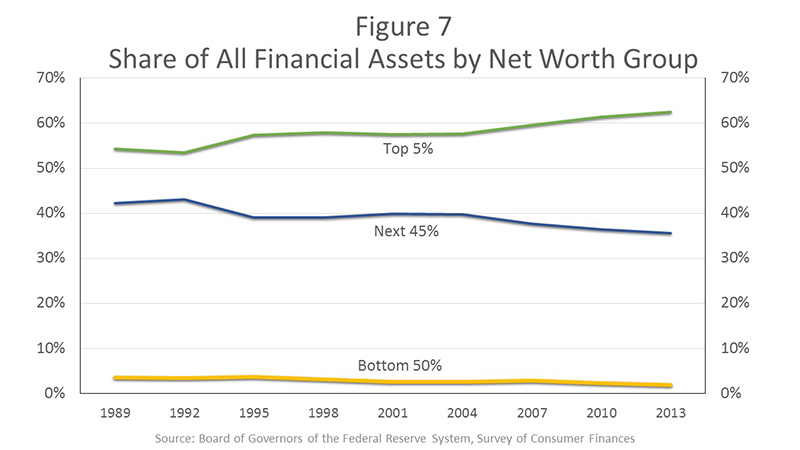
Another major source of wealth for many families is financial assets, including stocks, bonds, mutual funds, and private pensions.14 Figure 7 shows that the wealthiest 5 percent of households held nearly two-thirds of all such assets in 2013, the next 45 percent of families held about one-third, and the bottom half of households, just 2 percent. This figure may look familiar, since the distribution of financial wealth has concentrated at the top since 1989 at rates similar to those for overall wealth, which we saw in figure 3.15
Those are the basics on wealth and income inequality from the SCF. Other research tells us that inequality tends to persist from one generation to the next. For example, one study that divides households by income found that 4 in 10 children raised in families in the lowest-income fifth of households remain in that quintile as adults.16 Fewer than 1 in 10 children of families at the bottom later reach the top quintile. The story is flipped for children raised in the highest-income households: When they grow up, 4 in 10 stay at the top and fewer than 1 in 10 fall to the bottom.
Research also indicates that economic mobility in the United States has not changed much in the last several decades; that mobility is lower in the United States than in most other advanced countries; and, as I noted earlier, that economic mobility and income inequality among advanced countries are negatively correlated.17
Four Building Blocks of Opportunity
An important factor influencing intergenerational mobility and trends in inequality over time is economic opportunity. While we can measure overall mobility and inequality, summarizing opportunity is harder, which is why I intend to focus on some important sources of opportunity--the four building blocks I mentioned earlier.
Two of those are so significant that you might call them "cornerstones" of opportunity, and you will not be surprised to hear that both are largely related to education. The first of these cornerstones I would describe more fully as "resources available to children in their most formative years." The second is higher education that students and their families can afford.
Two additional sources of opportunity are evident in the SCF. They affect fewer families than the two cornerstones I have just identified, but enough families and to a sufficient extent that I believe they are also important sources of economic opportunity.
The third building block of opportunity, as shown by the SCF, is ownership of a private business.18 This usually means ownership and sometimes direct management of a family business. The fourth source of opportunity is inherited wealth. As one would expect, inheritances are concentrated among the wealthiest families, but the SCF indicates they may also play an important role in the opportunities available to others.
Resources Available for Children
For households with children, family resources can pay for things that research shows enhance future earnings and other economic outcomes--homes in safer neighborhoods with good schools, for example, better nutrition and health care, early childhood education, intervention for learning disabilities, travel and other potentially enriching experiences.19 Affluent families have significant resources for things that give children economic advantages as adults, and the SCF data I have cited indicate that many other households have very little to spare for this purpose. These disparities extend to other household characteristics associated with better economic outcomes for offspring, such as homeownership rates, educational attainment of parents, and a stable family structure.20
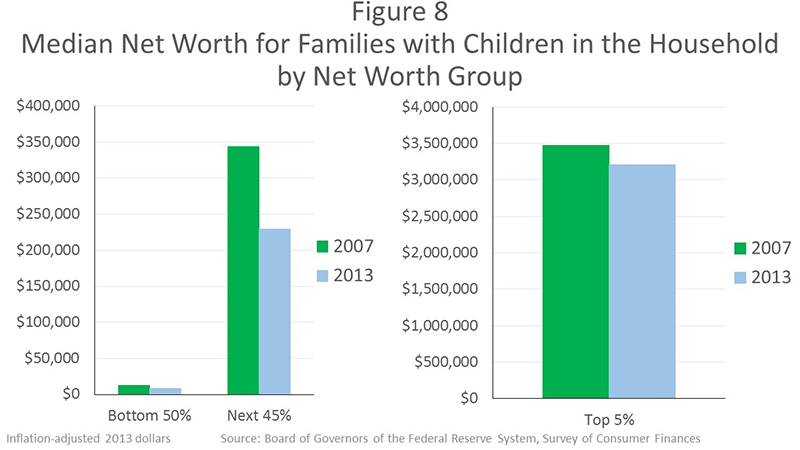
According to the SCF, the gap in wealth between families with children at the bottom and the top of the distribution has been growing steadily over the past 24 years, but that pace has accelerated recently. Figure 8 shows that the median wealth for families with children in the lower half of the wealth distribution fell from $13,000 in 2007 to $8,000 in 2013, after adjusting for inflation, a loss of 40 percent.21 These wealth levels look small alongside the much higher wealth of the next 45 percent of households with children. But these families also saw their median wealth fall dramatically--by one-third in real terms--from $344,000 in 2007 to $229,000 in 2013. The top 5 percent of families with children saw their median wealth fall only 9 percent, from $3.5 million in 2007 to $3.2 million in 2013, after inflation.
For families below the top, public funding plays an important role in providing resources to children that influence future levels of income and wealth. Such funding has the potential to help equalize these resources and the opportunities they confer.
Social safety-net spending is an important form of public funding that helps offset disparities in family resources for children. Spending for income security programs since 1989 and until recently was fairly stable, ranging between 1.2 and 1.7 percent of gross domestic product (GDP), with higher levels in this range related to recessions. However, such spending rose to 2.4 percent of GDP in 2009 and 3 percent in 2010.22 Researchers estimate that the increase in the poverty rate because of the recession would have been much larger without the effects of income security programs.23
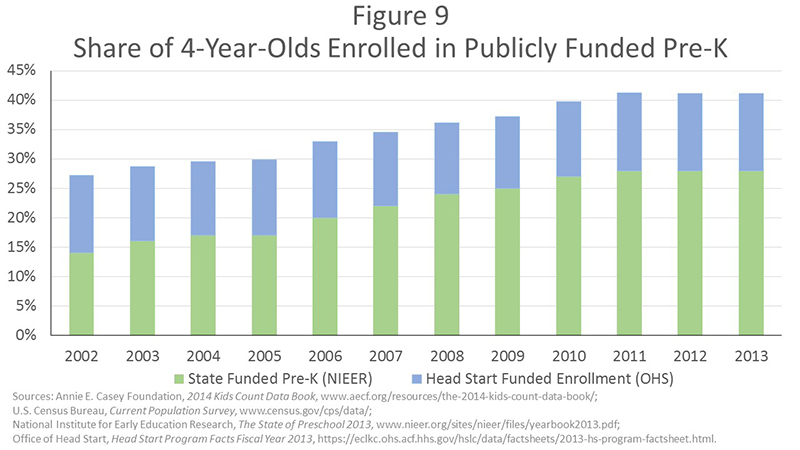
Public funding of education is another way that governments can help offset the advantages some households have in resources available for children. One of the most consequential examples is early childhood education. Research shows that children from lower-income households who get good-quality pre-Kindergarten education are more likely to graduate from high school and attend college as well as hold a job and have higher earnings, and they are less likely to be incarcerated or receive public assistance.24 Figure 9 shows that access to quality early childhood education has improved since the 1990s, but it remains limited--41 percent of children were enrolled in state or federally supported programs in 2013. Gains in enrollment have stalled since 2010, as has growth in funding, in both cases because of budget cuts related to the Great Recession. These cuts have reduced per-pupil spending in state-funded programs by 12 percent after inflation, and access to such programs, most of which are limited to lower-income families, varies considerably from state to state and within states, since local funding is often important.25 In 2010, the United States ranked 28th out of 38 advanced countries in the share of four-year-olds enrolled in public or private early childhood education.26
Similarly, the quality and the funding levels of public education at the primary and secondary levels vary widely, and this unevenness limits public education's equalizing effect. The United States is one of the few advanced economies in which public education spending is often lower for students in lower-income households than for students in higher-income households.27 Some countries strive for more or less equal funding, and others actually require higher funding in schools serving students from lower-income families, expressly for the purpose of reducing inequality in resources for children.
A major reason the United States is different is that we are one of the few advanced nations that funds primary and secondary public education mainly through subnational taxation. Half of U.S. public school funding comes from local property taxes, a much higher share than in other advanced countries, and thus the inequalities in housing wealth and income I have described enhance the ability of more-affluent school districts to spend more on public schools. Some states have acted to equalize spending to some extent in recent years, but there is still significant variation among and within states. Even after adjusting for regional differences in costs and student needs, there is wide variation in public school funding in the United States.28
Spending is not the only determinant of outcomes in public education. Research shows that higher-quality teachers raise the educational attainment and the future earnings of students.29 Better-quality teachers can help equalize some of the disadvantages in opportunity faced by students from lower-income households, but here, too, there are forces that work against raising teacher quality for these students. Research shows that, for a variety of reasons, including inequality in teacher pay, the best teachers tend to migrate to and concentrate in schools in higher-income areas.30 Even within districts and in individual schools, where teacher pay is often uniform based on experience, factors beyond pay tend to lead more experienced and better-performing teachers to migrate to schools and to classrooms with more-advantaged students.31
Higher Education that Families Can Afford
For many individuals and families, higher education is the other cornerstone of economic opportunity. The premium in lifetime earnings because of higher education has increased over the past few decades, reflecting greater demand for college-educated workers. By one measure, the median annual earnings of full-time workers with a four-year bachelor's degree are 79 percent higher than the median for those with only a high school diploma.32 The wage premium for a graduate degree is significantly higher than the premium for a college degree. Despite escalating costs for college, the net returns for a degree are high enough that college still offers a considerable economic opportunity to most people.33
Along with other data, the SCF shows that most students and their families are having a harder time affording college. College costs have risen much faster than income for the large majority of households since 2001 and have become especially burdensome for households in the bottom half of the earnings distribution.
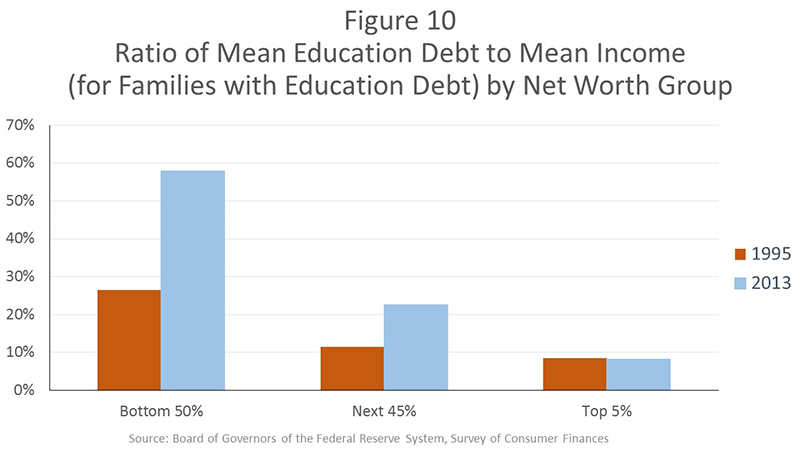
Rising college costs, the greater numbers of students pursuing higher education, and the recent trends in income and wealth have led to a dramatic increase in student loan debt. Outstanding student loan debt quadrupled from $260 billion in 2004 to $1.1 trillion this year. Sorting families by wealth, the SCF shows that the relative burden of education debt has long been higher for families with lower net worth, and that this disparity has grown much wider in the past couple decades. Figure 10 shows that from 1995 to 2013, outstanding education debt grew from 26 percent of average yearly income for the lower half of households to 58 percent of income.34 The education debt burden was lower and grew a little less sharply for the next 45 percent of families and was much lower and grew not at all for the top 5 percent.35
Higher education has been and remains a potent source of economic opportunity in America, but I fear the large and growing burden of paying for it may make it harder for many young people to take advantage of the opportunity higher education offers.
Opportunities to Build Wealth through Business Ownership
For many people, the opportunity to build a business has long been an important part of the American dream. In addition to housing and financial assets, the SCF shows that ownership of private businesses is a significant source of wealth and can be a vital source of opportunity for many households to improve their economic circumstances and position in the wealth distribution.
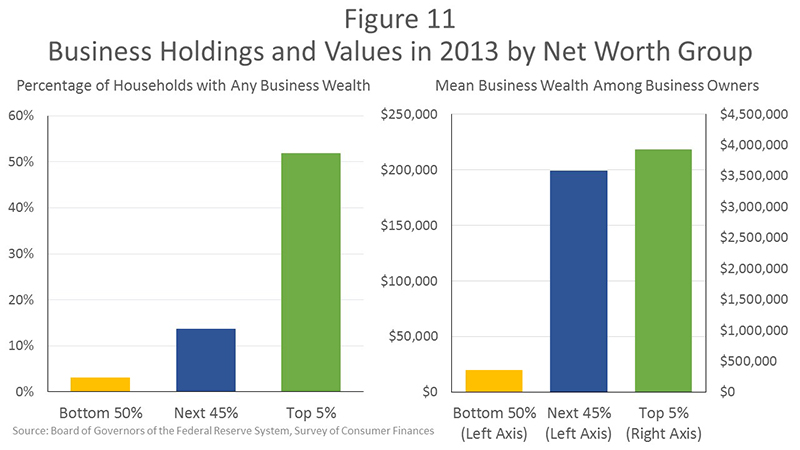
While business wealth is highly concentrated at the top of the distribution, it also represents a significant component of wealth for some other households.36 Figure 11 shows that slightly more than half of the top 5 percent of households have a share in a private business. The average value of these holdings is nearly $4 million. Only 14 percent of families in the next 45 have ownership in a private business, but for those that do, this type of wealth constitutes a substantial portion of their assets--the average amount of this business equity is nearly $200,000, representing more than one-third of their net worth. Only 3 percent of the bottom half of households hold equity in a private business, but it is a big share of wealth for those few.37 The average amount of this wealth is close to $20,000, 60 percent of the average net worth for these households.38
Owning a business is risky, and most new businesses close within a few years. But research shows that business ownership is associated with higher levels of economic mobility.39 However, it appears that it has become harder to start and build businesses. The pace of new business creation has gradually declined over the past couple of decades, and the number of new firms declined sharply from 2006 through 2009.40 The latest SCF shows that the percentage of the next 45 that own a business has fallen to a 25-year low, and equity in those businesses, adjusted for inflation, is at its lowest point since the mid-1990s. One reason to be concerned about the apparent decline in new business formation is that it may serve to depress the pace of productivity, real wage growth, and employment.41 Another reason is that a slowdown in business formation may threaten what I believe likely has been a significant source of economic opportunity for many families below the very top in income and wealth.
Inheritances
Along with other economic advantages, it is likely that large inheritances play a role in the fairly limited intergenerational mobility that I described earlier.42 But inheritances are also common among households below the top of the wealth distribution and sizable enough that I believe they may well play a role in helping these families economically.
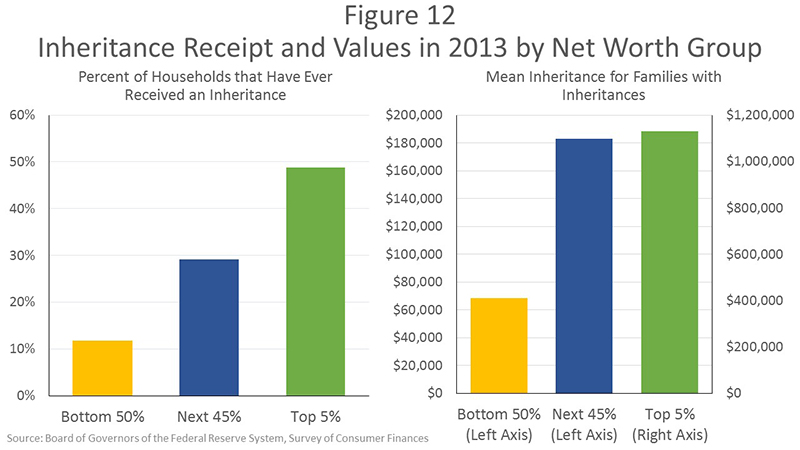
Figure 12 shows that half of the top 5 percent of households by wealth reported receiving an inheritance at some time, but a considerable number of others did as well--almost 30 percent of the next 45 percent and 12 percent of the bottom 50. Inheritances are concentrated at the top of the wealth distribution but less so than total wealth. Just over half of the total value of inheritances went to the top 5 percent and 40 percent went to households in the next 45. Seven percent of inheritances were shared among households in the bottom 50 percent, a group that together held only 1 percent of all wealth in 2013.43
The average inheritance reported by those in the top 5 percent who had received them was $1.1 million. That amount dwarfs the $183,000 average among the next 45 percent and the $68,000 reported among the bottom half of households. But compared with the typical wealth of these households, the additive effect of bequests of this size is significant for the millions of households below the top 5 that receive them.
The average age for receiving an inheritance is 40, when many parents are trying to save for and secure the opportunities of higher education for their children, move up to a larger home or one in a better neighborhood, launch a business, switch careers, or perhaps relocate to seek more opportunity. Considering the overall picture of limited resources for most families that I have described today, I think the effects of inheritances for the sizable minority below the top that receive one are likely a significant source of economic opportunity.
Conclusion
In closing, let me say that, with these examples, I have only just touched the surface of the important topic of economic opportunity, and I look forward to learning more from the work presented at this conference. As I noted at the outset, research about the causes and implications of inequality is ongoing, and I hope that this conference helps spur further study of economic opportunity and its effects on economic mobility. Using the SCF and other sources, I have tried to offer some observations about how access to four specific sources of opportunity may vary across households, but I cannot offer any conclusions about how much these factors influence income and wealth inequality. I do believe that these are important questions, and I hope that further research will help answer them.
1. See Salvatore Morelli, Timothy Smeeding, and Jeffrey Thompson (2014), "Post-1970 Trends in Within-Country Inequality and Poverty: Rich and Middle Income Countries (PDF)," IRP Discussion Paper Series 1419-14 (Madison, Wis.: Institute for Research on Poverty, March). Return to text
2. For income inequality in the past 100 years, see Anthony B. Atkinson, Thomas Piketty, and Emmanuel Saez (2011), "Top Incomes in the Long Run of History (PDF)," Journal of Economic Literature, vol. 49 (March), pp.3-71. For wealth inequality, see Emmanuel Saez and Gabriel Zucman (2014), "Wealth Inequality in the United States since 1913: Evidence from Capitalized Income Tax Data," working paper and slides (October, 14, 2014). For income inequality before 1913, see Peter H. Lindert and Jeffrey G. Williamson (2012), "American Incomes 1774-1860," NBER Working Paper Series 18396 (Cambridge, Mass.: National Bureau of Economic Research, September). Return to text
3. See Alan B. Krueger (2012), "The Rise and Consequences of Inequality in the United States (PDF)," speech delivered at the Center for American Progress, Washington, January 12. Return to text
4. Asset questions in the SCF are based on the value at the time of the survey. Since most interviews were completed between April and December 2013, some of the asset values do not reflect price increases experienced in late 2013, and none reflect increases in 2014. Income questions in the SCF refer to the prior calendar year, so the 2013 survey reports 2012 income. See Jesse Bricker, Lisa J. Dettling, Alice Henriques, Joanne W. Hsu, Kevin B. Moore, John Sabelhaus, Jeffrey Thompson, and Richard A. Windle (2014), "Changes in U.S. Family Finances from 2010 to 2013: Evidence from the Survey of Consumer Finances," Federal Reserve Bulletin, vol. 100 (September), pp. 1-41. Return to text
5. "Households" and "families" are used interchangeably in these remarks because the SCF uses both interchangeably to describe its respondents. Return to text
6. The share of income that went to the top 5 percent of households--a threshold of $230,000 in gross income in 2013--rose from 31 percent of income reported by all respondents in 1989 to 37 percent in 2007. The income share for this group fell in the financial crisis, to 34 percent in 2010, then rose in the recovery, regaining a 37 percent share in 2013. Return to text
7. The top half of the distribution, except for the top 5 percent, earned 53 percent of all income in 1989 but only 51 percent in 2010. In 2013, households in the "next 45 percent" had incomes between $47,000 and $230,000. While income has rebounded for the top 5 percent in the recovery, the share that went to the next 45 percent declined further to 49 percent in 2013. The bottom half of the distribution saw their share of income fall from 16 percent in 1989 to 15 percent in 2007, edge up in 2010, and then reach a new low for the survey last year at 14 percent. Return to text
8. Largely because of losses in income from financial holdings, the share of total income received by the top 5 percent of households fell 3 percentage points from 2007 to 2010, with the next 45 percent and lower half of households each gaining about half of that share. Some of the nominal income losses for households below the top 5 percent were offset by larger-than-normal transfer payments during the recession. Return to text
9. All SCF income and wealth data prior to the 2013 survey are adjusted for inflation by expressing the values in 2013 dollars. Return to text
10. In the 2013 SCF, 17 percent of all families reporting zero or negative net worth also reported they were underwater on their home mortgages. Return to text
11. Housing wealth includes the net equity in primary residences and other residential real estate. Return to text
12. The house price data used are from CoreLogic, and data track price changes at the Core Based Statistical Area level between the survey month in 2013 and June 2014. The average increase in home prices over this period was 8 percent. No adjustments are made to account for possible changes in mortgage leverage. Return to text
13. Home price gains in 2013 and 2014 are estimated to have raised the home equity of home-owning households in the next 45 percent of households in the wealth distribution by 12 percent, and by 9 percent for home-owning households in the top 5 percent of the wealth distribution. Return to text
14. The SCF defines financial assets as liquid assets, certificates of deposit, directly held pooled investment funds, stocks, bonds, quasi-liquid assets (including retirement accounts), savings bonds, whole life insurance, other managed assets, and other financial assets. Return to text
15. In 1989, the top 5 percent of households held 54 percent of financial assets, the next 45 percent (that is, home-owning households in the 50th through 95th percentiles of the wealth distribution) held 42 percent, and the bottom half held 4 percent. Return to text
16. See Pew Charitable Trusts (2012), Pursuing the American Dream: Economic Mobility across Generations (PDF) (Washington: PCT, July). Return to text
17. See Raj Chetty, Nathaniel Hendren, Patrick Kline, Emmanuel Saez, and Nicholas Turner (2014), "Is the United States Still a Land of Opportunity? Recent Trends in Intergenerational Mobility," NBER Working Paper Series 19844 (Cambridge, Mass.: National Bureau of Economic Research, January (revised May 2014)). See also Organisation for Economic Co-operation and Development (2010), "A Family Affair: Intergenerational Social Mobility across OECD Countries (PDF)," in Economic Policy Reforms: Going for Growth 2010, pp.183-200 (Paris: OECD); and Alan B. Krueger (2012), "The Rise and Consequences of Inequality in the United States (PDF)," speech delivered at the Center for American Progress, Washington, January 12. Return to text
18. Business assets in the SCF include both actively and "non-actively" managed businesses but do not include ownership of publicly traded stock. Return to text
19. See, for example, Janet Currie and Douglas Almond (2011), "Human Capital Development before Age Five," ch. 15 in David Card and Orley Ashenfelter, eds., Handbook of Labor Economics, vol. 4 (Holland: Elsevier), pp. 1315-1486. Return to text
20. Homeownership by parents is strongly associated with economic success for children; see Thomas P. Boehm and Alan M. Schlottmann (1999), "Does Home Ownership by Parents Have an Economic Impact on Their Children?" Journal of Housing Economics, vol. 8 (September), pp. 217-32. Ninety-seven percent of top-earning families with children own a home, compared with fewer than half of the bottom 50 percent of families with children; educational attainment of parents is strongly predictive of outcomes for children that determine earnings. See Ayana Douglas-Hall and Michelle Chau (2007), "Parents' Low Education Leads to Low Income, Despite Full-Time Employment" (New York: National Center for Children in Poverty, Columbia University, November). A considerable body of literature establishes the correlation between educational attainment of parents and their children. Other research has identified that this relationship is causal; see, for example, Philip Oreopoulos, Marianne E. Page, and Ann Huff Stevens (2006), "The Intergenerational Effects of Compulsory Schooling," Journal of Labor Economics, vol. 24 (October), pp. 729-60. Eighty-six percent of top-earning households in the SCF with children are headed by a college graduate, compared with 12 percent in the bottom half of households with children; children raised by a single parent earn less as adults. See Mary Ann Powell and Toby L. Parcel (1997), "Effects of Family Structure on the Earnings Attainment Process: Differences by Gender," Journal of Marriage and Family, vol. 59 (May), pp. 419-33. Only 4 percent of top-earning households with children are headed by unmarried parents, compared with 47 percent for the lower half of households with children. Return to text
21. Distributional statistics for families with children are based on a sorting of only families with children. Return to text
22. Congressional Budget Office historic budget data. Income security programs include UI, SSI, SNAP EITC, and other family support and nutrition programs. Return to text
23. See Jeffrey P. Thompson and Timothy M. Smeeding (2013), "Inequality and Poverty in the United States: The Aftermath of the Great Recession (PDF)," Finance and Economics Discussion Series 2013-51 (Washington: Board of Governors of the Federal Reserve System, July). Return to text
24. See James J. Heckman, Seong Hyeok Moon, Rodrigo Pinto, Peter A. Savelyev, and Adam Yavitz (2010), "The Rate of Return to the HighScope Perry Preschool Program," Journal of Public Economics, vol. 94 (1‑2), pp. 114-28; and Clive R. Belfield, Milagros Nores, Steve Barnett, and Lawrence Schweinhart (2006), "The High/Scope Perry Preschool Program: Cost-Benefit Analysis Using Data from the Age-40 Followup," Journal of Human Resources, vol. 41 (Winter), pp. 162-90. Return to text
25. The share of four-year-olds in state-funded pre-K programs increased from 14 percent in 2002 to 27 percent in 2010 but has been 28 percent since. Head Start enrollments have been fairly steady since 2005. Forty-one percent of four-year-olds were enrolled in federally funded Head Start or state-funded pre-K education programs in 2013. See National Institute for Early Education Research (2013), The State of Preschool 2013: State Preschool Yearbook (PDF) (New Brunswick, N.J.: Rutgers Graduate School of Education). For analysis of Head Start enrollment by age, see the Annie E. Casey Foundation KIDS COUNT Data Center. Return to text
26. See Organisation for Economic Co-operation and Development (2013), "How Do Early Childhood Education and Care (ECEC) Policies, Systems and Quality Vary across OECD Countries? (PDF)" Education Indicators in Focus Series 11 (Paris: OECD, February). Return to text
27. See Organisation for Economic Co-operation and Development (2013), Education at a Glance 2013: OECD Indicators (PDF) (Paris: OECD). Return to text
28. See Education Week (2014), Quality Counts 2014: District Disruption and Revival (Bethesda, Md.: Editorial Projects in Education, January). Return to text
29. See Eric A. Hanushek (2011), "The Economic Value of Higher Teacher Quality," Economics of Education Review, vol. 30 (June), pp. 466-79; or, for estimates of the future earnings students gain by having a better teacher, see Raj Chetty, John N. Friedman, and Jonah E. Rockoff, "The Long-Term Impacts of Teachers: Teacher Value-Added and Student Outcomes in Adulthood," unpublished paper, Harvard University. Return to text
30. See Eric Isenberg, Jeffrey Max, Philip Gleason, Liz Potamites, Robert Santillano, Heinrich Hock, and Michael Hansen (2013), Access to Effective Teaching for Disadvantaged Students (PDF), report NCEE 2014-4001, prepared for the Institute of Education Sciences (Washington: U.S. Department of Education, Institute of Education Sciences, National Center for Education Evaluation and Regional Assistance); and Kati Haycock and Eric A. Hanushek (2010), "An Effective Teacher in Every Classroom: A Lofty Goal, But How to Do It? (PDF)" Education Next, vol. 10 (Summer), pp. 46-52. Return to text
31. Better and more-experienced teachers tend to move to better-resourced schools, including those with more active outside funding, or those with more-advantaged students, such as magnet schools. Even within schools, more experienced and higher performing teachers are more likely to teach Advanced Placement classes which tend to serve more advantaged students. The result is that lower income and lower achieving students are more likely to be taught by less experienced and lower performing teachers. See Charles Clotfelter, Helen Ladd, Jacob Vigdor, and Justin Wheeler (2007), "High Poverty Schools and the Distribution of Teachers and Principals," North Carolina Law Review, vol. 85 (2), pp. 1345-79; Charles Clotfelter, Helen Ladd, and Jacob Vigdor (2005), "Who Teaches Whom? Race and the Distribution of Novice Teachers," Economics of Education Review, vol. 24 (August), pp. 377-92; and Hamilton Lankford, Susanna Loeb, and James Wyckoff (2002), "Teacher Sorting and the Plight of Urban Schools: A Descriptive Analysis," Education Evaluation and Policy Analysis, vol. 37 (Spring), pp. 37-62. Return to text
32. See Sandy Baum (2014), Higher Education Earnings Premium: Value, Variation, and Trends (PDF) (Washington: Urban Institute, February). Return to text
33. Taking into account the cost of paying for education and years spent in college and not working, economists at the Federal Reserve Bank of New York estimate that the lifetime return to a college degree is 15 percent. See Jaison R. Abel and Richard Deitz (2014), "Do the Benefits of College Still Outweigh the Costs? (PDF)" Federal Reserve Bank of New York, Current Issues in Economics and Finance, vol. 20 (3). Return to text
34. Education debt in the SCF reflects the total amount of debt outstanding at the time of the survey. Return to text
35. Education debt-to-income ratio is calculated based on what SCF respondents reported as their usual income. Numbers are for families with education debt. Return to text
36. The SCF does not ask households whether they started businesses that closed, so reported business ownership and wealth is largely related only to those businesses that succeed. Return to text
37. Distributional statistics for business ownership and assets exclude outliers with large negative net worth. Return to text
38. Business wealth took a big hit due to the recession and has only partly recovered for most families. For the bottom half of the distribution, the $20,000 average in business wealth in 2013 was down from $29,000, after adjusting for inflation, in 2007. The nearly $200,000 held by the next 45 percent with businesses was down from $228,000 in 2007. The $4 million in business wealth of the top 5 percent in 2013 was down, in real terms, from $4.4 million in 2007. Return to text
39. See, for example, Robert Fairlie (2004), "Earnings Growth among Young Less-Educated Business Owners," Industrial Relations, vol. 43 (July), pp. 634-59; Douglas Holtz-Eakin, Harvey S. Rosen, and Robert Weathers (2000), "Horatio Alger Meets the Mobility Tables," Small Business Economics, vol. 14, pp. 243-74; and Vincenzo Quadrini (2000), "Entrepreneurship, Saving, and Social Mobility," Review of Economic Dynamics, vol. 3 (January), pp. 1-40. Return to text
40. See Business Dynamics Statistics, U.S. Census Bureau. For analysis documenting the decline in new and young firms, see John Haltiwanger, Ron Jarmin, and Javier Miranda (2012), Where Have All the Young Firms Gone? (PDF) Business Dynamics Statistics Briefing, May. For a discussion of the link between a decline in young firms and constrained credit access, see Michael Siemer (2014), "Firm Entry and Employment Dynamics in the Great Recession (PDF)," Finance and Economics Discussion Series 2014-56 (Washington: Board of Governors of the Federal Reserve System, July). Return to text
41. See Steven J. Davis and John Haltiwanger (2014), "Labor Market Fluidity and Economic Performance (PDF)," paper prepared for "Re-Evaluating Labor Market Dynamics," a symposium sponsored by the Federal Reserve Bank of Kansas City, held in Jackson Hole, Wyo., August 21-23. Return to text
42. This topic is discussed extensively in Thomas Piketty (2014), Capital in the 21st Century, trans. Arthur Goldhammer (Cambridge, Mass.: Belknap Press). Return to text
43. Reported inheritances can have been received at any point in the respondent's life. As with other forms of wealth cited in these remarks, inheritances have been adjusted for inflation and are expressed in 2013 dollars. Return to text