An Analysis of the Impact of the Commercial Real Estate Concentration Guidance
- Part 1: Executive Summary
- Part 2: Changes in CRE Concentrations over Time
- Part 3: The Impact of CRE Concentrations on Bank Failures
- Part 4: Impact of the Guidance and Market Conditions on CRE Loan Growth
- Part 5: Impact of CRE Concentrations on Banks’Market Capital Ratio
- Part 6: Conclusion
Part 4: Impact of the Guidance and Market Conditions on CRE Loan Growth
This chapter highlights the relationship between CRE concentrations and the growth of CRE loans at banks. There are three important notes about our analysis.
- Because of data limitations, we were unable to apply a component of the total CRE concentration criterion, regarding the 36-month growth of 50 percent or more in the non-owner-occupied CRE portfolio, to the historical data. As a result, the analyses for this chapter uses total CRE loans (including CLD loans) representing 300 percent or more of the institution's total risk-based capital.
- Second, while we did not perform a formal econometric test to determine whether or not we would have seen the same degree of change in CRE loan growth if the guidance had not been issued, a simple comparison is illustrative that banks with higher CRE concentrations retreated from CRE lending in response to market conditions more rapidly than lower concentration banks.
- Third, it is likely that geographically many of the banks with excessive CRE concentrations were in markets that experienced the sharpest corrections. From a policy or guidance perspective, we would expect geographic variation in the intensity of a market upturn or downturn to amplify bank risk-management efforts as well as supervisory concerns about the risks of the concentration of credit.
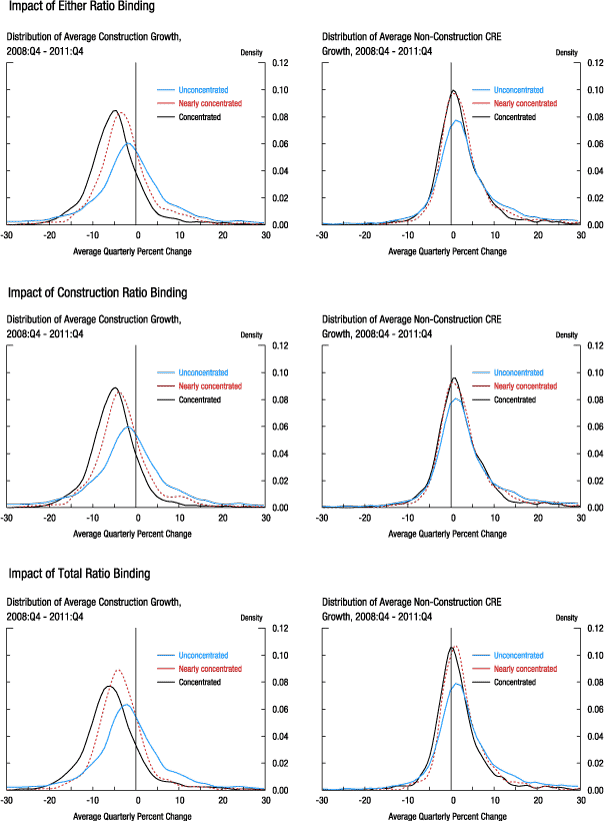
Figure 5 presents estimates of the distribution of the growth rates of CRE concentration levels from 2008 to 2011. We compute the average quarterly percent changes for that period. We use a merger-adjusted database of call report data to ensure that we are comparing growth rates for banks active throughout our analysis' time frame. For each chart in figure 5, we present an estimate of the distribution of the growth rates, using the same categories as defined in figure 2.
The top panel of charts in figure 5 reports the growth distributions based on whether either of the two components of the total CRE supervisory criterion is met. The chart at left shows the growth distributions for CLD loans, while the chart at right shows the growth distribution for non-owner-occupied, non-CLD CRE loans. While a significant majority of all banks saw declines in their holdings of CLD loans, banks above or near at least one of the concentration levels saw significantly greater declines. There is less of a difference in the distribution of the growth in non-CLD CRE loans, with many banks, even those defined as concentrated, seeing increases in non-CLD CRE loans.
The middle panel of charts in figure 5 repeats this analysis based only on whether the CLD criteria were applicable. Again, there is a sharp decline in CLD loans at the concentrated and nearly concentrated banks, and less of a difference in the growth rate of non-CLD loans between banks with different degrees of concentration in CLD loans.
The bottom panel of charts repeats the analysis based only on whether the total ratio supervisory criteria were met. The charts show that banks close to or above the supervisory criteria for the total ratio were more likely to show greater contractions in their holding of both CLD and non-CLD CRE loans. The gap in the change in loan growth between concentrated and unconcentrated banks, however, is greater for CLD loans than for non-CLD CRE loans.
References
11. Bank holding companies are assigned to both a CLD and total CRE cohort based on their loan concentrations as of 2006:Q4. Subsequent measurements of the cohort's average MCR are based on all the BHCs that have survived to date. Total CRE includes loans secured by non-farm, non-residential properties (owner-occupied loans were not separately distinguished within these loans until 2008:Q1. Return to text

