Consumers and Mobile Financial Services
March 2012
- How Are Consumers Interacting with Financial Institutions?
- Current Use of Mobile Banking and Payments
- Other Mobile Financial Services
Current Use of Mobile Banking and Payments
In this Section:
Mobile Banking
The Federal Reserve survey defines mobile banking as "using a mobile phone to access your bank account, credit card account, or other financial account. Mobile banking can be done either by accessing your bank's web page through the web browser on your mobile phone, via text messaging, or by using an application downloaded to your mobile phone."
A significant number of mobile phone users have already adopted mobile banking. Nearly 21 percent of mobile phone users in the survey report that they used mobile banking in the past 12 months.8 Moreover, among those consumers who do not currently use mobile banking, 11 percent report that they will "definitely" or "probably" use mobile banking in the next 12 months. An additional 17 percent of those who report that they are unlikely to use mobile banking in the next 12 months report that they will "definitely" or "probably" adopt mobile banking at some point. Adding all these respondents together would imply peak adoption of 42 percent of all mobile phone owners.9 As smartphone users are more likely to adopt mobile banking than non-smartphone users, increasing smartphone adoption should further fuel mobile banking adoption.
Use of mobile banking appears to be highly correlated with age (table 2), as individuals between ages 18 and 29 account for approximately 44 percent of mobile banking users, relative to 22 percent of mobile phone users. Conversely, individuals age 60 and over account for only 6 percent of all mobile banking users, while at the same time they represent 24 percent of all mobile phone users.
Table 2. Use of mobile banking in the past 12 months by age
Percent, except as noted
| Age categories | Yes | No | Total |
|---|---|---|---|
| 18-29 | 43.5 | 16.8 | 22.4 |
| 30-44 | 35.7 | 24.7 | 27 |
| 45-59 | 14.7 | 30.2 | 26.9 |
| 60+ | 6.1 | 28.4 | 23.7 |
| Number of respondents | 372 | 1,626 | 1,998 |
Note: This is table B.89 in Appendix 2.
Non-Hispanic black and Hispanic users show a disproportionately high rate of adoption of mobile banking (table 3), at 16 percent and 17 percent of all mobile banking users relative to 11 percent and 13 percent of mobile phone users, respectively. Meanwhile, mobile banking users are split evenly between males and females, and use of mobile banking is generally unrelated to household income (table 4), with the share of mobile banking users by income category corresponding to their share of the mobile phone user population. As with online banking, exceptions occurred at the tails of the income distribution, with those individuals earning less than $25,000 per year being significantly less likely to use mobile banking than their share of the mobile phone user population would suggest, while those individuals earning more than $100,000 per year being significantly more likely to use mobile banking than their share of the mobile phone user population would suggest. Mobile banking is highly correlated with education (table 5): 73 percent of all mobile banking users have at least some college education, but this education group represents only 60 percent of all mobile phone users.
Table 3. Use of mobile banking in the past 12 months by race
Percent, except as noted
| Race/ethnicity | Yes | No | Total |
|---|---|---|---|
| White, Non-Hispanic | 60.3 | 71.5 | 69.2 |
| Black, Non-Hispanic | 16.2 | 10 | 11.3 |
| Other, Non-Hispanic | 5.2 | 5.8 | 5.6 |
| Hispanic | 17.1 | 11.6 | 12.8 |
| 2+ Races, Non-Hispanic | 1.2 | 1.1 | 1.2 |
| Number of respondents | 372 | 1,626 | 1,998 |
Note: This is table B.92 in Appendix 2.
Table 4. Use of mobile banking in the past 12 months by income group
Percent, except as noted
| Income group | Yes | No | Total |
|---|---|---|---|
| Less than $25,000 | 12.8 | 19.9 | 18.4 |
| $25,000-$39,999 | 19 | 16.6 | 17.1 |
| $40,000-$74,999 | 27.5 | 26.5 | 26.7 |
| $75,000-$99,999 | 12.9 | 14 | 13.8 |
| $100,000 or greater | 27.9 | 22.9 | 24 |
| Number of respondents | 372 | 1,626 | 1,998 |
Note: Table B.101 in Appendix 2.
Table 5. Use of mobile banking in the past 12 months by education group
Percent, except as noted
| Education (categorical) | Yes | No | Total |
|---|---|---|---|
| Less than high school | 5.5 | 12.1 | 10.7 |
| High school | 21.5 | 31.8 | 29.6 |
| Some college | 39 | 27.4 | 29.8 |
| Bachelor's degree or higher | 34 | 28.8 | 29.9 |
| Number of respondents | 372 | 1,626 | 1,998 |
Note: Table B.98 in Appendix 2.
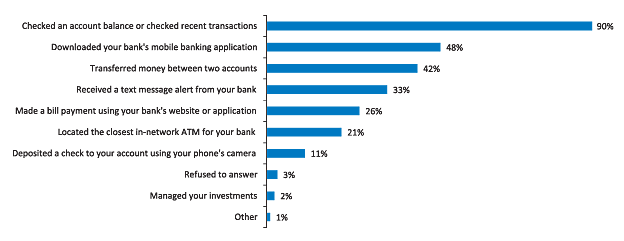
By far, checking financial account balances or transaction inquiries were the most common mobile banking activity, with 90 percent of mobile banking users having performed this function in the past 12 months (figure 2). Less prevalent activities were transferring money between accounts (42 percent) or receiving a text message alert from a bank (33 percent). Less frequently used mobile banking functions include making online bill payments from a bank account (26 percent), locating an in-network ATM (21 percent), and depositing a check by phone (11 percent). Lastly, mobile investment management is utilized by only 2 percent of mobile banking users. Many mobile banking users appear to be making use of their banks' mobile applications, as 48 percent have installed such an application on their phones.

Accessible Version | Return to text
Note: This was question 25 in the survey (see Appendix 1); number of respondents was 372.
Consumers report using mobile banking up to 60 times per month; however, the median number of mobile banking transactions is four or five times in a typical month.
Of the consumers who use mobile banking, many appear to be quite satisfied with their experiences, as 62 percent report being "very satisfied" with their experiences, and another 32 percent report being "somewhat satisfied" with their experiences.
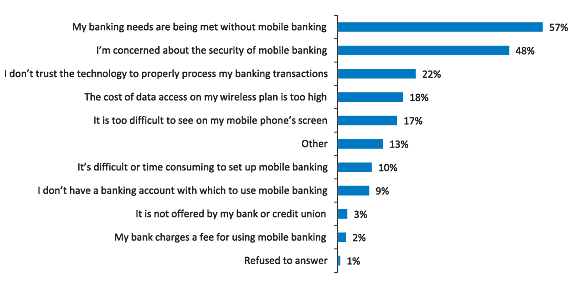
Among those consumers with mobile phones who do not currently use mobile banking, the top two reasons for not using the service are that they believe their banking needs are met without mobile banking (58 percent) and that they are concerned about security (48 percent) (figure 3). Less commonly cited reasons include a lack of trust in the technology to process transactions properly (22 percent), the high cost of data access on mobile phones (18 percent), and the small size of the mobile phone screen (17 percent).

Accessible Version | Return to text
Note: This was question 36 in the survey (see Appendix 1); number of respondents was 1,626.
Consumers who express concerns about the security of mobile banking are concerned with hackers gaining access to their phone remotely (54 percent), losing their phone or having it stolen (19 percent), and experiencing data interception by a third party (18 percent). If these concerns were addressed, many non-users would be willing to adopt mobile banking.
Moreover, the potential uses of mobile banking by those who have yet to adopt it largely mirror those of current users. The majority is interested in checking financial account balances or recent transactions (55 percent), while fewer are interested in receiving text message alerts from their bank (30 percent), transferring money between accounts (25 percent), or making bill payments (24 percent).
Mobile Payments
The Federal Reserve survey defined mobile payments as "purchases, bill payments, charitable donations, payments to another person, or any other payments made using a mobile phone. Mobile payments can be used by accessing a web page through the web browser on your mobile device, by sending a text message (SMS), or by using a downloadable application on your mobile device. The amount of the payment may be applied to your phone bill (for example, Red Cross text message donation), charged to your credit card, or withdrawn directly from your bank account."
Consumers were less likely to adopt mobile payments than mobile banking, with only 12 percent of mobile phone users reporting that they made a mobile payment in the past 12 months. Mobile payment users also perform a narrower set of transactions than mobile banking users, with the most common activity being payment of bills (47 percent), followed by making online purchases (36 percent) and transferring money directly to another person (21 percent). All other transactions (e.g., receiving a payment, texting to make a charitable donation) are used by less than 10 percent of those making mobile payments.
Mobile payments are disproportionately used by younger consumers (table 6). Individuals age 18 to 29 account for 37 percent of mobile payment users relative to 22 percent of all mobile phone users, while individuals age 30 to 44 account for a further 36 percent of mobile payment users relative to 27 percent of all mobile phone users. Hispanic consumers are active users of mobile payments, accounting for approximately 21 percent of all mobile payment users relative to 13 percent of all mobile phone users (table 7). In contrast, non-Hispanic whites are proportionally less likely to use mobile payments, as they make up 58 percent of mobile payment users but are 69 percent of mobile phone users. Almost 13 percent of non-Hispanic blacks use mobile payments, which is comparable to their 11 percent share of the mobile phone user population. Females are slightly more likely to use mobile payments than males, accounting for 55 percent of all users (table 8). Income does not play a role in mobile payment use, as each income group represents roughly the same percentage as it does in the overall mobile phone user sample (table 9). Similarly, mobile payment use by education level is roughly proportionate to its representation in the mobile phone user population (table 10).
Table 6. Use of mobile payments in the past 12 months by age
Percent, except as noted
| Age categories | Yes | No | Total |
|---|---|---|---|
| 18-29 | 37.3 | 20.3 | 22.4 |
| 30-44 | 35.9 | 25.6 | 26.9 |
| 45-59 | 16.9 | 28.5 | 27 |
| 60+ | 10 | 25.7 | 23.7 |
| Number of respondents | 213 | 1,780 | 1,993 |
Note: This is table B.90 in Appendix 2.
Table 7. Use of mobile payments in the past 12 months by race
Percent, except as noted
| Race/ethnicity | Yes | No | Total |
|---|---|---|---|
| White, Non-Hispanic | 58.3 | 70.8 | 69.3 |
| Black, Non-Hispanic | 12.9 | 10.9 | 11.2 |
| Other, Non-Hispanic | 7.1 | 5.4 | 5.6 |
| Hispanic | 20.9 | 11.6 | 12.8 |
| 2+ Races, Non-Hispanic | 0.9 | 1.2 | 1.2 |
| Number of respondents | 213 | 1,780 | 1,993 |
Note: This is table B.93 in Appendix 2.
Table 8. Use of mobile payments in the past 12 months by gender
Percent, except as noted
| Sex | Yes | No | Total |
|---|---|---|---|
| Female | 55 | 52.7 | 53 |
| Male | 45 | 47.3 | 47 |
| Number of respondents | 213 | 1,780 | 1,993 |
Note: This is table B.96 in Appendix 2.
Table 9. Use of mobile payments in the past 12 months by income group
Percent, except as noted
| Income group | Yes | No | Total |
|---|---|---|---|
| Less than $25,000 | 19.1 | 18.5 | 18.5 |
| $25,000-$39,999 | 20.6 | 16.7 | 17.2 |
| $40,000-$74,999 | 23 | 27.2 | 26.7 |
| $75,000-$99,999 | 11.7 | 14 | 13.7 |
| $100,000 or greater | 25.6 | 23.6 | 23.9 |
| Number of respondents | 213 | 1,780 | 1,993 |
Note: This is table B.102 in Appendix 2.
Table 10. Use of mobile payments in the past 12 months by education group
Percent, except as noted
| Education (categorical) | Yes | No | Total |
|---|---|---|---|
| Less than high school | 7.2 | 11.2 | 10.7 |
| High school | 27.9 | 29.9 | 29.7 |
| Some college | 37 | 28.7 | 29.7 |
| Bachelor's degree or higher | 27.9 | 30.1 | 29.9 |
| Number of respondents | 213 | 1,780 | 1,993 |
Note: This is table B.99 in Appendix 2.
Consumers use a variety of methods to make mobile payments, but the most common method is to input a credit card, debit card, or prepaid card number into a mobile phone (66 percent). Other mobile payment techniques used by consumers include making payments directly from a bank account (45 percent); using Google Wallet, Paypal, or iTunes (22 percent); or adding a payment to a mobile phone bill (8 percent).
Consumers use mobile payment services less frequently than they do mobile banking services. The median number of mobile payments in a typical month is one. Although some respondents reported making as many as 24 mobile payments per month, fewer than 7 percent of respondents make more than five payments in a typical month.
As with mobile banking, users of mobile payments appear to be quite satisfied with their experiences: 55 percent report being "very satisfied" with their experiences and 33 percent report being "somewhat satisfied" with their experiences.
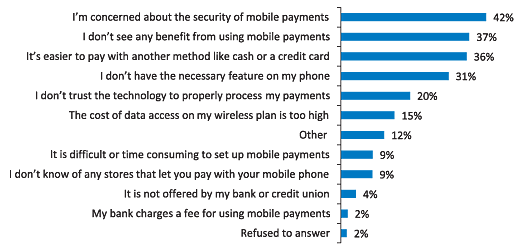
Although security is the dominant reason why individuals do not use mobile payments (42 percent), there are many consumers who do not see any value in mobile payments; 36 percent report that it is easier to pay with other methods, and 37 percent report that they do not see any benefit from using mobile payments (figure 4). Other reasons for not using include the lack of necessary features on a phone (31 percent) and a lack of trust in the technology to properly process payments (20 percent).
If the concerns of non-users of mobile payments were addressed, those consumers express that they would have an interest in using mobile payments for a variety of activities. In particular, 34 percent report that they would pay bills online using their phone, 28 percent would receive coupons on their phone, and 22 percent say they would receive location-based offers or buy goods and services online. Making person-to-person payments is listed by 17 percent of respondents as a preferred mobile payment activity; the same percentage expresses a similar sentiment for using a mobile phone as the payment mechanism at a cash register or to use a phone as a "virtual wallet." Consumers also express some interest in using mobile payments to transfer money to friends or relatives in other countries (7 percent).

Accessible Version | Return to text
Note: This was question 39 in the survey (see Appendix 1); number of respondents was 1,780.
Mobile Security
Two major impediments to consumers' adoption of mobile banking and mobile payment technologies are (1) concerns about security and (2) the possibility of hackers remotely accessing consumers' phones. Consumers' beliefs about whether mobile banking or mobile payment technologies are secure is correlated with their use of these technologies. Consumers who use mobile banking or mobile payments are more likely to report that it is a secure process than those who do not use mobile banking or mobile payments. For example, when consumers were asked to rate the security of text messages for mobile banking, those who are mobile banking users rate the service "very safe" (18 percent) or "somewhat safe" (42 percent). In contrast, 38 percent of non-users of mobile banking report that they "don't know" whether or not text messages for mobile banking are safe, while only 6 percent rate the service "very safe" and 27 percent rate it "somewhat safe."
The dichotomy between users and non-users of mobile banking is even more pronounced when asked about the overall security of mobile banking for protecting personal information. Two-fifths of non-users report that they do not know if it is secure, while 13 percent of this group rate mobile banking "very unsecure" and 23 percent rate the service "somewhat unsecure." Mobile banking users, however, rate mobile banking as "very safe" (18 percent) or "somewhat safe" (56 percent) in maintaining their personal information.
References
8. There is a wide range of estimates of mobile banking adoption. comScore estimates that 13.9 percent of all mobile phone users had adopted mobile banking as of Q2 2011. Javelin estimated that 19 percent of mobile phone users had adopted mobile banking as of March 2011 (Smartphone Banking Security Report); however, the firm subsequently reports that mobile banking adoption jumped to 30 percent as of June 2011 (comScore, 2011, Mobile Banking Financial Institution Scorecard). Return to text
9. The denominator for each of the questions on mobile banking adoption varies, thus the potential adoption rate is less than the sum of the percentages of respondents who indicate that they have or will adopt mobile banking. There are a total of 2,002 mobile phone users in our survey: 418 are current users of mobile banking, 182 report that they are likely to use mobile banking in the next 12 months, and 246 report that they will likely use mobile banking at some point in the future (for a total of 846 potential users, or 42 percent of all 2,002 mobile phone users). Return to text
