
FEDS Notes
 Print
PrintOctober 16, 2013
Dealer Balance Sheet Capacity and Market Liquidity during the 2013 Selloff in Fixed Income Markets
Tobias Adrian, Michael Fleming, Jonathan Goldberg, Morgan Lewis, Fabio Natalucci, and Jason Wu
Long-term interest rates hit record-low levels in 2012 but have since increased substantially. As discussed in an earlier post  , the sharpest increase occurred between May 2 and July 5 of this year, with the 10-year Treasury yield rising from 1.63 percent to 2.74 percent. During the May-July episode, market liquidity also deteriorated. Some market participants have suggested that constraints on dealer balance sheet capacity impaired liquidity during the selloff, amplifying the magnitude and speed of the rise in interest rates and volatility. In this post, we review the evolution of Treasury market liquidity, evaluate whether dealer balance sheet capacity amplified the selloff, and examine what motivated dealer behavior during the episode.
Market Liquidity Deteriorates during the Selloff
Treasury market liquidity declined during the selloff. Bid-ask spreads widened, market depth declined, and the price impact of trades increased. The chart below plots price impact coefficients , calculated from regressions of five-minute price changes on net order flow for the same five-minute interval (where net order flow = buyer-initiated volume - seller-initiated volume). Liquidity declined during May and June 2013, especially following Federal Reserve Chairman Ben Bernanke's testimony before the Joint Economic Committee on May 22 and the June 18-19 Federal Open Market Committee meeting.
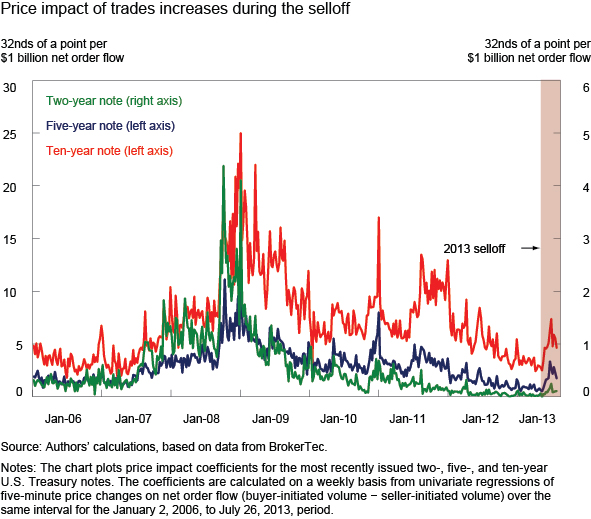
The chart also shows that the deterioration in Treasury market liquidity during the selloff was not unusual when viewed from a historical perspective. That is, even after accounting for the worsening of liquidity conditions in May and June, liquidity measures remained well within ranges experienced in recent years and showed significantly less strain than during the financial crisis (late 2008 and early 2009). Moreover, separate analysis shows that the decline in market liquidity this spring and early summer wasn't unusual given the sharp increase in interest-rate volatility that also occurred during the selloff.
Dealer Positions Decline during the Selloff
Market commentary suggests that a reduction in dealer balance sheet capacity may have contributed to the decline in market liquidity and amplified price declines during the selloff. Dealers intermediate between buyers and sellers, putting capital at risk in order to absorb changes in client supply and demand. The less capacity a dealer has to absorb supply and demand imbalances, the higher volatility and the lower market liquidity are likely to be.
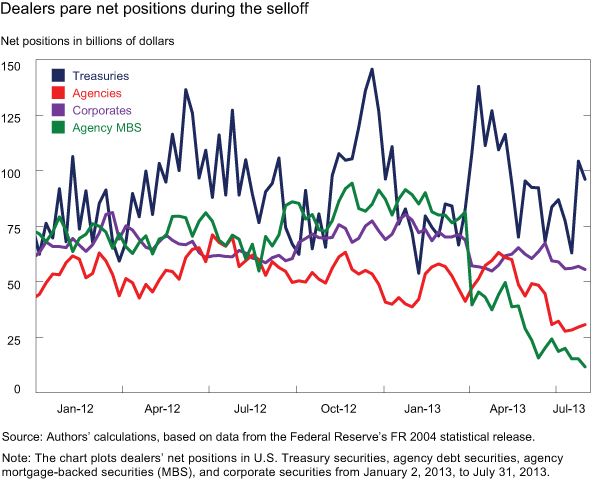
To gauge dealer willingness to add interest rate risk exposure and buffer the selling pressures coming from their customers, we look at dealers' net positions (the difference between long and short positions), as reported to the Federal Reserve by the primary dealers . The next chart shows primary dealers' net positions in U.S. Treasury securities, agency debt, agency mortgage-backed securities (MBS), and corporate securities (where the "corporates" category includes instruments such as private-label MBS and other asset-backed securities). Dealers markedly reduced their net positions in these fixed-income securities during the selloff, particularly for agency debt (red line) and agency MBS (green line), suggesting that they may have decided to limit their outright exposures rather than absorb inventory from customers looking to sell.
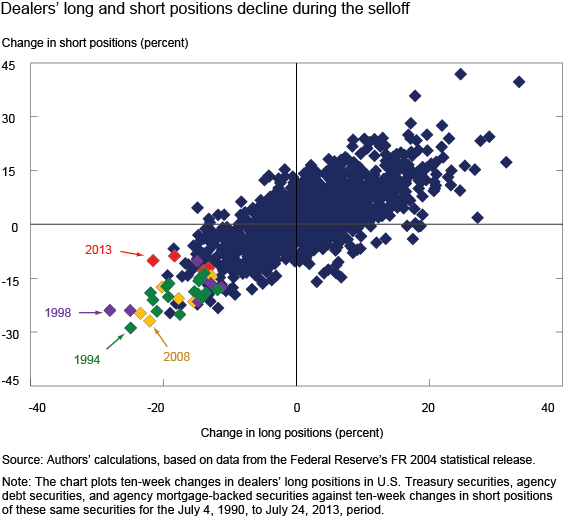
To gauge dealer market-making more broadly, we also look at dealers' gross positions in fixed-income securities. The chart below plots ten-week percentage changes in primary dealers' long positions of U.S. Treasuries, agency debt, and agency MBS against ten-week changes in dealers' short positions of these same securities. The biggest decline in long positions in 2013 occurred between May 8 and July 17 (the red diamond to the extreme left of the lower-left quadrant), suggesting that dealers reduced their market-making activities during the selloff. Outside of 2013, instances in which there were larger changes in both long and short positions are limited to a small number of periods at the height of the financial crisis in 2008 (the yellow diamonds), during the bond market selloff of 1994 (green diamonds), and around the financial market turmoil of 1998 (purple diamonds).
Dealer Risk-Taking Has Declined since the Crisis
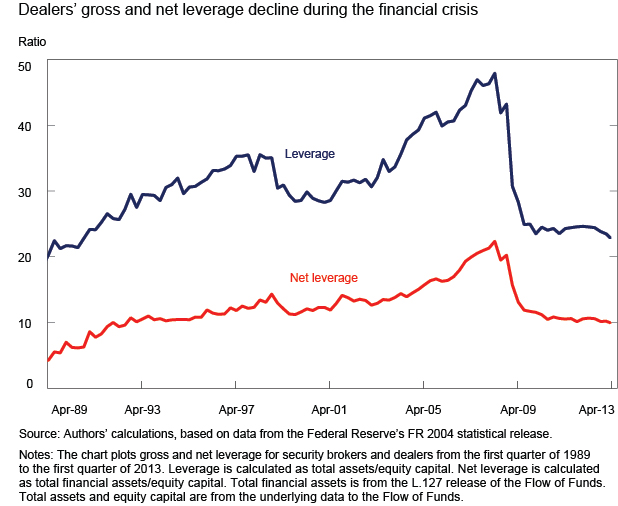
We proceed to look at broader risk measures to better understand why dealers pared positions during the selloff. As shown in the next chart, dealer leverage, gauged either by gross or net leverage, declined markedly during the recent financial crisis and has been stable since (gross leverage is calculated as total assets over equity capital, whereas net leverage is calculated as total financial assets - which nets dealers' reverse repos - over equity capital). This notable decline in leverage suggests that dealer risk-taking has moderated since the crisis.
Another indicator of risk-taking is value at risk (VaR). VaR is a measure of the worst expected loss over a given time horizon at a given confidence level. The next chart shows that the sum of firm-wide VaR across eight large U.S. dealers has trended downward since the financial crisis.
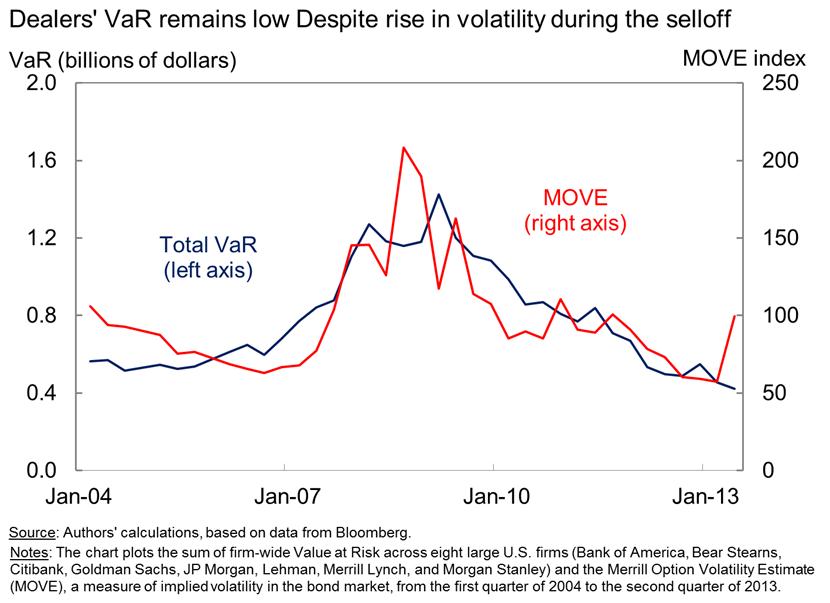
The chart also shows that VaR tends to move in tandem with market volatility (as proxied by the MOVE, Merrill Option Volatility Estimate, index) so that the decline in VaR since the crisis is associated with the decline in market volatility. Interestingly, dealer VaR didn't increase during the 2013 fixed-income selloff, even though volatility rose sharply, suggesting that dealers might have actively managed their risk exposures to insulate their firm-wide VaRs from price moves. In fact, an analysis of the cross-sectional behavior of dealers highlights the observation that firms that appear to have reduced their net fixed-income positions more tended to experience a larger decline in their interest rate VaR, as shown in the table below. Furthermore, dealers that reduced their positions more during the selloff experienced larger increases in their tier 1 capital and tier 1 leverage ratios in the second quarter. That is, a reduction in net positions by some dealers indeed appears to have been associated with a reduction in risk-taking.
| Table 1 |
|---|
| Measure of dealer constraint: | Correlation between Change in Net Positions and Change in Dealer Constraint |
|---|---|
| Change in interest rate value at risk (VaR) (May 1 to July 10, 2013) | 63% |
| Change in tier 1 capital ratio (March 31 to June 30, 2013) | -34% |
| Change in tier 1 leverage ratio (March 31 to June 30, 2013) | -87% |
Source: Authors' calculations, based on Federal Reserve supervisory VaR data, company reports for major U.S. chartered bank holding company affiliated-dealers, and the Federal Reserve's FR 2004 statistical release.
Notes: The table presents pairwise correlations between dealers' changes in net positions of U.S. Treasury securities, agency debt securities, agency mortgage-backed securities, and corporate securities in the ten-week period spanning the May-July run-up in yields, and dealers' changes in constraints over a matched time period.
Competing Explanations for the Role of Dealers in the Selloff
The evidence discussed so far indicates that the 2013 selloff was large, that market liquidity deteriorated, that dealers reduced their fixed-income positions, and that the reduction in positions was associated with reduced risk-taking as measured by VaR and regulatory capital ratios. These findings are compatible with two alternative explanations. The first is that dealers were unable to provide market liquidity because of constraints resulting from capital constraints. The second is that dealers decided to manage their balance sheets more conservatively at a time when investors were repricing interest rate risk rapidly. That is, dealers may have been able but unwilling to provide market liquidity.
If the constraints explanation were correct, then dealers facing tighter balance sheet constraints before the selloff would have been expected to reduce their net positions more than other dealers during the selloff. The evidence presented in the next table isn't consistent with that hypothesis. In particular, U.S. dealers with a higher VaR gap (which measures the difference between a dealer's VaR and its VaR limit), a higher Basel III tier 1 common ratio buffer (which measures the difference between a dealer's measured ratio and proposed ratio requirement), and higher tier 1 capital and tier 1 leverage ratios before the selloff tended to reduce their net positions more during the selloff. That is, dealers with greater ability to take on risk prior to the selloff actually sold off more. This relationship suggests that dealer behavior during the selloff appears to have been driven more by differences in risk appetite than by regulatory constraints.
| Table 2 |
|---|
| Measure of dealer constraint prior to the selloff: | Correlation between Change in Net Positions and Constraint Prior to the Selloff |
|---|---|
| Value at risk (VaR) gap (May 1, 2013) | -60% |
| Basel III tier 1 common ratio buffer (March 31, 2013) | -83% |
| Q1 tier 1 capital ratio (March 31, 2013) | -74% |
| Q1 tier 1 leverage ratio (March 31, 2013) | -6% |
Source: Authors' calculations, based on Federal Reserve supervisory VaR data, company reports for major U.S. chartered bank holding company-affiliated dealers, and the Federal Reserve's FR 2004 statistical release.
Notes: The table presents pairwise correlations between dealers' changes in net positions in U.S. Treasury securities, agency debt securities, agency mortgage-backed securities, and corporate securities in the ten-week period spanning the May-July run-up in yields, and dealers' constraints shortly before the selloff. The ratio requirements for Basel III tier 1 common ratio buffers are calculated using global systemically important bank (G-SIB) additional loss absorbency buckets proposed by the Financial Stability Board in November 2012.
We think the evidence supports the second hypothesis: Dealer unwillingness to supply liquidity amplified the sharp rise in rates and volatility. That is, dealers were less willing to employ balance sheets as market participants reassessed fixed-income valuations and repriced interest rate risk in response to heightened uncertainty around the stance of monetary policy. Prior to the selloff, the term premium--the risk premium investors demand for bearing duration risk--had been very low, or even negative, for some time. Moreover, measures of fixed-income volatility had been at historically low levels. Some investors (including dealers) may have viewed valuations as stretched and may have been waiting for a trigger for the market to reverse. Events in May and June 2013 may have provided the trigger to start an unwind of risk positions. Dealers responded by cutting their risk exposures and shrinking inventory. The increase in yields was thus likely caused by a broad repricing of duration risk, and not by regulatory constraints.
Please cite as:
Adrian, Tobias, Michael Fleming, Jonathan Goldberg, Morgan Lewis, Fabio M. Natalucci, and Jason J. Wu (2013). "Dealer Balance Sheet Capacity and Market Liquidity during the 2013 Selloff in Fixed Income Markets," FEDS Notes. Washington: Board of Governors of the Federal Reserve System, October 16, 2013. https://doi.org/10.17016/2380-7172.0004
Disclaimer: FEDS Notes are articles in which Board economists offer their own views and present analysis on a range of topics in economics and finance. These articles are shorter and less technically oriented than FEDS Working Papers.