
FEDS Notes
 Print
PrintOctober 15, 2014
Student Loans and Homeownership Trends
Alvaro Mezza, Kamila Sommer, and Shane Sherlund
The increases in student loan debt and delinquencies over the past few years have raised concerns about whether heavy student loan debt burdens are making it more difficult for young households to become homeowners. For example, using a large dataset of borrowers with credit records, Brown and Caldwell (2013) find that (i) during the financial crisis, homeownership rates--approximated by the presence of home-secured debt in credit files--for young individuals with student loan debt fell relatively more than for those without student loan debt, and that (ii) by the end of 2011, young individuals with student loan debt were associated with lower homeownership rates than those without such debt. However, due to data limitations, those researchers were unable to separate individuals with no student loan debt into groups with and without college education. Yet there are a number of reasons to think that individuals who went to college (albeit without incurring student debt) are quite different in homeownership attainment from those who never attended college (and, therefore, do not have any student loan debt). As such, combining individuals with no student loan debt and with or without college education into a single group could confound statistical findings related to the relationship between homeownership and student loan debt. In this note, we separate individuals with no student loan debt into groups with and without post-secondary education, and explore the patterns in homeownership attainment once college education is considered.
Using a nationally representative sample of young individuals with credit records who were between the ages of 29 and 31 in years 2004-2010, panel A in figure 1 shows that--similar to Brown and Caldwell's (2013) findings--the homeownership rate declined relatively more for those with student loan debt (the green line) than for those without student loan debt (the purple line).1 Thus, while homeownership rates were generally higher for those with student loan debt during the entire period, the difference between the rates became much smaller by the end of 2010, suggesting that student debt may have made ownership more difficult.
In contrast, panel B separates the group of individuals with no student debt (the purple line) into two subgroups: (i) those with no college education (the blue line) and (ii) those with some college education (the red line). The panel illustrates that the homeownership rates between the two groups differ substantially, with an average homeownership rate gap of about 13 percentage points over the full period. Moreover, the evolution of homeownership rate across time varies between the two groups, suggesting that combining individuals with no student loan debt and with or without college education into a single group could indeed confound statistical findings related to the relationship between homeownership and student loan debt.
Panel C compares the changes in homeownership between those with college education with and without student debt (the green and the red lines, respectively). The panel suggests that the observed declines in homeownership are not dissimilar between those with and without debt and college education.
| Figure 1: Home Ownership Rate: 2004-2010 |
|---|
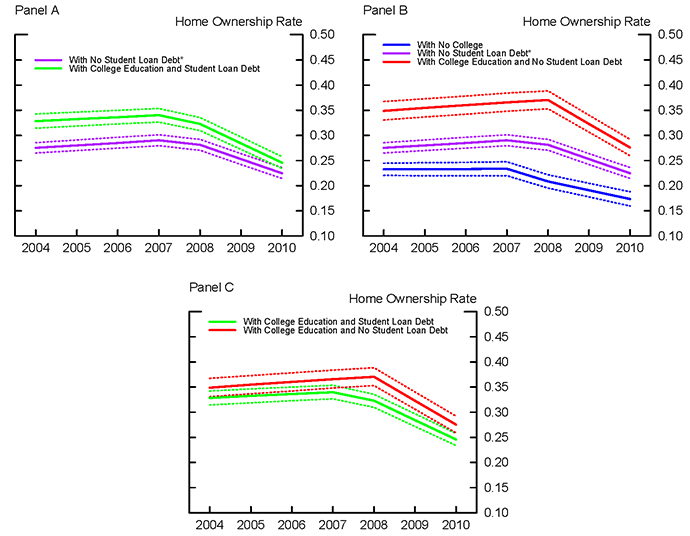 |
Source: TransUnion, LLC and National Student Clearinghouse. * Includes individuals both with and without post-secondary education. Notes: Individuals with no college denote those with no post-secondary education. Individuals with college denote those with at least some post-secondary education. Dotted lines represent 95 percent confidence intervals. |
Some important patterns underlying these relationships are summarized in Figure 2, which shows homeownership-age profiles for the same three groups in Panel B. The chart shows that individuals with no college education (the blue line) enter homeownership earlier, on average, than those with college education and with and without student loan debt (the green and red lines, respectively). However, by age 26 the homeownership rate of those with college education catches up with the homeownership rate of those with no college education and, subsequently, rises appreciably above it. For those with college education, having no student loan debt is associated with somewhat higher homeownership rates at younger ages. However, by age 30 the homeownership rates of those who attended college with and without student loan debt are not statistically significantly different from each other and by the age of 34 the rates are essentially identical. Taken together, our results suggest that for those with college education student loan debt more likely affects the timing of homeownership than people's eventual attainment of it.
| Figure 2: Home Ownership Rate: Ages 23-35 |
|---|
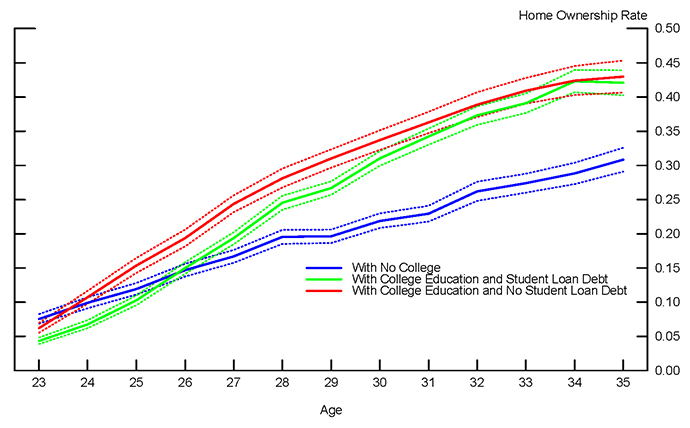 |
Source: TransUnion, LLC and National Student Clearinghouse. Notes: Individuals with no college denote those with no post-secondary education. Individuals with college denote those with at least some post-secondary education. Dotted lines represent 95 percent confidence intervals. |
A few caveats should be taken into consideration when interpreting our results. First, our results are based on relative movements in summary statistics and should not be interpreted as speaking to any causal relationship between student loans and homeownership. For example, the relatively higher homeownership rates among those who went to college but did not have any student loans might be caused by lower overall debt burdens but potentially also by other factors that we have not explicitly accounted for, such as the ability of one's family to provide funds for a down payment. Second, our analysis is limited to the period from 2004 to 2010 (due to data limitations). As such, our results cannot address how the homeownership trends in recent years may have been affected by student loan balances and take-up rates that continued to rise or by any impacts of post-crisis mortgage regulation.
Despite the aforementioned limitations, we believe that our results convey an important direction for future research, namely that college attendance is an important correlate of homeownership that, among other things, presents a challenge for isolating the role of changes in student debt on homeownership.
References
Brown, Meta and Sydnee Caldwell (2013). "Young Student Loan Borrowers Retreat from Housing and Auto Markets." Liberty Street Economics, Federal Reserve Bank of New York.
Appendix
The analysis in the note is based on a nationally representative, anonymous sample of credit bureau records randomly drawn by TransUnion, LLC, for a cohort of 34,890 young individuals who were between ages 23 and 31 in 2004. The data spans the period 1997 through 2010. Individuals are followed biannually between June 1997 and June 2003, and then in December 2004, June 2007, and December 2008 and 2010. The dataset contains several major credit bureau variables, including credit scores, tradeline debt levels, and delinquency and severe derogatory records. The National Student Clearinghouse merged their educational records anonymously onto the TransUnion credit bureau data. All personally identifiable information was removed from the data before it was provided to the Federal Reserve Board.
1. See the Appendix for a description of the underlying data. Return to text
Please cite as:
Mezza, Alvaro, Kamila Sommer, and Shane M. Sherlund (2014). "Student Loans and Homeownership Trends," FEDS Notes. Washington: Board of Governors of the Federal Reserve System, October 15, 2014. https://doi.org/10.17016/2380-7172.0031
Disclaimer: FEDS Notes are articles in which Board economists offer their own views and present analysis on a range of topics in economics and finance. These articles are shorter and less technically oriented than FEDS Working Papers.
