
IFDP Notes
 Print
PrintNovember 12, 2014
Potential Output and Recessions: Are We Fooling Ourselves?
Robert F. Martin, Teyanna Munyan, and Beth Anne Wilson 1
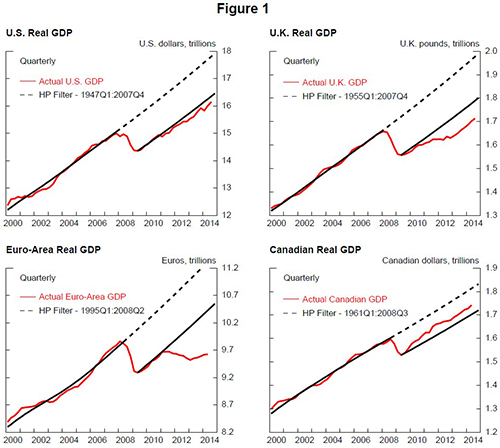
The economic collapse in the wake of the global financial crises (GFC) and the weaker-than-expected recovery in many countries have led to questions about the impact of severe downturns on economic potential. Indeed, for several major economies, the level of output is nowhere near returning to pre-crisis trend (figure 1). Such developments have resulted in repeated downward revisions to estimates of potential output by private- and public-sector forecasters. In addition, this disappointment in post-recession growth has contributed to concerns that the U.S. economy, among others, is entering an era of secular stagnation. However, the historical experience of advanced economies around recessions indicates that the current experience is less unusual than one might think. First, output typically does not return to pre-crisis trend following recessions, especially deep ones. Second, in response, forecasters repeatedly revise down measures of trend.
We use quarterly real GDP data for 23 advanced economies from around 1970 to present.2 Applying a standard recession dating technique, we identify 149 recessions (117 recessions if the Great Recession is excluded).3 We calculate pre-recession trend growth as the four-year average growth rate for each country, two years prior to each peak, and examine GDP as a percentage of this trend for each recession in our sample prior to the Great Recessions. We take care to calculate trend output in a way such that it is not influenced by the pace of output following the cyclical peak. We exclude the two years prior to the peak to prevent periods of potentially "bubble-like" growth from boosting our trend. That said, our results are robust to other definitions of trend and to estimates of potential output derived from a growth accounting framework.
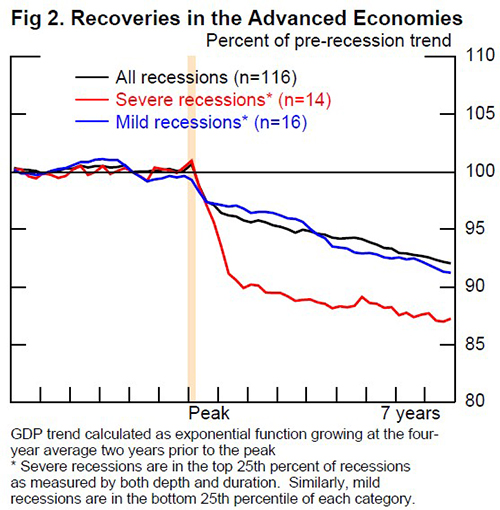
The black line in figure 2 shows the level of real GDP as a percent of its pre-recession trend around all 117 non-GFC recessions. We also calculate output performance relative to trend for two subsets of recessions--very mild and very severe.4 On average, GDP remains well below its previous trend, even for short and shallow recessions. Deep and long recessions, of course, lead to the largest cumulative output loss.5 Table 1 shows average growth rates before and after recessions, including GFC recessions. If actual growth returned to pre-crisis trend then growth immediately following recessions would be higher than average to make up the gap. In fact, the average growth in the four years after the recession trough is generally lower than prior to the pre-recession peak.
| Table 1 |
|---|
| Advanced Economy GDP | |||
|---|---|---|---|
| Percent Change, a.r. | |||
| 6-2 yrs prior to peak | 4 yrs post-trough | p-value* | |
| All Recessions ex. GFC (n=116) | 3.7 | 3.1 | 0.02* |
| Severe (n=14) | 3.9 | 3.6 | 0.61 |
| Mild (n=16) | 3.3 | 2.1 | 0.02* |
| All others (n=86) | 3.7 | 3.2 | 0.10 |
* Significant at the 95 percent level.
Economic models usually assume that recession-induced gaps will close over time, typically via a period of above trend growth. In our results, growth is not faster after the recession than before, implying that the recession-induced gap is closed primarily by revising estimates of trend output growth lower. Interestingly, much of the downward revision to estimates of trend output happens well into the recovery. In particular, as economies recover and the lower level of actual output persists, potential output is gradually revised down toward actual GDP.
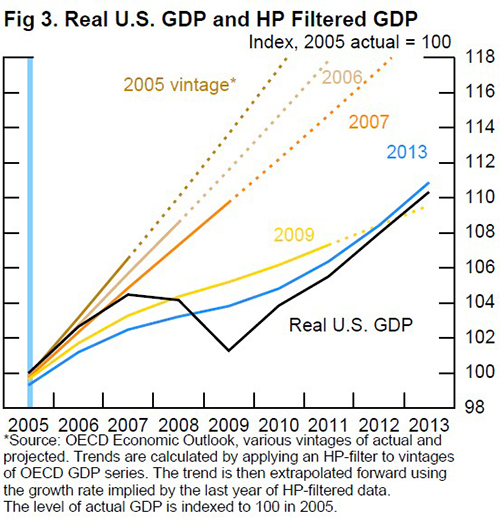
One reason output gaps are typically viewed as transitory is likely that techniques to calculate trend are often two sided, bending in response to the evolution of actual data. Figure 3 illustrates this phenomenon using U.S. real GDP data before and after the 2009 recession. As GDP declines during the recession, trend output, as measured here using a Hodrick-Prescott (HP) filter, gradually moderates toward actual output--reducing the negative gap between actual and trend data around the recession and increasing the positive gap prior to the start of the recession. Economists and forecasting institutions calculating trend using HP-filtered data in 2007 had a very different sense of the cyclical position compared to their impression now for that same year.
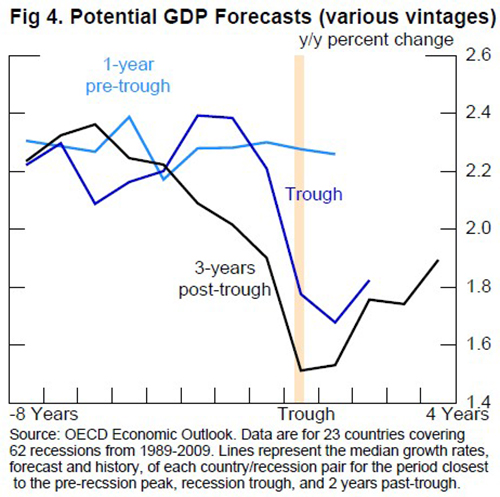
This pattern of revision also holds true if potential is calculated using a growth accounting framework, the method used by policymaking institutions such as the OECD. To see how estimates of potential using this methodology are adjusted around turning points, we use projections from the OECD's bi-annual economic outlook for 62 recessions from 1989 to 2009 in 23 advanced economies and construct a database of various vintages of the OECD's estimates of potential growth--i.e. forecasts made a year prior to the recession trough, at the trough, and three years after the trough. Figure 4 shows these vintages averaged around recession troughs. These data reveal a pattern of downward revisions to the level of potential around turning points. Even three years post-trough, potential growth is still being revised down. This same pattern of systematic underestimation of the impact of recessions on potential and the subsequent downward revision of potential output holds true for other policymaking institutions in the wake of the Great Recession. While it is tempting to attribute this to the impact of the financial crisis on growth, the discussion above suggests that this pattern is long standing. Ironically, despite being known as the dismal science, economists may be too optimistic about the recovery path of output following recessions.
Although these calculations are simple, they raise deeper questions about the impact of recessions on trend output. The finding that recessions tend to depress the long-run level of output may imply that demand shocks have permanent effects. The sustained deviation of the level of output from pre-crisis trend points to flaws in the way the economics profession models the recovery of output to economic shocks and raises further doubts about the reliance on measures of output gaps to determine economic slack. For policymakers, the results also point to the cost of recessions, especially deep and long ones, and provide a rationale for strong and rapid policy responses to economic downturns.
Bibliography
Cerra, Valerie and Sweta Chaman Saxena. 2008. "Growth Dynamics: The Myth of Economic Recovery." American Economic Review, 98(1): 439-457. http://www.aeaweb.org/articles.php?doi=10.1257/aer.98.1.439 
Haltmaier, Jane (2012) "Do Recessions Affect Potential Output?" International Finance Discussion Paper, 1066. http://www.federalreserve.gov/pubs/ifdp/2012/1066/ifdp1066.pdf (PDF)
Harding, Don and Adrian Rodney Pagan. 2002. "Dissecting the Cycle: a Methodological Investigation." Journal of Monetary Economics, 49(2): pp 365-381. https://ideas.repec.org/a/eee/moneco/v49y2002i2p365-381.html
Howard, Greg, Robert F. Martin, and Beth Anne Wilson. 2011. "Are Recoveries from Banking and Financial Crises Really So Different?" International Finance Discussion Paper, 1037. http://www.federalreserve.gov/Pubs/ifdp/2011/1037/default.htm
Oulton, Nicholas and Sebastiá-Barriel, María. 2013. "Long and Short-Term Effects of the Financial Crisis on Labour Productivity, Capital and Output." CEP Discussion Papers, CEPDP1185. Centre for Economic Performance, London School of Economics and Political Science, London, UK. http://eprints.lse.ac.uk/48926/
1. Robert F. Martin ([email protected]) is Chief of Global Monetary and Sovereign Markets, Teyanna Munyan is a Senior Research Assistant in Advanced Foreign Economies, and Beth Anne Wilson ([email protected]) is an Associate Director in the Division of International Finance, Board of Governors of the Federal Reserve System, Washington, D.C. 20551 U.S.A. We thank Gregory Howard for contributions, Andrew Brooks for excellent assistance, and Matteo Iacoviello and participants at workshops within the Federal Reserve Board for their comments. The views in this paper are solely the responsibility of the authors and should not be interpreted as reflecting the views of the Board of Governors of the Federal Reserve System or of any other person associated with the Federal Reserve System. Return to text
2. The 23 countries are: Australia, Austria, Belgium, Canada, Denmark, Finland, France, Germany, Greece, Iceland, Ireland, Italy, Japan, Luxembourg, Netherlands, Norway, New Zealand, Portugal, Sweden, Spain, Switzerland, United Kingdom, and United States. Return to text
3. We identify recessions using the Bry-Boschen procedure (BBQ) for quarterly data as described by Harding and Pagan (2002). The BBQ method identifies cyclical peaks and troughs as local maxima in the two quarters preceding and the two quarters following. It then eliminates maxima that do not alternate between peaks and troughs or do not have a long enough time span, in this case two quarters from a peak to trough and four quarters from a trough to peak. Once these criteria are met, recessions are defined as the time between a peak and a trough. Return to text
4. Mild recessions are those in the bottom 25th percentile in terms of distance from pre-recession peak and duration of output decline. Severe recessions are those in the top 25th percentile of recession depth and duration. For more details, see Howard et al. (2011). Return to text
5. See also Cerra and Saxena (2008), Haltmaier (2012), and Oulton and Sebastiá-Barriel (2013) which find similar long-run effects on output from deep recessions. Varying the specification of our regression or the definition of pre-crisis trend can modify these loss estimates, but our results all suggest a sustained hit to output, especially from severe recessions. Not surprisingly, including the Great Recession strengthens the results. Return to text
Please cite as:
Martin, Robert F., Teyanna Munyan and Beth Anne Wilson (2014). "Potential Output and Recessions: Are We Fooling Ourselves?," IFDP Notes. Washington: Board of Governors of the Federal Reserve System, November 12, 2014. https://doi.org/10.17016/2573-2129.06
Disclaimer: IFDP Notes are articles in which Board economists offer their own views and present analysis on a range of topics in economics and finance. These articles are shorter and less technically oriented than IFDP Working Papers.
