
IFDP Notes
 Print
PrintNovember 13, 2014
The Surprising Strength of U.S. Imports During the Recovery
Michele Cavallo
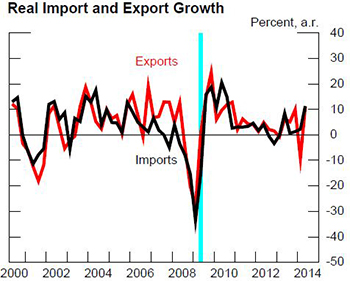
Import and exports of goods and services, after rebounding sharply in the immediate post-recession period, have more recently returned to a pace of growth more in line with their pre-recession averages (Figure 1). On net, since the start of the recovery in 2009:Q3 the external sector has made a small negative contribution to U.S. growth. This contribution, as indicated in Table 1, is noticeably less negative than the average drag during the previous three recoveries. In part, this difference reflects the larger contribution of exports in this recovery, which have been supported by faster foreign trade-weighted GDP growth and less dollar appreciation than typical during recoveries. The relatively smaller drag from net exports also reflects the fact that total imports have subtracted from growth less than in previous recoveries, an outcome that might have been expected given the lower dollar and the slower pace of U.S. growth in the current recovery. However, rather than reflecting restraint from these variables, the smaller drag of imports on GDP growth has been the result of the recent trend decline in the volume of oil imports, in turn driven by the ongoing expansion in U.S. oil production.
| Table 1 |
|---|
| Current | Previous | |
|---|---|---|
| 1. Net Exports | -0.14 | -0.34 |
| Of which: | ||
| 2. Exports | 0.76 | 0.65 |
| 3. Imports | -0.89 | -1 |
| Of which: | ||
| 4. Oil Imports | 0.11 | -0.04 |
| 5. Non-oil Imports | -1.01 | -0.96 |
| Memo: | ||
| 6. GDP Growth | 2.21 | 3.71 |
*Annual rate; Average of 20 quarters after trough; Recoveries are U.S. GDP expansions following the business cycle troughs of 1982: Q4, 1991:Q1, 2001:Q4, and 2009:Q2 as dated by the NBER.
In contrast, non-oil imports have expanded as strongly as in previous recoveries, restraining growth by about the same magnitude. Since the start of the recovery, the ratio of non-oil imports to GDP has risen sharply, rebounding from a stunning decline during the recession to return to its pre-recession high of nearly 15 percent. This rapid rebound partly reflects the highly cyclical nature of the goods portion of imports, which tends to fall more than GDP in recessions and then outpace GDP in recoveries. However, considering the weaker dollar and the more subdued U.S. GDP growth in the current recovery, it is surprising how strong import growth has been.
What might explain the surprising strength in non-oil imports? One possibility is that the recession has led to a permanent shift in demand towards imports. This shift could reflect either a loss in U.S. production capacity during the recession, so that the recovery in demand is now being met by higher imports rather than increased domestic production or through an increased preference for imports. Alternatively, the strength in imports might reflect the particular composition of domestic demand during this recovery, with demand growth more concentrated in categories with larger import shares.
To verify the importance of import substitution versus demand composition effects in boosting imports, I examine evidence from 22 manufacturing sectors. The scatterplot in Figure 2 compares growth in imports for a given manufacturing category over the recovery, on the vertical axis, to growth in industrial production, in that same category, shown on the horizontal axis. The figure shows that, since the recession trough, sectors experiencing larger increases in imports have generally also exhibited larger increases in industrial production. This suggests that the shift up in aggregate imports is not being driven primarily by substitution towards imports, but rather by increases in domestic demand that fall upon both domestic products and imports.
Turning to the role of demand composition in boosting imports, Figure 3 compares the increase in real domestic demand for these same industries (on the horizontal axis) with the extent of import penetration in the industry (on the vertical axis). Import penetration is defined as the share of domestic demand that is supplied by imports and is measured over the two years preceding the recession. The scatterplot reveals that sectors with larger increases in domestic demand since the start of the recovery are also those that historically have had higher import penetration ratios. These data support the hypothesis that the increase in the import-to-GDP ratio in part reflects a recent shift in demand towards categories that are relatively import intensive.
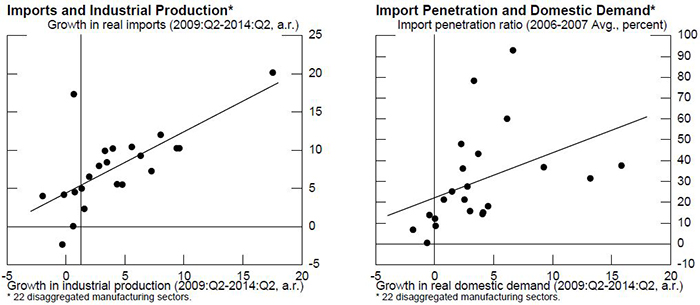
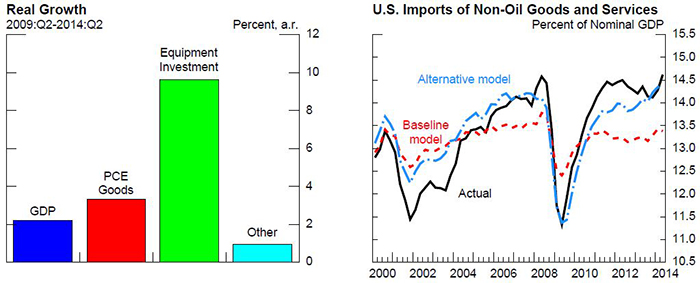
Figure 4 provides further evidence in support of this view. Personal consumption expenditures (PCE) on goods (the red bar) and equipment investment (the green bar), account for proportionately more imports than do other major spending categories. So far, in the recovery, growth of goods PCE has been positive while growth in equipment investment has been quite strong relative to an aggregate of all other spending categories (the little light blue bar). In contrast, growth in these other categories, including fixed investment in structures and government expenditures, has been generally subdued, unlike in the typical recovery when these sectors were historically more supportive of growth.
The lopsided composition of demand growth might therefore help explain the greater proportion of imports in this recovery. To corroborate the validity of this conjecture, I estimate a forecast model for non-oil goods imports that uses goods PCE, equipment investment, and the change in private inventories as explanatory variables for import demand, and contrast its prediction with that of a baseline model that uses total U.S. GDP as independent variable.1 In comparison to the baseline model, this alternative model thus excludes the components of demand with less import content. The blue line in Figure 5 shows that the ratio of non-oil imports to GDP predicted by the alternative model captures the actual rebound better than the baseline model (the red line), which predicts the ratio to stabilize well below its pre-recession level.
This finding reinforces the view that the composition of demand growth is key to understanding the unexpected strength of imports in this recovery. In line with this reasoning, as sectors with less import content pick up again going forward, non-oil imports might shift back towards a more traditional alignment with GDP.
1. Both models also control for changes in relative prices via the real exchange rate. Return to text
Please cite as:
Cavallo, Michele (2014). "The Surprising Strength of U.S. Imports During the Recovery," IFDP notes. Washington: Board of Governors of the Federal Reserve System, November 13, 2014. https://doi.org/10.17016/2573-2129.07
Disclaimer: IFDP Notes are articles in which Board economists offer their own views and present analysis on a range of topics in economics and finance. These articles are shorter and less technically oriented than IFDP Working Papers.
