
Senior Credit Officer Opinion Survey on Dealer Financing Terms
June 2014
 Print
PrintSummary
In this Section:
The June 2014 Senior Credit Officer Opinion Survey on Dealer Financing Terms collected qualitative information on changes over the previous three months in credit terms and conditions in securities financing and over-the-counter (OTC) derivatives markets. In addition to the core set of questions, this survey included two sets of special questions. The first set asked about changes in the use of margin lending since June 2013 by retail investors and by different types of institutional managers. The second set of special questions queried dealers about changes in the financing terms and demand for funding of tranches of collateralized loan obligations (CLOs) since the beginning of 2014. The 22 institutions participating in the survey account for almost all dealer financing of dollar-denominated securities provided to nondealers and are the most active intermediaries in OTC derivatives markets. The survey was conducted during the period between May 20, 2014, and June 2, 2014. The core questions asked about changes between March 2014 and May 2014.1
Responses to the core questions in the June survey pointed to little change over the past three months in the credit terms applicable to most classes of counterparties covered by the survey. The responses, however, offered a few insights regarding recent developments and current areas of focus in dealer-intermediated markets:
- A net fraction of about one-fifth of respondents--the lowest value to date--reported an increase in the amount of resources and attention devoted to the management of concentrated exposures to central counterparties and other financial market utilities.
- The use of financial leverage by the counterparties covered in the survey was generally reported to be unchanged over the past three months.
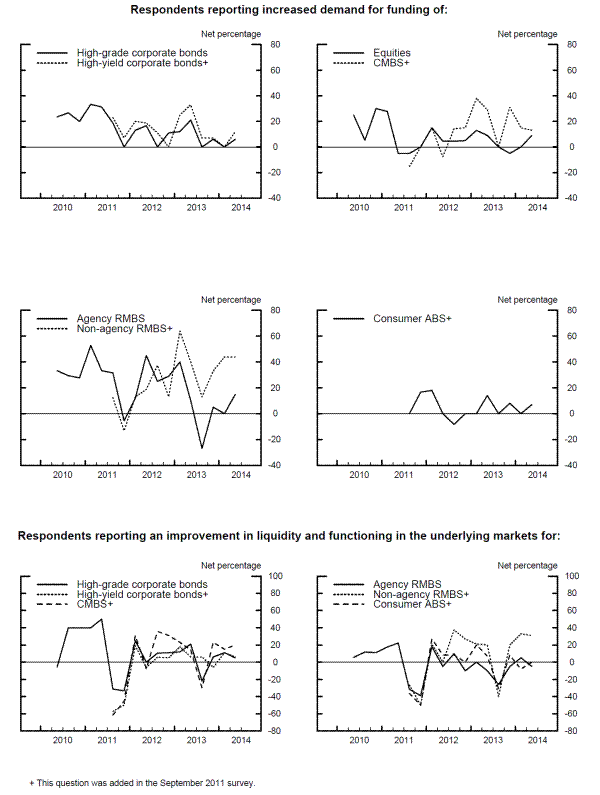
- With regard to securities financing, nearly one-half of dealers reported an increase in demand for funding of non-agency residential mortgage-backed securities (RMBS), and one-fourth of respondents also noted increased demand for term funding against such collateral.
- One-third of respondents assessed liquidity and functioning as having improved in the non-agency RMBS market, while conditions in the cash markets for other collateral types were reported to be basically unchanged.
- In response to the special questions on changes in the use of margin financing, dealers indicated that the use of margin financing subject to traditional Regulation T limits had remained basically unchanged, on net, since June 2013.2 By contrast, significant fractions of dealers reported increased use of margin financing under the Financial Industry Regulatory Authority (FINRA) portfolio margining program and under so-called enhanced leverage programs.3 Between one-half and two-thirds of respondents pointed to increased use of margin financing by institutional investors for technology and social media equities (both small and large cap) and other large-cap equities.
- In response to the special questions focused on changes in the financing of tranches of CLOs since the beginning of the year, roughly two-fifths of respondents indicated that funding terms had eased somewhat. Three-fourths of dealers noted increased demand for funding of CLO tranches by credit-oriented hedge funds, and nearly one-half of dealers noted increased demand by other hedge funds. Three-fourths of the respondents indicated that the securities being financed were a mix of triple-A rated and mezzanine tranches.
Counterparty Types
(Questions 1-40)
Dealers and Other Financial Intermediaries. In the June survey, nearly all respondents indicated that the amount of resources and attention devoted to the management of concentrated credit exposure to dealers and other financial intermediaries remained basically unchanged over the past three months. (See the exhibit "Management of Concentrated Credit Exposures and Indicators of Supply of Credit.")
Central Counterparties and Other Financial Utilities. The vast majority of respondents indicated that the amount of resources and attention devoted to the management of concentrated credit exposures to central counterparties and other financial utilities remained basically unchanged over the past three months, with only a net share of one-fifth of dealers pointing to an increase. This share is the lowest net fraction reporting increased resources and attention since the question was introduced to the survey in 2011. More than four-fifths of respondents reported that changes in the practices of central counterparties, including changes in margin requirements and haircuts, had minimal or no influence on the credit terms applied to clients on bilateral transactions that are not cleared.
Hedge Funds. As in the past several surveys, respondents to the June survey indicated that both price terms (such as financing rates) and nonprice terms (including haircuts, maximum maturity, covenants, cure periods, cross-default provisions, or other documentation features) offered to hedge funds for securities financing and OTC derivatives transactions were basically unchanged over the past three months. Dealers also reported that the use of financial leverage by hedge funds and the availability of additional (and currently not utilized) financial leverage under agreements currently in place with hedge funds over the past three months had remained basically unchanged. (See the exhibit "Use of Financial Leverage.") A small number of dealers indicated that the provision of differential terms to most-favored clients had increased over the past three months, and nearly one-fourth of respondents noted increased intensity of efforts to negotiate more-favorable price and nonprice terms.
Trading Real Estate Investment Trusts. Respondents to the June survey indicated that both price and nonprice terms offered to trading real estate investment trusts (REITs) had remained basically unchanged, as had their use of financial leverage. This finding stands in contrast to recent surveys in which dealers had reported having tightened nonprice terms to trading REITs and that the use of leverage by trading REITs had decreased on net. Provision of differential terms to most-favored clients and the intensity of efforts by clients to negotiate more-favorable terms were reported to be little changed on balance.
Mutual Funds, Exchange-Traded Funds, Pension Plans, and Endowments. As in the past few surveys, respondents to the June survey indicated that both price and nonprice terms offered to mutual funds, exchange-traded funds, pension plans, and endowments had remained basically unchanged over the past three months. Provision of differential terms to most-favored clients and the intensity of efforts by clients to negotiate more-favorable terms also were reported to be little changed, as was the use of financial leverage.
Insurance Companies. As in recent surveys, respondents in June noted that price terms offered to insurance companies had changed little over the past three months. A small number of dealers reported that nonprice terms had eased somewhat. Provision of differential terms to most-favored clients and the intensity of efforts by clients to negotiate more-favorable terms also were reported to be little changed, as was the use of financial leverage.
Separately Managed Accounts Established with Investment Advisers. Nearly all of the dealers indicated in the June survey that price and nonprice terms negotiated by investment advisers on behalf of separately managed accounts were basically unchanged over the past three months, as in recent surveys. Provision of differential terms to most-favored clients and the use of financial leverage by investment advisers were also reported to be basically unchanged, as was the intensity of efforts by investment advisers to negotiate more-favorable terms.
Nonfinancial Corporations. On net, respondents to the June survey indicated that price terms offered to nonfinancial corporations had remained basically unchanged over the past three months. As in the March survey, a few dealers reported an easing of nonprice terms offered to these clients. These respondents cited more-aggressive competition from other institutions as the most important reason for the easing. As in the March survey, roughly one-fourth of respondents reported an increase in the intensity of efforts by nonfinancial corporations to negotiate more-favorable terms.
Mark and Collateral Disputes. As in previous surveys, the vast majority of respondents in June indicated that the volume, persistence, and duration of mark and collateral disputes with each counterparty type included in the survey were little changed over the past three months.
Over-the-Counter Derivatives
(Questions 41-51)
Over the past three months, the nonprice terms incorporated in new or renegotiated OTC derivatives master agreements were reported to be basically unchanged on net.4 As in recent previous surveys, nearly all of the respondents in June indicated that initial margins (which fall outside the scope of master agreements) had also remained basically unchanged over the past three months for both average and most-favored clients and for all contract types included in the survey. Posting of nonstandard collateral--that is, collateral other than cash and U.S. Treasury securities--also remained basically unchanged. For all contract types, the volume, duration, and persistence of mark and collateral disputes were reported to be basically unchanged over the past three months.
Securities Financing
(Questions 52-79)5
As in previous surveys, dealers reported that the credit terms under which most types of securities included in the survey are financed were little changed, on balance, over the past three months. A few respondents reported an easing of maximum maturity of non-agency RMBS funding for average clients, as well as easing of haircuts and maximum maturity of non-agency RMBS and commercial mortgage-backed securities (CMBS) funding for most-favored clients.
As in the March survey, nearly one-half of dealers reported an increase in demand for funding of non-agency RMBS. One-fourth of respondents also noted increased demand for term funding--that is, funding with a maturity greater than 30 days--against such collateral. For most other collateral types covered in the survey, small net fractions of dealers indicated increased demand for funding and term funding. (See the exhibit "Measures of Demand for Funding and Market Functioning.")
For most collateral types, respondents indicated that the liquidity and functioning of the underlying markets remained basically unchanged over the past three months.6 However, nearly one-third of respondents noted improved liquidity and functioning in the non-agency RMBS market, and one-fifth noted improved liquidity and functioning in the CMBS market. Finally, all of the respondents reported that the volume, duration, and persistence of mark and collateral disputes were basically unchanged for all of the collateral types.
Special Questions on Margin Lending
(Questions 81-86)
Dealers were queried about changes since June 2013 in the use of margin financing subject to Regulation T limits, subject to the FINRA portfolio margining program, and under so-called enhanced leverage programs.7 Dealers were also asked about changes in the use of margin lending for different classes of equities.8
On net, dealers indicated that the use of margin financing subject to traditional Regulation T limits by retail investors and by institutional managers had remained basically unchanged since June 2013. However, roughly one-half of respondents, on net, indicated increased use of margin financing under FINRA's portfolio margining program and under enhanced leverage programs by fundamentally oriented and quantitatively oriented equity long-short hedge funds. For all other types of hedge funds included in the survey, smaller net fractions of dealers also noted an increase in both areas.
With respect to the classes of equities for which institutional investors have increased their use of margin lending (considering all types of financing available), between one-half and two-thirds of respondents pointed to technology and social media equities (both small- and large-cap) and other large-cap equities. On net, between one-fifth and two-fifths of dealers also reported increased use of margin financing by institutional investors for other small-cap equities and for non-U.S. equities.
Special Questions on Financing of Tranches of Collateralized Loan Obligations
(Question 87-89)
In this set of special questions, dealers were queried about changes since the beginning of 2014 in the funding terms for CLO tranches and in the demand for funding of such assets by investors of specified types over that period.9
About two-fifths of respondents indicated that the terms under which CLO tranches are funded have eased somewhat since the beginning of the year. Three-fourths of dealers pointed to increased demand for funding by credit-oriented hedge funds, and nearly one-half of dealers noted increased demand by other hedge funds. Respondents indicated that demand for funding by other classes of institutional investors (such as private equity firms and other traditionally unlevered investors) had remained roughly unchanged. Three-fourths of the respondents indicated that the securities being financed were either mostly triple-A rated tranches with some mezzanine tranches or a mix of triple-A rated and mezzanine tranches.
This document was prepared by Michael Gordy and Yesol Huh, Division of Research and Statistics, Board of Governors of the Federal Reserve System. Assistance in developing and administering the survey was provided by staff members in the Statistics Function and the Markets Group at the Federal Reserve Bank of New York.
Exhibit 1: Management of Concentrated Credit Exposures and Indicators of Supply of Credit
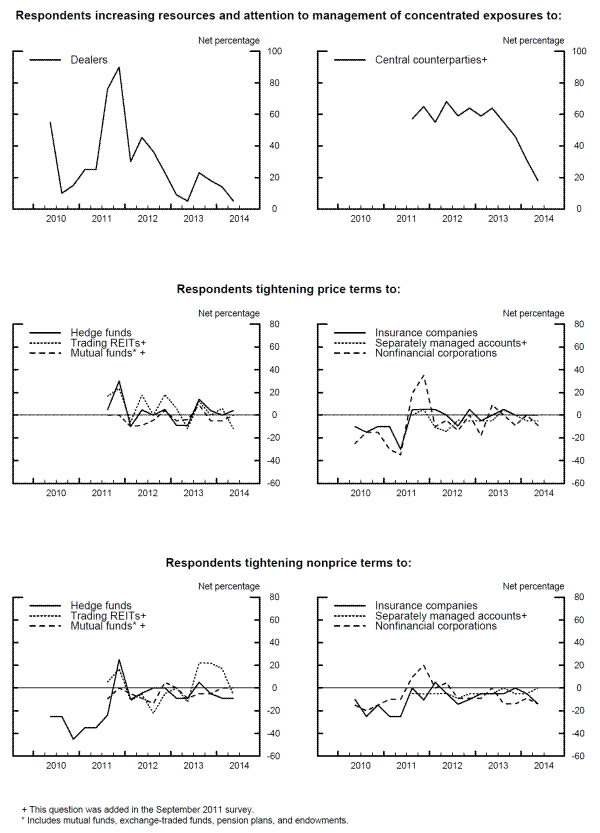
Exhibit 2: Use of Financial Leverage
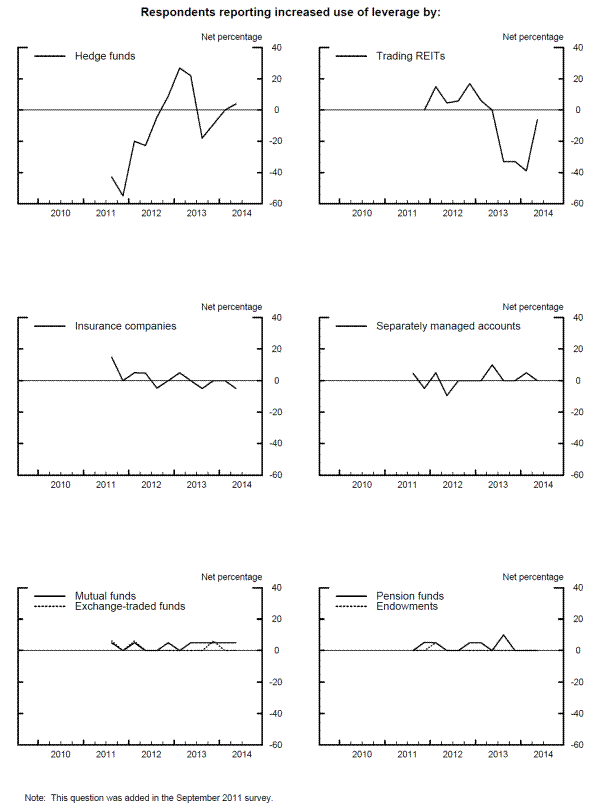
Exhibit 3: Measures of Demand of Funding and Market Functioning
Results of the June 2014 Senior Credit Officer Opinion Survey on Dealer Financing Terms
The following results include the original instructions provided to the survey respondents. Please note that percentages are based on the number of financial institutions that gave responses other than "Not applicable." Components may not add to totals due to rounding.
Counterparty Types
In this Section:
- Dealers and Other Financial Intermediaries
- Central Counterparties and Other Financial Utilities
- Hedge Funds
- Trading Real Estate Investment Trusts
- Mutual Funds, Exchange-Traded Funds, Pension Plans, and Endowments
- Insurance Companies
- Separately Managed Accounts Established with Investment Advisers
- Nonfinancial Corporations
- Mark and Collateral Disputes
Questions 1 through 40 ask about credit terms applicable to, and mark and collateral disputes with, different counterparty types, considering the entire range of securities financing and over-the-counter (OTC) derivatives transactions. Question 1 focuses on dealers and other financial intermediaries as counterparties; questions 2 and 3 on central counterparties and other financial utilities; questions 4 through 10 focus on hedge funds; questions 11 through 16 on trading real estate investment trusts (REITs); questions 17 through 22 on mutual funds, exchange-traded funds (ETFs), pension plans, and endowments; questions 23 through 28 on insurance companies; questions 29 through 34 on separately managed accounts established with investment advisers; and questions 35 through 38 on nonfinancial corporations. Questions 39 and 40 ask about mark and collateral disputes for each of the aforementioned counterparty types.
In some questions, the survey differentiates between the compensation demanded for bearing credit risk (price terms) and the contractual provisions used to mitigate exposures (nonprice terms). If your institution's terms have tightened or eased over the past three months, please so report them regardless of how they stand relative to longer-term norms. Please focus your response on dollar-denominated instruments; if material differences exist with respect to instruments denominated in other currencies, please explain in the appropriate comment space. Where material differences exist across different business areas--for example, between traditional prime brokerage and OTC derivatives--please answer with regard to the business area generating the most exposure and explain in the appropriate comment space.
Dealers and Other Financial Intermediaries
1. Over the past three months, how has the amount of resources and attention your firm devotes to management of concentrated credit exposure to dealers and other financial intermediaries (such as large banking institutions) changed?
| Number of Respondents | Percent | |
|---|---|---|
| Increased considerably | 0 | 0.0 |
| Increased somewhat | 1 | 4.5 |
| Remained basically unchanged | 21 | 95.5 |
| Decreased somewhat | 0 | 0.0 |
| Decreased considerably | 0 | 0.0 |
| Total | 22 | 100.0 |
Central Counterparties and Other Financial Utilities
2. Over the past three months, how has the amount of resources and attention your firm devotes to management of concentrated credit exposure to central counterparties and other financial utilities changed?
| Number of Respondents | Percent | |
|---|---|---|
| Increased considerably | 0 | 0.0 |
| Increased somewhat | 5 | 22.7 |
| Remained basically unchanged | 16 | 72.7 |
| Decreased somewhat | 1 | 4.5 |
| Decreased considerably | 0 | 0.0 |
| Total | 22 | 100.0 |
3. To what extent have changes in the practices of central counterparties, including margin requirements and haircuts, influenced the credit terms your institution applies to clients on bilateral transactions which are not cleared?
| Number of Respondents | Percent | |
|---|---|---|
| To a considerable extent | 0 | 0.0 |
| To some extent | 4 | 18.2 |
| To a minimal extent | 10 | 45.5 |
| Not at all | 8 | 36.4 |
| Total | 22 | 100.0 |
Hedge Funds
4. Over the past three months, how have the price terms (for example, financing rates) offered to hedge funds as reflected across the entire spectrum of securities financing and OTC derivatives transaction types changed, regardless of nonprice terms? (Please indicate tightening if terms have become more stringent—for example, if financing rates have risen.)
| Number of Respondents | Percent | |
|---|---|---|
| Tightened considerably | 0 | 0.0 |
| Tightened somewhat | 2 | 9.1 |
| Remained basically unchanged | 19 | 86.4 |
| Eased somewhat | 1 | 4.5 |
| Eased considerably | 0 | 0.0 |
| Total | 22 | 100.0 |
5. Over the past three months, how has your use of nonprice terms (for example, haircuts, maximum maturity, covenants, cure periods, cross-default provisions, or other documentation features) with respect to hedge funds across the entire spectrum of securities financing and OTC derivatives transaction types changed, regardless of price terms? (Please indicate tightening if terms have become more stringent—for example, if haircuts have been increased.)
| Number of Respondents | Percent | |
|---|---|---|
| Tightened considerably | 0 | 0.0 |
| Tightened somewhat | 0 | 0.0 |
| Remained basically unchanged | 20 | 90.9 |
| Eased somewhat | 2 | 9.1 |
| Eased considerably | 0 | 0.0 |
| Total | 22 | 100.0 |
6. To the extent that the price or nonprice terms applied to hedge funds have tightened or eased over the past three months (as reflected in your responses to questions 4 and 5), what are the most important reasons for the change?
- Possible reasons for tightening
- Deterioration in current or expected financial strength of counterparties
Number of Respondents Percent First in importance 0 0.0 Second in importance 0 0.0 Third in importance 0 0.0 Total 0 0.0
- Reduced willingness of your institution to take on risk
Number of Respondents Percent First in importance 1 100.0 Second in importance 0 0.0 Third in importance 0 0.0 Total 1 100.0
- Adoption of more-stringent market conventions (that is, collateral terms and agreements, ISDA protocols)
- Higher internal treasury charges for funding
Number of Respondents Percent First in importance 0 0.0 Second in importance 0 0.0 Third in importance 0 0.0 Total 0 0.0
- Diminished availability of balance sheet or capital at your institution
Number of Respondents Percent First in importance 0 0.0 Second in importance 0 0.0 Third in importance 0 0.0 Total 0 0.0 - Worsening in general market liquidity and functioning
Number of Respondents Percent First in importance 0 0.0 Second in importance 0 0.0 Third in importance 0 0.0 Total 0 0.0
- Less-aggressive competition from other institutions
Number of Respondents Percent First in importance 1 100.0 Second in importance 0 0.0 Third in importance 0 0.0 Total 1 100.0
Number of Respondents Percent First in importance 0 0.0 Second in importance 0 0.0 Third in importance 0 0.0 Total 0 0.0
- Deterioration in current or expected financial strength of counterparties
- Possible reasons for easing
- Improvement in current or expected financial strength of counterparties
Number of Respondents Percent First in importance 0 0.0 Second in importance 0 0.0 Third in importance 1 100.0 Total 1 100.0
- Increased willingness of your institution to take on risk
Number of Respondents Percent First in importance 0 0.0 Second in importance 2 100.0 Third in importance 0 0.0 Total 2 100.0
- Adoption of less-stringent market conventions (that is, collateral terms and agreements, ISDA protocols)
Number of Respondents Percent First in importance 0 0.0 Second in importance 0 0.0 Third in importance 0 0.0 Total 0 0.0
- Lower internal treasury charges for funding
Number of Respondents Percent First in importance 0 0.0 Second in importance 0 0.0 Third in importance 0 0.0 Total 0 0.0
- Increased availability of balance sheet or capital at your institution
Number of Respondents Percent First in importance 0 0.0 Second in importance 0 0.0 Third in importance 0 0.0 Total 0 0.0
- Improvement in general market liquidity and functioning
Number of Respondents Percent First in importance 1 100.0 Second in importance 0 0.0 Third in importance 0 0.0 Total 1 100.0
- More-aggressive competition from other institutions
Number of Respondents Percent First in importance 2 100.0 Second in importance 0 0.0 Third in importance 0 0.0 Total 2 100.0
- Improvement in current or expected financial strength of counterparties
7. How has the intensity of efforts by hedge funds to negotiate more-favorable price and nonprice terms changed over the past three months?
| Number of Respondents | Percent | |
|---|---|---|
| Increased considerably | 0 | 0.0 |
| Increased somewhat | 5 | 22.7 |
| Remained basically unchanged | 17 | 77.3 |
| Decreased somewhat | 0 | 0.0 |
| Decreased considerably | 0 | 0.0 |
| Total | 22 | 100.0 |
8. Considering the entire range of transactions facilitated by your institution for such clients, how has the use of financial leverage by hedge funds changed over the past three months?
| Number of Respondents | Percent | |
|---|---|---|
| Increased considerably | 0 | 0.0 |
| Increased somewhat | 2 | 9.1 |
| Remained basically unchanged | 19 | 86.4 |
| Decreased somewhat | 1 | 4.5 |
| Decreased considerably | 0 | 0.0 |
| Total | 22 | 100.0 |
9. Considering the entire range of transactions facilitated by your institution for such clients, how has the availability of additional (and currently unutilized) financial leverage under agreements currently in place with hedge funds (for example, under prime broker, warehouse agreements, and other committed but undrawn or partly drawn facilities) changed over the past three months?
| Number of Respondents | Percent | |
|---|---|---|
| Increased considerably | 0 | 0.0 |
| Increased somewhat | 3 | 13.6 |
| Remained basically unchanged | 18 | 81.8 |
| Decreased somewhat | 1 | 4.5 |
| Decreased considerably | 0 | 0.0 |
| Total | 22 | 100.0 |
10. How has the provision of differential terms by your institution to most-favored (as a function of breadth, duration, and extent of relationship) hedge funds changed over the past three months?
| Number of Respondents | Percent | |
|---|---|---|
| Increased considerably | 0 | 0.0 |
| Increased somewhat | 3 | 13.6 |
| Remained basically unchanged | 19 | 86.4 |
| Decreased somewhat | 0 | 0.0 |
| Decreased considerably | 0 | 0.0 |
| Total | 22 | 100.0 |
Trading Real Estate Investment Trusts
11. Over the past three months, how have the price terms (for example, financing rates) offered to trading REITs as reflected across the entire spectrum of securities financing and OTC derivatives transaction types changed, regardless of nonprice terms? (Please indicate tightening if terms have become more stringent--for example, if financing rates have risen.)
| Number of Respondents | Percent | |
|---|---|---|
| Tightened considerably | 0 | 0.0 |
| Tightened somewhat | 0 | 0.0 |
| Remained basically unchanged | 15 | 88.2 |
| Eased somewhat | 2 | 11.8 |
| Eased considerably | 0 | 0.0 |
| Total | 17 | 100.0 |
12. Over the past three months, how has your use of nonprice terms (for example, haircuts, maximum maturity, covenants, cure periods, cross-default provisions or other documentation features) with respect to trading REITs across the entire spectrum of securities financing and OTC derivatives transaction types changed, regardless of price terms? (Please indicate tightening if terms have become more stringent--for example, if haircuts have been increased.)
| Number of Respondents | Percent | |
|---|---|---|
| Tightened considerably | 0 | 0.0 |
| Tightened somewhat | 0 | 0.0 |
| Remained basically unchanged | 17 | 94.4 |
| Eased somewhat | 1 | 5.6 |
| Eased considerably | 0 | 0.0 |
| Total | 18 | 100.0 |
13. To the extent that the price or nonprice terms applied to trading REITs have tightened or eased over the past three months (as reflected in your responses to questions 11 and 12), what are the most important reasons for the change?
- Possible reasons for tightening
- Deterioration in current or expected financial strength of counterparties
Number of Respondents Percent First in importance 0 0.0 Second in importance 0 0.0 Third in importance 0 0.0 Total 0 0.0
- Reduced willingness of your institution to take on risk
Number of Respondents Percent First in importance 0 0.0 Second in importance 0 0.0 Third in importance 0 0.0 Total 0 0.0
- Adoption of more-stringent market conventions (that is, collateral terms and agreements, ISDA protocols)
Number of Respondents Percent First in importance 0 0.0 Second in importance 0 0.0 Third in importance 0 0.0 Total 0 0.0
- Higher internal treasury charges for funding
Number of Respondents Percent First in importance 0 0.0 Second in importance 0 0.0 Third in importance 0 0.0 Total 0 0.0
- Diminished availability of balance sheet or capital at your institution
Number of Respondents Percent First in importance 0 0.0 Second in importance 0 0.0 Third in importance 0 0.0 Total 0 0.0
- Worsening in general market liquidity and functioning
Number of Respondents Percent First in importance 0 0.0 Second in importance 0 0.0 Third in importance 0 0.0 Total 0 0.0 - Less-aggressive competition from other institutions
Number of Respondents Percent First in importance 0 0.0 Second in importance 0 0.0 Third in importance 0 0.0 Total 0 0.0
- Deterioration in current or expected financial strength of counterparties
- Possible reasons for easing
- Improvement in current or expected financial strength of counterparties
Number of Respondents Percent First in importance 0 0.0 Second in importance 0 0.0 Third in importance 0 0.0 Total 0 0.0
- Increased willingness of your institution to take on risk
Number of Respondents Percent First in importance 0 0.0 Second in importance 0 0.0 Third in importance 0 0.0 Total 0 0.0
- Adoption of less-stringent market conventions (that is, collateral terms and agreements, ISDA protocols)
Number of Respondents Percent First in importance 0 0.0 Second in importance 0 0.0 Third in importance 0 0.0 Total 0 0.0
- Lower internal treasury charges for funding
Number of Respondents Percent First in importance 0 0.0 Second in importance 0 0.0 Third in importance 0 0.0 Total 0 0.0
- Increased availability of balance sheet or capital at your institution
Number of Respondents Percent First in importance 0 0.0 Second in importance 0 0.0 Third in importance 0 0.0 Total 0 0.0
- Improvement in general market liquidity and functioning
Number of Respondents Percent First in importance 1 100.0 Second in importance 0 0.0 Third in importance 0 0.0 Total 1 100.0
- More-aggressive competition from other institutions
Number of Respondents Percent First in importance 2 66.7 Second in importance 1 33.3 Third in importance 0 0.0 Total 3 100.0
- Improvement in current or expected financial strength of counterparties
14. How has the intensity of efforts by trading REITs to negotiate more-favorable price and nonprice terms changed over the past three months?
| Number of Respondents | Percent | |
|---|---|---|
| Increased considerably | 0 | 0.0 |
| Increased somewhat | 1 | 5.6 |
| Remained basically unchanged | 16 | 88.9 |
| Decreased somewhat | 1 | 5.6 |
| Decreased considerably | 0 | 0.0 |
| Total | 18 | 100.0 |
15. Considering the entire range of transactions facilitated by your institution for such clients, how has the use of financial leverage by trading REITs changed over the past three months?
| Number of Respondents | Percent | |
|---|---|---|
| Increased considerably | 0 | 0.0 |
| Increased somewhat | 2 | 11.1 |
| Remained basically unchanged | 13 | 72.2 |
| Decreased somewhat | 3 | 16.7 |
| Decreased considerably | 0 | 0.0 |
| Total | 18 | 100.0 |
16. How has the provision of differential terms by your institution to most-favored (as a function of breadth, duration, and extent of relationship) trading REITs changed over the past three months?
| Number of Respondents | Percent | |
|---|---|---|
| Increased considerably | 0 | 0.0 |
| Increased somewhat | 0 | 0.0 |
| Remained basically unchanged | 18 | 100.0 |
| Decreased somewhat | 0 | 0.0 |
| Decreased considerably | 0 | 0.0 |
| Total | 18 | 100.0 |
Mutual Funds, Exchange-Traded Funds, Pension Plans, and Endowments
17. Over the past three months, how have the price terms (for example, financing rates) offered to mutual funds, ETFs, pension plans, and endowments as reflected across the entire spectrum of securities financing and OTC derivatives transaction types changed, regardless of nonprice terms? (Please indicate tightening if terms have become more stringent--for example, if financing rates have risen.)
| Number of Respondents | Percent | |
|---|---|---|
| Tightened considerably | 0 | 0.0 |
| Tightened somewhat | 0 | 0.0 |
| Remained basically unchanged | 22 | 100.0 |
| Eased somewhat | 0 | 0.0 |
| Eased considerably | 0 | 0.0 |
| Total | 22 | 100.0 |
18. Over the past three months, how has your use of nonprice terms (for example, haircuts, maximum maturity, covenants, cure periods, cross-default provisions or other documentation features) with respect to mutual funds, ETFs, pension plans, and endowments across the entire spectrum of securities financing and OTC derivatives transaction types changed, regardless of price terms? (Please indicate tightening if terms have become more stringent--for example, if haircuts have been increased.)
| Number of Respondents | Percent | |
|---|---|---|
| Tightened considerably | 0 | 0.0 |
| Tightened somewhat | 0 | 0.0 |
| Remained basically unchanged | 22 | 100.0 |
| Eased somewhat | 0 | 0.0 |
| Eased considerably | 0 | 0.0 |
| Total | 22 | 100.0 |
19. To the extent that the price or nonprice terms applied to mutual funds, ETFs, pension plans, and endowments have tightened or eased over the past three months (as reflected in your responses to questions 16 and 17), what are the most important reasons for the change?
- Possible reasons for tightening
- Deterioration in current or expected financial strength of counterparties
Number of Respondents Percent First in importance 0 0.0 Second in importance 0 0.0 Third in importance 0 0.0 Total 0 0.0
- Reduced willingness of your institution to take on risk
Number of Respondents Percent First in importance 0 0.0 Second in importance 0 0.0 Third in importance 0 0.0 Total 0 0.0
- Adoption of more-stringent market conventions (that is, collateral terms and agreements, ISDA protocols)
Number of Respondents Percent First in importance 0 0.0 Second in importance 0 0.0 Third in importance 0 0.0 Total 0 0.0
- Higher internal treasury charges for funding
Number of Respondents Percent First in importance 0 0.0 Second in importance 0 0.0 Third in importance 0 0.0 Total 0 0.0
- Diminished availability of balance sheet or capital at your institution
Number of Respondents Percent First in importance 0 0.0 Second in importance 0 0.0 Third in importance 0 0.0 Total 0 0.0
- Worsening in general market liquidity and functioning
Number of Respondents Percent First in importance 0 0.0 Second in importance 0 0.0 Third in importance 0 0.0 Total 0 0.0
- Less-aggressive competition from other institutions
Number of Respondents Percent First in importance 0 0.0 Second in importance 0 0.0 Third in importance 0 0.0 Total 0 0.0
- Deterioration in current or expected financial strength of counterparties
- Possible reasons for easing
- Improvement in current or expected financial strength of counterparties
Number of Respondents Percent First in importance 0 0.0 Second in importance 0 0.0 Third in importance 0 0.0 Total 0 0.0
- Increased willingness of your institution to take on risk
Number of Respondents Percent First in importance 0 0.0 Second in importance 0 0.0 Third in importance 0 0.0 Total 0 0.0
- Adoption of less-stringent market conventions (that is, collateral terms and agreements, ISDA protocols)
Number of Respondents Percent First in importance 0 0.0 Second in importance 0 0.0 Third in importance 0 0.0 Total 0 0.0
- Lower internal treasury charges for funding
Number of Respondents Percent First in importance 0 0.0 Second in importance 0 0.0 Third in importance 0 0.0 Total 0 0.0
- Increased availability of balance sheet or capital at your institution
Number of Respondents Percent First in importance 0 0.0 Second in importance 0 0.0 Third in importance 0 0.0 Total 0 0.0
- Improvement in general market liquidity and functioning
Number of Respondents Percent First in importance 0 0.0 Second in importance 0 0.0 Third in importance 0 0.0 Total 0 0.0
- More-aggressive competition from other institutions
Number of Respondents Percent First in importance 0 0.0 Second in importance 0 0.0 Third in importance 0 0.0 Total 0 0.0
- Improvement in current or expected financial strength of counterparties
20. How has the intensity of efforts by mutual funds, ETFs, pension plans, and endowments to negotiate more-favorable price and nonprice terms changed over the past three months?
| Number of Respondents | Percent | |
|---|---|---|
| Increased considerably | 0 | 0.0 |
| Increased somewhat | 1 | 4.5 |
| Remained basically unchanged | 21 | 95.5 |
| Decreased somewhat | 0 | 0.0 |
| Decreased considerably | 0 | 0.0 |
| Total | 22 | 100.0 |
21. Considering the entire range of transactions facilitated by your institution, how has the use of financial leverage by each of the following types of clients changed over the past three months?
- Mutual funds
Number of Respondents Percent Increased considerably 0 0.0 Increased somewhat 1 5.0 Remained basically unchanged 19 95.0 Decreased somewhat 0 0.0 Decreased considerably 0 0.0 Total 20 100.0
- ETFs
Number of Respondents Percent Increased considerably 0 0.0 Increased somewhat 0 0.0 Remained basically unchanged 19 100.0 Decreased somewhat 0 0.0 Decreased considerably 0 0.0 Total 19 100.0
- Pension plans
Number of Respondents Percent Increased considerably 0 0.0 Increased somewhat 0 0.0 Remained basically unchanged 20 100.0 Decreased somewhat 0 0.0 Decreased considerably 0 0.0 Total 20 100.0
- Endowments
Number of Respondents Percent Increased considerably 0 0.0 Increased somewhat 0 0.0 Remained basically unchanged 20 100.0 Decreased somewhat 0 0.0 Decreased considerably 0 0.0 Total 20 100.0
22. How has the provision of differential terms by your institution to most-favored (as a function of breadth, duration, and extent of relationship) mutual funds, ETFs, pension plans, and endowments changed over the past three months?
| Number of Respondents | Percent | |
|---|---|---|
| Increased considerably | 0 | 0.0 |
| Increased somewhat | 0 | 0.0 |
| Remained basically unchanged | 22 | 100.0 |
| Decreased somewhat | 0 | 0.0 |
| Decreased considerably | 0 | 0.0 |
| Total | 22 | 100.0 |
Insurance Companies
23. Over the past three months, how have the price terms (for example, financing rates) offered to insurance companies as reflected across the entire spectrum of securities financing and OTC derivatives transaction types changed, regardless of nonprice terms? (Please indicate tightening if terms have become more stringent--for example, if financing rates have risen.)
| Number of Respondents | Percent | |
|---|---|---|
| Tightened considerably | 0 | 0.0 |
| Tightened somewhat | 0 | 0.0 |
| Remained basically unchanged | 21 | 100.0 |
| Eased somewhat | 0 | 0.0 |
| Eased considerably | 0 | 0.0 |
| Total | 21 | 100.0 |
24. Over the past three months, how has your use of nonprice terms (for example, haircuts, maximum maturity, covenants, cure periods, cross-default provisions or other documentation features) with respect to insurance companies across the entire spectrum of securities financing and OTC derivatives transaction types changed, regardless of price terms? (Please indicate tightening if terms have become more stringent--for example, if haircuts have been increased.)
| Number of Respondents | Percent | |
|---|---|---|
| Tightened considerably | 0 | 0.0 |
| Tightened somewhat | 0 | 0.0 |
| Remained basically unchanged | 19 | 86.4 |
| Eased somewhat | 3 | 13.6 |
| Eased considerably | 0 | 0.0 |
| Total | 22 | 100.0 |
25. To the extent that the price or nonprice terms applied to insurance companies have tightened or eased over the past three months (as reflected in your responses to questions 23 and 24), what are the most important reasons for the change?
- Possible reasons for tightening
- Deterioration in current or expected financial strength of counterparties
Number of Respondents Percent First in importance 0 0.0 Second in importance 0 0.0 Third in importance 0 0.0 Total 0 0.0
- Reduced willingness of your institution to take on risk
Number of Respondents Percent First in importance 0 0.0 Second in importance 0 0.0 Third in importance 0 0.0 Total 0 0.0
- Adoption of more-stringent market conventions (that is, collateral terms and agreements, ISDA protocols)
Number of Respondents Percent First in importance 0 0.0 Second in importance 0 0.0 Third in importance 0 0.0 Total 0 0.0
- Higher internal treasury charges for funding
Number of Respondents Percent First in importance 0 0.0 Second in importance 0 0.0 Third in importance 0 0.0 Total 0 0.0
- Diminished availability of balance sheet or capital at your institution
Number of Respondents Percent First in importance 0 0.0 Second in importance 0 0.0 Third in importance 0 0.0 Total 0 0.0
- Worsening in general market liquidity and functioning
Number of Respondents Percent First in importance 0 0.0 Second in importance 0 0.0 Third in importance 0 0.0 Total 0 0.0
- Less-aggressive competition from other institutions
Number of Respondents Percent First in importance 0 0.0 Second in importance 0 0.0 Third in importance 0 0.0 Total 0 0.0
- Deterioration in current or expected financial strength of counterparties
- Possible reasons for easing
- Improvement in current or expected financial strength of counterparties
Number of Respondents Percent First in importance 1 100.0 Second in importance 0 0.0 Third in importance 0 0.0 Total 1 100.0
- Increased willingness of your institution to take on risk
Number of Respondents Percent First in importance 0 0.0 Second in importance 0 0.0 Third in importance 0 0.0 Total 0 0.0
- Adoption of less-stringent market conventions (that is, collateral terms and agreements, ISDA protocols)
Number of Respondents Percent First in importance 0 0.0 Second in importance 1 100.0 Third in importance 0 0.0 Total 1 100.0
- Lower internal treasury charges for funding
Number of Respondents Percent First in importance 1 100.0 Second in importance 0 0.0 Third in importance 0 0.0 Total 1 100.0
- Increased availability of balance sheet or capital at your institution
Number of Respondents Percent First in importance 0 0.0 Second in importance 1 100.0 Third in importance 0 0.0 Total 1 100.0
- Improvement in general market liquidity and functioning
Number of Respondents Percent First in importance 0 0.0 Second in importance 0 0.0 Third in importance 0 0.0 Total 0 0.0
- More-aggressive competition from other institutions
Number of Respondents Percent First in importance 0 0.0 Second in importance 1 50.0 Third in importance 1 50.0 Total 2 100.0
- Improvement in current or expected financial strength of counterparties
26. How has the intensity of efforts by insurance companies to negotiate more-favorable price and nonprice terms changed over the past three months?
| Number of Respondents | Percent | |
|---|---|---|
| Increased considerably | 0 | 0.0 |
| Increased somewhat | 1 | 4.5 |
| Remained basically unchanged | 21 | 95.5 |
| Decreased somewhat | 0 | 0.0 |
| Decreased considerably | 0 | 0.0 |
| Total | 22 | 100.0 |
27. Considering the entire range of transactions facilitated by your institution for such clients, how has the use of financial leverage by insurance companies changed over the past three months?
| Number of Respondents | Percent | |
|---|---|---|
| Increased considerably | 0 | 0.0 |
| Increased somewhat | 0 | 0.0 |
| Remained basically unchanged | 21 | 95.5 |
| Decreased somewhat | 1 | 4.5 |
| Decreased considerably | 0 | 0.0 |
| Total | 22 | 100.0 |
28. How has the provision of differential terms by your institution to most-favored (as a function of breadth, duration, and extent of relationship) insurance companies changed over the past three months?
| Number of Respondents | Percent | |
|---|---|---|
| Increased considerably | 0 | 0.0 |
| Increased somewhat | 0 | 0.0 |
| Remained basically unchanged | 21 | 95.5 |
| Decreased somewhat | 1 | 4.5 |
| Decreased considerably | 0 | 0.0 |
| Total | 22 | 100.0 |
Separately Managed Accounts Established with Investment Advisers
29. Over the past three months, how have the price terms (for example, financing rates) offered to separately managed accounts established with investment advisers as reflected across the entire spectrum of securities financing and OTC derivatives transaction types changed, regardless of nonprice terms? (Please indicate tightening if terms have become more stringent--for example, if financing rates have risen.)
| Number of Respondents | Percent | |
|---|---|---|
| Tightened considerably | 0 | 0.0 |
| Tightened somewhat | 0 | 0.0 |
| Remained basically unchanged | 20 | 95.2 |
| Eased somewhat | 1 | 4.8 |
| Eased considerably | 0 | 0.0 |
| Total | 21 | 100.0 |
30. Over the past three months, how has your use of nonprice terms (for example, haircuts, maximum maturity, covenants, cure periods, cross-default provisions or other documentation features) with respect to separately managed accounts established with investment advisers across the entire spectrum of securities financing and OTC derivatives transaction types changed, regardless of price terms? (Please indicate tightening if terms have become more stringent--for example, if haircuts have been increased.)
| Number of Respondents | Percent | |
|---|---|---|
| Tightened considerably | 0 | 0.0 |
| Tightened somewhat | 0 | 0.0 |
| Remained basically unchanged | 21 | 100.0 |
| Eased somewhat | 0 | 0.0 |
| Eased considerably | 0 | 0.0 |
| Total | 21 | 100.0 |
31. To the extent that the price or nonprice terms applied to separately managed accounts established with investment advisers have tightened or eased over the past three months (as reflected in your responses to questions 28 and 29), what are the most important reasons for the change?
- Possible reasons for tightening
- Deterioration in current or expected financial strength of counterparties
Number of Respondents Percent First in importance 0 0.0 Second in importance 0 0.0 Third in importance 0 0.0 Total 0 0.0
- Reduced willingness of your institution to take on risk
Number of Respondents Percent First in importance 0 0.0 Second in importance 0 0.0 Third in importance 0 0.0 Total 0 0.0
- Adoption of more-stringent market conventions (that is, collateral terms and agreements, ISDA protocols)
Number of Respondents Percent First in importance 0 0.0 Second in importance 0 0.0 Third in importance 0 0.0 Total 0 0.0
- Higher internal treasury charges for funding
Number of Respondents Percent First in importance 0 0.0 Second in importance 0 0.0 Third in importance 0 0.0 Total 0 0.0
- Diminished availability of balance sheet or capital at your institution
Number of Respondents Percent First in importance 0 0.0 Second in importance 0 0.0 Third in importance 0 0.0 Total 0 0.0
- Worsening in general market liquidity and functioning
Number of Respondents Percent First in importance 0 0.0 Second in importance 0 0.0 Third in importance 0 0.0 Total 0 0.0
- Less-aggressive competition from other institutions
Number of Respondents Percent First in importance 0 0.0 Second in importance 0 0.0 Third in importance 0 0.0 Total 0 0.0
- Deterioration in current or expected financial strength of counterparties
- Possible reasons for easing
- Improvement in current or expected financial strength of counterparties
Number of Respondents Percent First in importance 0 0.0 Second in importance 0 0.0 Third in importance 0 0.0 Total 0 0.0
- Increased willingness of your institution to take on risk
Number of Respondents Percent First in importance 0 0.0 Second in importance 0 0.0 Third in importance 0 0.0 Total 0 0.0
- Adoption of less-stringent market conventions (that is, collateral terms and agreements, ISDA protocols)
Number of Respondents Percent First in importance 0 0.0 Second in importance 0 0.0 Third in importance 0 0.0 Total 0 0.0
- Lower internal treasury charges for funding
Number of Respondents Percent First in importance 0 0.0 Second in importance 0 0.0 Third in importance 0 0.0 Total 0 0.0
- Increased availability of balance sheet or capital at your institution
Number of Respondents Percent First in importance 0 0.0 Second in importance 0 0.0 Third in importance 0 0.0 Total 0 0.0
- Improvement in general market liquidity and functioning
Number of Respondents Percent First in importance 0 0.0 Second in importance 0 0.0 Third in importance 0 0.0 Total 0 0.0
- More-aggressive competition from other institutions
Number of Respondents Percent First in importance 1 100.0 Second in importance 0 0.0 Third in importance 0 0.0 Total 1 100.0
- Improvement in current or expected financial strength of counterparties
32. How has the intensity of efforts by investment advisers to negotiate more-favorable price and nonprice terms on behalf of separately managed accounts changed over the past three months?
| Number of Respondents | Percent | |
|---|---|---|
| Increased considerably | 0 | 0.0 |
| Increased somewhat | 0 | 0.0 |
| Remained basically unchanged | 21 | 100.0 |
| Decreased somewhat | 0 | 0.0 |
| Decreased considerably | 0 | 0.0 |
| Total | 21 | 100.0 |
33. Considering the entire range of transactions facilitated by your institution for such clients, how has the use of financial leverage by separately managed accounts established with investment advisers changed over the past three months?
| Number of Respondents | Percent | |
|---|---|---|
| Increased considerably | 0 | 0.0 |
| Increased somewhat | 0 | 0.0 |
| Remained basically unchanged | 21 | 100.0 |
| Decreased somewhat | 0 | 0.0 |
| Decreased considerably | 0 | 0.0 |
| Total | 21 | 100.0 |
34. How has the provision of differential terms by your institution to separately managed accounts established with most-favored (as a function of breadth, duration, and extent of relationship) investment advisers changed over the past three months?
| Number of Respondents | Percent | |
|---|---|---|
| Increased considerably | 0 | 0.0 |
| Increased somewhat | 0 | 0.0 |
| Remained basically unchanged | 20 | 95.2 |
| Decreased somewhat | 1 | 4.8 |
| Decreased considerably | 0 | 0.0 |
| Total | 21 | 100.0 |
Nonfinancial Corporations
35. Over the past three months, how have the price terms (for example, financing rates) offered to nonfinancial corporations as reflected across the entire spectrum of securities financing and OTC derivatives transaction types changed, regardless of nonprice terms? (Please indicate tightening if terms have become more stringent--for example, if financing rates have risen.)
| Number of Respondents | Percent | |
|---|---|---|
| Tightened considerably | 0 | 0.0 |
| Tightened somewhat | 1 | 4.5 |
| Remained basically unchanged | 18 | 81.8 |
| Eased somewhat | 3 | 13.6 |
| Eased considerably | 0 | 0.0 |
| Total | 22 | 100.0 |
36. Over the past three months, how has your use of nonprice terms (for example, haircuts, maximum maturity, covenants, cure periods, cross-default provisions or other documentation features) with respect to nonfinancial corporations across the entire spectrum of securities financing and OTC derivatives transaction types changed, regardless of price terms? (Please indicate tightening if terms have become more stringent--for example, if haircuts have been increased.)
| Number of Respondents | Percent | |
|---|---|---|
| Tightened considerably | 0 | 0.0 |
| Tightened somewhat | 0 | 0.0 |
| Remained basically unchanged | 19 | 86.4 |
| Eased somewhat | 2 | 9.1 |
| Eased considerably | 1 | 4.5 |
| Total | 22 | 100.0 |
37. To the extent that the price or nonprice terms applied to nonfinancial corporations have tightened or eased over the past three months (as reflected in your responses to questions 35 and 36), what are the most important reasons for the change?
- Possible reasons for tightening
- Deterioration in current or expected financial strength of counterparties
Number of Respondents Percent First in importance 0 0.0 Second in importance 0 0.0 Third in importance 0 0.0 Total 0 0.0
- Reduced willingness of your institution to take on risk
Number of Respondents Percent First in importance 0 0.0 Second in importance 0 0.0 Third in importance 0 0.0 Total 0 0.0
- Adoption of more-stringent market conventions (that is, collateral terms and agreements, ISDA protocols)
Number of Respondents Percent First in importance 0 0.0 Second in importance 0 0.0 Third in importance 0 0.0 Total 0 0.0
- Higher internal treasury charges for funding
Number of Respondents Percent First in importance 0 0.0 Second in importance 0 0.0 Third in importance 0 0.0 Total 0 0.0 - Diminished availability of balance sheet or capital at your institution
Number of Respondents Percent First in importance 0 0.0 Second in importance 0 0.0 Third in importance 0 0.0 Total 0 0.0
- Worsening in general market liquidity and functioning
Number of Respondents Percent First in importance 0 0.0 Second in importance 0 0.0 Third in importance 0 0.0 Total 0 0.0
- Less-aggressive competition from other institutions
Number of Respondents Percent First in importance 0 0.0 Second in importance 0 0.0 Third in importance 0 0.0 Total 0 0.0
- Deterioration in current or expected financial strength of counterparties
- Possible reasons for easing
- Improvement in current or expected financial strength of counterparties
Number of Respondents Percent First in importance 0 0.0 Second in importance 2 66.7 Third in importance 1 33.3 Total 3 100.0
- Increased willingness of your institution to take on risk
Number of Respondents Percent First in importance 0 0.0 Second in importance 0 0.0 Third in importance 1 100.0 Total 1 100.0
- Adoption of less-stringent market conventions (that is, collateral terms and agreements, ISDA protocols)
Number of Respondents Percent First in importance 0 0.0 Second in importance 1 100.0 Third in importance 0 0.0 Total 1 100.0
- Lower internal treasury charges for funding
Number of Respondents Percent First in importance 0 0.0 Second in importance 0 0.0 Third in importance 1 100.0 Total 1 100.0
- Increased availability of balance sheet or capital at your institution
Number of Respondents Percent First in importance 0 0.0 Second in importance 0 0.0 Third in importance 0 0.0 Total 0 0.0
- Improvement in general market liquidity and functioning
Number of Respondents Percent First in importance 1 100.0 Second in importance 0 0.0 Third in importance 0 0.0 Total 1 100.0
- More-aggressive competition from other institutions
Number of Respondents Percent First in importance 3 100.0 Second in importance 0 0.0 Third in importance 0 0.0 Total 3 100.0
- Improvement in current or expected financial strength of counterparties
38. How has the intensity of efforts by nonfinancial corporations to negotiate more-favorable price and nonprice terms changed over the past three months?
| Number of Respondents | Percent | |
|---|---|---|
| Increased considerably | 0 | 0.0 |
| Increased somewhat | 6 | 27.3 |
| Remained basically unchanged | 16 | 72.7 |
| Decreased somewhat | 0 | 0.0 |
| Decreased considerably | 0 | 0.0 |
| Total | 22 | 100.0 |
Mark and Collateral Disputes
39. Over the past three months, how has the volume of mark and collateral disputes with clients of each of the following types changed?
- Dealers and other financial intermediaries
Number of Respondents Percent Increased considerably 0 0.0 Increased somewhat 1 4.8 Remained basically unchanged 18 85.7 Decreased somewhat 1 4.8 Decreased considerably 1 4.8 Total 21 100.0
- Hedge funds
Number of Respondents Percent Increased considerably 0 0.0 Increased somewhat 2 9.5 Remained basically unchanged 18 85.7 Decreased somewhat 1 4.8 Decreased considerably 0 0.0 Total 21 100.0
- Trading REITs
Number of Respondents Percent Increased considerably 0 0.0 Increased somewhat 0 0.0 Remained basically unchanged 16 100.0 Decreased somewhat 0 0.0 Decreased considerably 0 0.0 Total 16 100.0
- Mutual funds, ETFs, pension plans, and endowments
Number of Respondents Percent Increased considerably 0 0.0 Increased somewhat 1 5.3 Remained basically unchanged 18 94.7 Decreased somewhat 0 0.0 Decreased considerably 0 0.0 Total 19 100.0
- Insurance companies
Number of Respondents Percent Increased considerably 0 0.0 Increased somewhat 0 0.0 Remained basically unchanged 20 95.2 Decreased somewhat 1 4.8 Decreased considerably 0 0.0 Total 21 100.0
- Separately managed accounts established with investment advisers
Number of Respondents Percent Increased considerably 0 0.0 Increased somewhat 0 0.0 Remained basically unchanged 19 100.0 Decreased somewhat 0 0.0 Decreased considerably 0 0.0 Total 19 100.0
- Nonfinancial corporations
Number of Respondents Percent Increased considerably 0 0.0 Increased somewhat 1 5.3 Remained basically unchanged 18 94.7 Decreased somewhat 0 0.0 Decreased considerably 0 0.0 Total 19 100.0
40. Over the past three months, how has the duration and persistence of mark and collateral disputes with clients of each of the following types changed?
- Dealers and other financial intermediaries
Number of Respondents Percent Increased considerably 0 0.0 Increased somewhat 1 4.8 Remained basically unchanged 18 85.7 Decreased somewhat 2 9.5 Decreased considerably 0 0.0 Total 21 100.0
- Hedge funds
Number of Respondents Percent Increased considerably 0 0.0 Increased somewhat 1 4.8 Remained basically unchanged 19 90.5 Decreased somewhat 1 4.8 Decreased considerably 0 0.0 Total 21 100.0
- Trading REITs
Number of Respondents Percent Increased considerably 0 0.0 Increased somewhat 0 0.0 Remained basically unchanged 16 100.0 Decreased somewhat 0 0.0 Decreased considerably 0 0.0 Total 16 100.0
- Mutual funds, ETFs, pension plans, and endowments
Number of Respondents Percent Increased considerably 0 0.0 Increased somewhat 0 0.0 Remained basically unchanged 18 94.7 Decreased somewhat 1 5.3 Decreased considerably 0 0.0 Total 19 100.0
- Insurance companies
Number of Respondents Percent Increased considerably 0 0.0 Increased somewhat 0 0.0 Remained basically unchanged 20 95.2 Decreased somewhat 0 0.0 Decreased considerably 1 4.8 Total 21 100.0
- Separately managed accounts established with investment advisers
Number of Respondents Percent Increased considerably 0 0.0 Increased somewhat 1 5.3 Remained basically unchanged 17 89.5 Decreased somewhat 0 0.0 Decreased considerably 1 5.3 Total 19 100.0
- Nonfinancial corporations
Number of Respondents Percent Increased considerably 0 0.0 Increased somewhat 0 0.0 Remained basically unchanged 18 100.0 Decreased somewhat 0 0.0 Decreased considerably 0 0.0 Total 18 100.0
Over-the-Counter Derivatives
In this Section:
Questions 41 through 51 ask about OTC derivatives trades. Question 41 focuses on nonprice terms applicable to new and renegotiated master agreements. Questions 42 through 48 ask about the initial margin requirements for most-favored and average clients applicable to different types of contracts: Question 42 focuses on foreign exchange (FX); question 43 on interest rates; question 44 on equity; question 45 on contracts referencing corporate credits (single-name and indexes); question 46 on credit derivatives referencing structured products such as mortgage-backed securities (MBS) and asset-backed securities (ABS) (specific tranches and indexes); question 47 on commodities; and question 48 on total return swaps (TRS) referencing nonsecurities (such as bank loans, including, for example, commercial and industrial loans and mortgage whole loans). Question 49 asks about posting of nonstandard collateral pursuant to OTC derivatives contracts. Questions 50 and 51 focus on mark and collateral disputes involving contracts of each of the aforementioned types.
If your institution's terms have tightened or eased over the past three months, please so report them regardless of how they stand relative to longer-term norms. Please focus your response on dollar-denominated instruments; if material differences exist with respect to instruments denominated in other currencies, please explain in the appropriate comment space
New and Renegotiated Master Agreements
41. Over the past three months, how have nonprice terms incorporated in new or renegotiated OTC derivatives master agreements put in place with your institution’s client changed?
- Requirements, timelines, and thresholds for posting additional margin
Number of Respondents Percent Tightened considerably 0 0.0 Tightened somewhat 1 5.0 Remained basically unchanged 19 95.0 Eased somewhat 0 0.0 Eased considerably 0 0.0 Total 20 100.0
- Acceptable collateral
Number of Respondents Percent Tightened considerably 0 0.0 Tightened somewhat 1 5.0 Remained basically unchanged 17 85.0 Eased somewhat 2 10.0 Eased considerably 0 0.0 Total 20 100.0
- Recognition of portfolio or diversification benefits (including from securities financing trades where appropriate agreements are in place)
Number of Respondents Percent Tightened considerably 0 0.0 Tightened somewhat 0 0.0 Remained basically unchanged 19 100.00 Eased somewhat 0 0.0 Eased considerably 0 0.0 Total 19 100.0
- Triggers and covenants
Number of Respondents Percent Tightened considerably 0 0.0 Tightened somewhat 0 0.0 Remained basically unchanged 20 100.0 Eased somewhat 0 0.0 Eased considerably 0 0.0 Total 20 100.0
- Other documentation features (including cure periods and cross-default provisions)
Number of Respondents Percent Tightened considerably 0 0.0 Tightened somewhat 0 0.0 Remained basically unchanged 19 100.0 Eased somewhat 0 0.0 Eased considerably 0 0.0 Total 19 100.0
Initial Margin
42. Over the past three months, how have initial margin requirements set by your institution with respect to OTC FX derivatives changed?
- Initial margin requirements for average clients
Number of Respondents Percent Increased considerably 0 0.0 Increased somewhat 0 0.0 Remained basically unchanged 19 95.0 Decreased somewhat 0 0.0 Decreased considerably 1 5.0 Total 20 100.0
- Initial margin requirements for most-favored clients, as a consequence of breadth, duration, and/or extent of relationship
Number of Respondents Percent Increased considerably 0 0.0 Increased somewhat 0 0.0 Remained basically unchanged 20 100.0 Decreased somewhat 0 0.0 Decreased considerably 0 0.0 Total 20 100.0
43. Over the past three months, how have initial margin requirements set by your institution with respect to OTC interest rate derivatives changed?
- Initial margin requirements for average clients
Number of Respondents Percent Increased considerably 0 0.0 Increased somewhat 0 0.0 Remained basically unchanged 20 95.2 Decreased somewhat 1 4.8 Decreased considerably 0 0.0 Total 21 100.0
- Initial margin requirements for most-favored clients, as a consequence of breadth, duration, and/or extent of relationship
Number of Respondents Percent Increased considerably 0 0.0 Increased somewhat 0 0.0 Remained basically unchanged 20 95.2 Decreased somewhat 1 4.8 Decreased considerably 0 0.0 Total 21 100.0
44. Over the past three months, how have initial margin requirements set by your institution with respect to OTC equity derivatives changed?
- Initial margin requirements for average clients
Number of Respondents Percent Increased considerably 0 0.0 Increased somewhat 0 0.0 Remained basically unchanged 18 100.0 Decreased somewhat 0 0.0 Decreased considerably 0 0.0 Total 18 100.0 - Initial margin requirements for most-favored clients, as a consequence of breadth, duration, and/or extent of relationship
Number of Respondents Percent Increased considerably 0 0.0 Increased somewhat 0 0.0 Remained basically unchanged 17 94.4 Decreased somewhat 1 5.6 Decreased considerably 0 0.0 Total 18 100.0
45. Over the past three months, how have initial margin requirements set by your institution with respect to OTC credit derivatives referencing corporates (single-name corporates or corporate indexes) changed?
- Initial margin requirements for average clients
Number of Respondents Percent Increased considerably 0 0.0 Increased somewhat 0 0.0 Remained basically unchanged 18 100.0 Decreased somewhat 0 0.0 Decreased considerably 0 0.0 Total 18 100.0
- Initial margin requirements for most-favored clients, as a consequence of breadth, duration, and/or extent of relationship
Number of Respondents Percent Increased considerably 0 0.0 Increased somewhat 0 0.0 Remained basically unchanged 18 100.0 Decreased somewhat 0 0.0 Decreased considerably 0 0.0 Total 18 100.0
46. Over the past three months, how have initial margin requirements set by your institution with respect to OTC credit derivatives referencing securitized products (such as specific ABS or MBS tranches and associated indexes) changed?
- Initial margin requirements for average clients
Number of Respondents Percent Increased considerably 0 0.0 Increased somewhat 0 0.0 Remained basically unchanged 12 100.0 Decreased somewhat 0 0.0 Decreased considerably 0 0.0 Total 12 100.0
- Initial margin requirements for most-favored clients, as a consequence of breadth, duration, and/or extent of relationship
Number of Respondents Percent Increased considerably 0 0.0 Increased somewhat 0 0.0 Remained basically unchanged 12 100.0 Decreased somewhat 0 0.0 Decreased considerably 0 0.0 Total 12 100.0
47. Over the past three months, how have initial margin requirements set by your institution with respect to OTC commodity derivatives changed?
- Initial margin requirements for average clients
Number of Respondents Percent Increased considerably 0 0.0 Increased somewhat 0 0.0 Remained basically unchanged 17 100.0 Decreased somewhat 0 0.0 Decreased considerably 0 0.0 Total 17 100.0
- Initial margin requirements for most-favored clients, as a consequence of breadth, duration, and/or extent of relationship
Number of Respondents Percent Increased considerably 0 0.0 Increased somewhat 0 0.0 Remained basically unchanged 16 94.1 Decreased somewhat 1 5.9 Decreased considerably 0 0.0 Total 17 100.0
48. Over the past three months, how have initial margin requirements set by your institution with respect to TRS referencing nonsecurities (such as bank loans, including, for example, commercial and industrial loans and mortgage whole loans) changed?
- Initial margin requirements for average clients
Number of Respondents Percent Increased considerably 0 0.0 Increased somewhat 0 0.0 Remained basically unchanged 12 100.0 Decreased somewhat 0 0.0 Decreased considerably 0 0.0 Total 12 100.0
- Initial margin requirements for most-favored clients, as a consequence of breadth, duration, and/or extent of relationship
Number of Respondents Percent Increased considerably 0 0.0 Increased somewhat 0 0.0 Remained basically unchanged 12 100.0 Decreased somewhat 0 0.0 Decreased considerably 0 0.0 Total 12 100.0
Nonstandard Collateral
49. Over the past three months, how has the posting of nonstandard collateral (that is, other than cash and U.S. Treasury securities) as permitted under relevant agreements changed?
| Number of Respondents | Percent | |
|---|---|---|
| Increased considerably | 1 | 4.5 |
| Increased somewhat | 1 | 4.5 |
| Remained basically unchanged | 20 | 90.9 |
| Decreased somewhat | 0 | 0.0 |
| Decreased considerably | 0 | 0.0 |
| Total | 22 | 100.0 |
Mark and Collateral Disputes
50. Over the past three months, how has the volume of mark and collateral disputes relating to contracts of each of the following types changed?
- FX
Number of Respondents Percent Increased considerably 0 0.0 Increased somewhat 2 11.1 Remained basically unchanged 14 77.8 Decreased somewhat 1 5.6 Decreased considerably 1 5.6 Total 18 100.0
- Interest rate
Number of Respondents Percent Increased considerably 0 0.0 Increased somewhat 1 5.3 Remained basically unchanged 18 94.7 Decreased somewhat 0 0.0 Decreased considerably 0 0.0 Total 19 100.0
- Equity
Number of Respondents Percent Increased considerably 0 0.0 Increased somewhat 1 5.9 Remained basically unchanged 14 82.4 Decreased somewhat 2 11.8 Decreased considerably 0 0.0 Total 17 100.0
- Credit referencing corporates
Number of Respondents Percent Increased considerably 0 0.0 Increased somewhat 2 12.5 Remained basically unchanged 14 87.5 Decreased somewhat 0 0.0 Decreased considerably 0 0.0 Total 16 100.0
- Credit referencing securitized products including MBS and ABS
Number of Respondents Percent Increased considerably 0 0.0 Increased somewhat 2 16.7 Remained basically unchanged 10 83.3 Decreased somewhat 0 0.0 Decreased considerably 0 0.0 Total 12 100.0
- Commodity
Number of Respondents Percent Increased considerably 0 0.0 Increased somewhat 1 6.3 Remained basically unchanged 14 87.5 Decreased somewhat 1 6.3 Decreased considerably 0 0.0 Total 16 100.0
- TRS referencing nonsecurities (such as bank loans, including, for example, commercial and industrial loans and mortgage whole loans)
Number of Respondents Percent Increased considerably 0 0.0 Increased somewhat 0 0.0 Remained basically unchanged 9 100.0 Decreased somewhat 0 0.0 Decreased considerably 0 0.0 Total 9 100.0
51. Over the past three months, how has the duration and persistence of mark and collateral disputes relating to contracts of each of the following types changed?
- FX
Number of Respondents Percent Increased considerably 0 0.0 Increased somewhat 0 0.0 Remained basically unchanged 17 89.5 Decreased somewhat 2 10.5 Decreased considerably 0 0.0 Total 19 100.0
- Interest rate
Number of Respondents Percent Increased considerably 0 0.0 Increased somewhat 1 5.0 Remained basically unchanged 17 85.0 Decreased somewhat 2 10.0 Decreased considerably 0 0.0 Total 20 100.0
- Equity
Number of Respondents Percent Increased considerably 0 0.0 Increased somewhat 1 5.9 Remained basically unchanged 15 88.2 Decreased somewhat 1 5.9 Decreased considerably 0 0.0 Total 17 100.0
- Credit referencing corporates
Number of Respondents Percent Increased considerably 0 0.0 Increased somewhat 0 0.0 Remained basically unchanged 16 100.0 Decreased somewhat 0 0.0 Decreased considerably 0 0.0 Total 16 100.0
- Credit referencing securitized products including MBS and ABS
Number of Respondents Percent Increased considerably 0 0.0 Increased somewhat 0 0.0 Remained basically unchanged 11 91.7 Decreased somewhat 1 8.3 Decreased considerably 0 0.0 Total 12 100.0
- Commodity
Number of Respondents Percent Increased considerably 0 0.0 Increased somewhat 1 6.3 Remained basically unchanged 15 93.8 Decreased somewhat 0 0.0 Decreased considerably 0 0.0 Total 16 100.0
- TRS referencing nonsecurities (such as bank loans, including, for example, commercial and industrial loans and mortgage whole loans)
Number of Respondents Percent Increased considerably 0 0.0 Increased somewhat 0 0.0 Remained basically unchanged 10 100.0 Decreased somewhat 0 0.0 Decreased considerably 0 0.0 Total 10 100.0
Securities Financing
In this Section:
Questions 52 through 79 ask about securities funding at your institution--that is, lending to clients collateralized by securities. Such activities may be conducted on a "repo" desk, on a trading desk engaged in facilitation for institutional clients and/or proprietary transactions, on a funding desk, or on a prime brokerage platform. Questions 52 through 55 focus on lending against high-grade corporate bonds; questions 56 through 59 on lending against high-yield corporate bonds; questions 60 and 61 on lending against equities (including through stock loan); questions 62 through 65 on lending against agency residential mortgage-backed securities (agency RMBS); questions 66 through 69 on lending against non-agency residential mortgage-backed securities (non-agency RMBS); questions 70 through 73 on lending against commercial mortgage-backed securities (CMBS); and questions 74 through 77 on consumer ABS (for example, backed by credit card receivables or auto loans). Questions 78 and 79 ask about mark and collateral disputes for lending backed by each of the aforementioned contract types.
If your institutions terms have tightened or eased over the past three months, please so report them regardless of how they stand relative to longer-term norms. Please focus your response on dollar-denominated instruments; if material differences exist with respect to instruments denominated in other currencies, please explain in the appropriate comment space.
High-Grade Corporate Bonds
52. Over the past three months, how have the terms under which high-grade corporate bonds are funded changed?
- Terms for average clients
- Maximum amount of funding
Number of Respondents Percent Tightened considerably 0 0.0 Tightened somewhat 0 0.0 Remained basically unchanged 17 100.0 Eased somewhat 0 0.0 Eased considerably 0 0.0 Total 17 100.0
- Maximum maturity
Number of Respondents Percent Tightened considerably 0 0.0 Tightened somewhat 0 0.0 Remained basically unchanged 17 94.4 Eased somewhat 1 5.6 Eased considerably 0 0.0 Total 18 100.0
- Haircuts
Number of Respondents Percent Tightened considerably 0 0.0 Tightened somewhat 0 0.0 Remained basically unchanged 18 100.0 Eased somewhat 0 0.0 Eased considerably 0 0.0 Total 18 100.0
- Collateral spreads over relevant benchmark (effective financing rates)
Number of Respondents Percent Tightened considerably 0 0.0 Tightened somewhat 1 5.9 Remained basically unchanged 15 88.2 Eased somewhat 1 5.9 Eased considerably 0 0.0 Total 17 100.0
- Maximum amount of funding
- Terms for most-favored clients, as a consequence of breadth, duration, and/or extent of relationship
- Maximum amount of funding
Number of Respondents Percent Tightened considerably 0 0.0 Tightened somewhat 0 0.0 Remained basically unchanged 17 94.4 Eased somewhat 1 5.6 Eased considerably 0 0.0 Total 18 100.0
- Maximum maturity
Number of Respondents Percent Tightened considerably 0 0.0 Tightened somewhat 0 0.0 Remained basically unchanged 16 88.9 Eased somewhat 2 11.1 Eased considerably 0 0.0 Total 18 100.0
- Haircuts
Number of Respondents Percent Tightened considerably 0 0.0 Tightened somewhat 0 0.0 Remained basically unchanged 17 94.4 Eased somewhat 1 5.6 Eased considerably 0 0.0 Total 18 100.0
- Collateral spreads over relevant benchmark (effective financing rates)
Number of Respondents Percent Tightened considerably 0 0.0 Tightened somewhat 1 5.9 Remained basically unchanged 15 88.2 Eased somewhat 1 5.9 Eased considerably 0 0.0 Total 17 100.0
- Maximum amount of funding
53. Over the past three months, how has demand for funding of high-grade corporate bonds by your institution’s clients changed?
| Number of Respondents | Percent | |
|---|---|---|
| Increased considerably | 0 | 0.0 |
| Increased somewhat | 2 | 10.5 |
| Remained basically unchanged | 16 | 84.2 |
| Decreased somewhat | 1 | 5.3 |
| Decreased considerably | 0 | 0.0 |
| Total | 19 | 100.0 |
54. Over the past three months, how has demand for term funding with a maturity greater than 30 days of high-grade corporate bonds by your institution’s clients changed?
| Number of Respondents | Percent | |
|---|---|---|
| Increased considerably | 0 | 0.0 |
| Increased somewhat | 3 | 15.8 |
| Remained basically unchanged | 15 | 78.9 |
| Decreased somewhat | 1 | 5.3 |
| Decreased considerably | 0 | 0.0 |
| Total | 19 | 100.0 |
55. Over the past three months, how have liquidity and functioning in the high-grade corporate bond market changed?
| Number of Respondents | Percent | |
|---|---|---|
| Improved considerably | 0 | 0.0 |
| Improved somewhat | 1 | 5.3 |
| Remained basically unchanged | 18 | 94.7 |
| Deteriorated somewhat | 0 | 0.0 |
| Deteriorated considerably | 0 | 0.0 |
| Total | 19 | 100.0 |
High-Yield Corporate Bonds
56. Over the past three months, how have the terms under which high-yield corporate bonds are funded changed?
- Terms for average clients
- Maximum amount of funding
Number of Respondents Percent Tightened considerably 0 0.0 Tightened somewhat 0 0.0 Remained basically unchanged 16 94.1 Eased somewhat 1 5.9 Eased considerably 0 0.0 Total 17 100.0
- Maximum maturity
Number of Respondents Percent Tightened considerably 0 0.0 Tightened somewhat 0 0.0 Remained basically unchanged 17 100.0 Eased somewhat 0 0.0 Eased considerably 0 0.0 Total 17 100.0
- Haircuts
Number of Respondents Percent Tightened considerably 0 0.0 Tightened somewhat 0 0.0 Remained basically unchanged 17 100.0 Eased somewhat 0 0.0 Eased considerably 0 0.0 Total 17 100.0
- Collateral spreads over relevant benchmark (effective financing rates)
Number of Respondents Percent Tightened considerably 0 0.0 Tightened somewhat 0 0.0 Remained basically unchanged 15 93.8 Eased somewhat 1 6.3 Eased considerably 0 0.0 Total 16 100.0
- Maximum amount of funding
- Terms for most-favored clients, as a consequence of breadth, duration, and/or extent of relationship
- Maximum amount of funding
Number of Respondents Percent Tightened considerably 0 0.0 Tightened somewhat 0 0.0 Remained basically unchanged 17 100.0 Eased somewhat 0 0.0 Eased considerably 0 0.0 Total 17 100.0
- Maximum maturity
Number of Respondents Percent Tightened considerably 0 0.0 Tightened somewhat 0 0.0 Remained basically unchanged 16 94.1 Eased somewhat 1 5.9 Eased considerably 0 0.0 Total 17 100.0
- Haircuts
Number of Respondents Percent Tightened considerably 0 0.0 Tightened somewhat 0 0.0 Remained basically unchanged 16 94.1 Eased somewhat 1 5.9 Eased considerably 0 0.0 Total 17 100.0
- Collateral spreads over relevant benchmark (effective financing rates)
Number of Respondents Percent Tightened considerably 0 0.0 Tightened somewhat 0 0.0 Remained basically unchanged 15 93.8 Eased somewhat 1 6.3 Eased considerably 0 0.0 Total 16 100.0
- Maximum amount of funding
57. Over the past three months, how has demand for funding of high-yield corporate bonds by your institution’s clients changed?
| Number of Respondents | Percent | |
|---|---|---|
| Increased considerably | 0 | 0.0 |
| Increased somewhat | 2 | 11.8 |
| Remained basically unchanged | 15 | 88.2 |
| Decreased somewhat | 0 | 0.0 |
| Decreased considerably | 0 | 0.0 |
| Total | 17 | 100.0 |
58. Over the past three months, how has demand for term funding with a maturity greater than 30 days of high-yield corporate bonds by your institution’s clients changed?
| Number of Respondents | Percent | |
|---|---|---|
| Increased considerably | 0 | 0.0 |
| Increased somewhat | 3 | 17.6 |
| Remained basically unchanged | 14 | 82.4 |
| Decreased somewhat | 0 | 0.0 |
| Decreased considerably | 0 | 0.0 |
| Total | 17 | 100.0 |
59. Over the past three months, how have liquidity and functioning in the high-yield corporate bond market changed?
| Number of Respondents | Percent | |
|---|---|---|
| Improved considerably | 0 | 0.0 |
| Improved somewhat | 1 | 5.9 |
| Remained basically unchanged | 16 | 94.1 |
| Deteriorated somewhat | 0 | 0.0 |
| Deteriorated considerably | 0 | 0.0 |
| Total | 17 | 100.0 |
Equities (Including through Stock Loan)
60. Over the past three months, how have the terms under which equities are funded (including through stock loan) changed?
- Terms for average clients
- Maximum amount of funding
Number of Respondents Percent Tightened considerably 0 0.0 Tightened somewhat 0 0.0 Remained basically unchanged 20 95.2 Eased somewhat 1 4.8 Eased considerably 0 0.0 Total 21 100.0
- Maximum maturity
Number of Respondents Percent Tightened considerably 0 0.0 Tightened somewhat 0 0.0 Remained basically unchanged 21 100.0 Eased somewhat 0 0.0 Eased considerably 0 0.0 Total 21 100.0
- Haircuts
Number of Respondents Percent Tightened considerably 0 0.0 Tightened somewhat 0 0.0 Remained basically unchanged 21 100.0 Eased somewhat 0 0.0 Eased considerably 0 0.0 Total 21 100.0
- Collateral spreads over relevant benchmark (effective financing rates)
Number of Respondents Percent Tightened considerably 0 0.0 Tightened somewhat 0 0.0 Remained basically unchanged 20 100.0 Eased somewhat 0 0.0 Eased considerably 0 0.0 Total 20 100.0
- Maximum amount of funding
- Terms for most-favored clients, as a consequence of breadth, duration, and/or extent of relationship
- Maximum amount of funding
Number of Respondents Percent Tightened considerably 0 0.0 Tightened somewhat 0 0.0 Remained basically unchanged 19 90.5 Eased somewhat 2 9.5 Eased considerably 0 0.0 Total 21 100.0
- Maximum maturity
Number of Respondents Percent Tightened considerably 0 0.0 Tightened somewhat 0 0.0 Remained basically unchanged 20 95.2 Eased somewhat 1 4.8 Eased considerably 0 0.0 Total 21 100.0
- Haircuts
Number of Respondents Percent Tightened considerably 0 0.0 Tightened somewhat 0 0.0 Remained basically unchanged 21 100.0 Eased somewhat 0 0.0 Eased considerably 0 0.0 Total 21 100.0
- Collateral spreads over relevant benchmark (effective financing rates)
Number of Respondents Percent Tightened considerably 0 0.0 Tightened somewhat 0 0.0 Remained basically unchanged 19 95.0 Eased somewhat 1 5.0 Eased considerably 0 0.0 Total 20 100.0
- Maximum amount of funding
61. Over the past three months, how has demand for funding of equities (including through stock loan) by your institution’s clients changed?
| Number of Respondents | Percent | |
|---|---|---|
| Increased considerably | 0 | 0.0 |
| Increased somewhat | 3 | 14.3 |
| Remained basically unchanged | 17 | 81.0 |
| Decreased somewhat | 1 | 4.8 |
| Decreased considerably | 0 | 0.0 |
| Total | 21 | 100.0 |
Agency Residential Mortgage-Backed Securities
62. Over the past three months, how have the terms under which agency RMBS are funded changed?
- Terms for average clients
- Maximum amount of funding
Number of Respondents Percent Tightened considerably 0 0.0 Tightened somewhat 0 0.0 Remained basically unchanged 20 100.0 Eased somewhat 0 0.0 Eased considerably 0 0.0 Total 20 100.0
- Maximum maturity
Number of Respondents Percent Tightened considerably 0 0.0 Tightened somewhat 0 0.0 Remained basically unchanged 20 100.0 Eased somewhat 0 0.0 Eased considerably 0 0.0 Total 20 100.0
- Haircuts
Number of Respondents Percent Tightened considerably 0 0.0 Tightened somewhat 0 0.0 Remained basically unchanged 20 100.0 Eased somewhat 0 0.0 Eased considerably 0 0.0 Total 20 100.0
- Collateral spreads over relevant benchmark (effective financing rates)
Number of Respondents Percent Tightened considerably 0 0.0 Tightened somewhat 1 5.3 Remained basically unchanged 16 84.2 Eased somewhat 2 10.5 Eased considerably 0 0.0 Total 19 100.0
- Maximum amount of funding
- Terms for most-favored clients, as a consequence of breadth, duration, and/or extent of relationship
- Maximum amount of funding
Number of Respondents Percent Tightened considerably 0 0.0 Tightened somewhat 0 0.0 Remained basically unchanged 18 90.0 Eased somewhat 2 10.0 Eased considerably 0 0.0 Total 20 100.0
- Maximum maturity
Number of Respondents Percent Tightened considerably 0 0.0 Tightened somewhat 0 0.0 Remained basically unchanged 19 95.0 Eased somewhat 1 5.0 Eased considerably 0 0.0 Total 20 100.0
- Haircuts
Number of Respondents Percent Tightened considerably 0 0.0 Tightened somewhat 0 0.0 Remained basically unchanged 20 100.0 Eased somewhat 0 0.0 Eased considerably 0 0.0 Total 20 100.0
- Collateral spreads over relevant benchmark (effective financing rates)
Number of Respondents Percent Tightened considerably 0 0.0 Tightened somewhat 1 5.3 Remained basically unchanged 17 89.5 Eased somewhat 1 5.3 Eased considerably 0 0.0 Total 19 100.0
- Maximum amount of funding
63. Over the past three months, how has demand for funding of agency RMBS by your institution’s clients changed?
| Number of Respondents | Percent | |
|---|---|---|
| Increased considerably | 0 | 0.0 |
| Increased somewhat | 3 | 15.0 |
| Remained basically unchanged | 17 | 85.0 |
| Decreased somewhat | 0 | 0.0 |
| Decreased considerably | 0 | 0.0 |
| Total | 20 | 100.0 |
64. Over the past three months, how has demand for term funding with a maturity greater than 30 days of agency RMBS by your institution’s clients changed?
| Number of Respondents | Percent | |
|---|---|---|
| Increased considerably | 0 | 0.0 |
| Increased somewhat | 2 | 10.0 |
| Remained basically unchanged | 18 | 90.0 |
| Decreased somewhat | 0 | 0.0 |
| Decreased considerably | 0 | 0.0 |
| Total | 20 | 100.0 |
65. Over the past three months, how have liquidity and functioning in the agency RMBS market changed?
| Number of Respondents | Percent | |
|---|---|---|
| Improved considerably | 0 | 0.0 |
| Improved somewhat | 1 | 5.0 |
| Remained basically unchanged | 17 | 85.0 |
| Deteriorated somewhat | 2 | 10.0 |
| Deteriorated considerably | 0 | 0.0 |
| Total | 20 | 100.0 |
Non-agency Residential Mortgage-Backed Securities
66. Over the past three months, how have the terms under which non-agency RMBS are funded changed?
- Terms for average clients
- Maximum amount of funding
Number of Respondents Percent Tightened considerably 0 0.0 Tightened somewhat 0 0.0 Remained basically unchanged 15 93.8 Eased somewhat 1 6.3 Eased considerably 0 0.0 Total 16 100.0
- Maximum maturity
Number of Respondents Percent Tightened considerably 0 0.0 Tightened somewhat 0 0.0 Remained basically unchanged 13 81.3 Eased somewhat 3 18.8 Eased considerably 0 0.0 Total 16 100.0
- Haircuts
Number of Respondents Percent Tightened considerably 0 0.0 Tightened somewhat 0 0.0 Remained basically unchanged 15 93.8 Eased somewhat 1 6.3 Eased considerably 0 0.0 Total 16 100.0
- Collateral spreads over relevant benchmark (effective financing rates)
Number of Respondents Percent Tightened considerably 0 0.0 Tightened somewhat 0 0.0 Remained basically unchanged 13 86.7 Eased somewhat 2 13.3 Eased considerably 0 0.0 Total 15 100.0
- Maximum amount of funding
- Terms for most-favored clients, as a consequence of breadth, duration, and/or extent of relationship
- Maximum amount of funding
Number of Respondents Percent Tightened considerably 0 0.0 Tightened somewhat 0 0.0 Remained basically unchanged 14 87.5 Eased somewhat 2 12.5 Eased considerably 0 0.0 Total 16 100.0
- Maximum maturity
Number of Respondents Percent Tightened considerably 0 0.0 Tightened somewhat 0 0.0 Remained basically unchanged 13 81.3 Eased somewhat 3 18.8 Eased considerably 0 0.0 Total 16 100.0
- Haircuts
Number of Respondents Percent Tightened considerably 0 0.0 Tightened somewhat 1 6.3 Remained basically unchanged 11 68.8 Eased somewhat 4 25.0 Eased considerably 0 0.0 Total 16 100.0
- Collateral spreads over relevant benchmark (effective financing rates)
Number of Respondents Percent Tightened considerably 0 0.0 Tightened somewhat 0 0.0 Remained basically unchanged 13 86.7 Eased somewhat 2 13.3 Eased considerably 0 0.0 Total 15 100.0
- Maximum amount of funding
67. Over the past three months, how has demand for funding of non-agency RMBS by your institution’s clients changed?
| Number of Respondents | Percent | |
|---|---|---|
| Increased considerably | 0 | 0.0 |
| Increased somewhat | 7 | 43.8 |
| Remained basically unchanged | 9 | 56.3 |
| Decreased somewhat | 0 | 0.0 |
| Decreased considerably | 0 | 0.0 |
| Total | 16 | 100.0 |
68. Over the past three months, how has demand for term funding with a maturity greater than 30 days of non-agency RMBS by your institution’s clients changed?
| Number of Respondents | Percent | |
|---|---|---|
| Increased considerably | 0 | 0.0 |
| Increased somewhat | 4 | 25.0 |
| Remained basically unchanged | 12 | 75.0 |
| Decreased somewhat | 0 | 0.0 |
| Decreased considerably | 0 | 0.0 |
| Total | 16 | 100.0 |
69. Over the past three months, how have liquidity and functioning in the non-agency RMBS market changed?
| Number of Respondents | Percent | |
|---|---|---|
| Improved considerably | 0 | 0.0 |
| Improved somewhat | 5 | 31.3 |
| Remained basically unchanged | 11 | 68.8 |
| Deteriorated somewhat | 0 | 0.0 |
| Deteriorated considerably | 0 | 0.0 |
| Total | 16 | 100.0 |
Commercial Mortgage-Backed Securities
70. Over the past three months, how have the terms under which CMBS are funded changed?
- Terms for average clients
- Maximum amount of funding
Number of Respondents Percent Tightened considerably 0 0.0 Tightened somewhat 1 6.7 Remained basically unchanged 14 93.3 Eased somewhat 0 0.0 Eased considerably 0 0.0 Total 15 100.0
- Maximum maturity
Number of Respondents Percent Tightened considerably 0 0.0 Tightened somewhat 0 0.0 Remained basically unchanged 14 93.3 Eased somewhat 1 6.7 Eased considerably 0 0.0 Total 15 100.0
- Haircuts
Number of Respondents Percent Tightened considerably 0 0.0 Tightened somewhat 0 0.0 Remained basically unchanged 14 93.3 Eased somewhat 1 6.7 Eased considerably 0 0.0 Total 15 100.0
- Collateral spreads over relevant benchmark (effective financing rates)
Number of Respondents Percent Tightened considerably 0 0.0 Tightened somewhat 0 0.0 Remained basically unchanged 13 86.7 Eased somewhat 2 13.3 Eased considerably 0 0.0 Total 15 100.0
- Maximum amount of funding
- Terms for most-favored clients, as a consequence of breadth, duration, and/or extent of relationship
- Maximum amount of funding
Number of Respondents Percent Tightened considerably 0 0.0 Tightened somewhat 0 0.0 Remained basically unchanged 14 93.3 Eased somewhat 1 6.7 Eased considerably 0 0.0 Total 15 100.0
- Maximum maturity
Number of Respondents Percent Tightened considerably 0 0.0 Tightened somewhat 0 0.0 Remained basically unchanged 12 80.0 Eased somewhat 3 20.0 Eased considerably 0 0.0 Total 15 100.0
- Haircuts
- Collateral spreads over relevant benchmark (effective financing rates)
Number of Respondents Percent Tightened considerably 0 0.0 Tightened somewhat 0 0.0 Remained basically unchanged 13 86.7 Eased somewhat 2 13.3 Eased considerably 0 0.0 Total 15 100.0
Number of Respondents Percent Tightened considerably 0 0.0 Tightened somewhat 0 0.0 Remained basically unchanged 12 80.0 Eased somewhat 3 20.0 Eased considerably 0 0.0 Total 15 100.0
- Maximum amount of funding
71. Over the past three months, how has demand for funding of CMBS by your institution’s clients changed?
| Number of Respondents | Percent | |
|---|---|---|
| Increased considerably | 0 | 0.0 |
| Increased somewhat | 2 | 13.3 |
| Remained basically unchanged | 13 | 86.7 |
| Decreased somewhat | 0 | 0.0 |
| Decreased considerably | 0 | 0.0 |
| Total | 15 | 100.0 |
72. Over the past three months, how has demand for term funding with a maturity greater than 30 days of CMBS by your institution’s clients changed?
| Number of Respondents | Percent | |
|---|---|---|
| Increased considerably | 0 | 0.0 |
| Increased somewhat | 2 | 13.3 |
| Remained basically unchanged | 13 | 86.7 |
| Decreased somewhat | 0 | 0.0 |
| Decreased considerably | 0 | 0.0 |
| Total | 15 | 100.0 |
73. Over the past three months, how have liquidity and functioning in the CMBS market changed?
| Number of Respondents | Percent | |
|---|---|---|
| Improved considerably | 0 | 0.0 |
| Improved somewhat | 3 | 20.0 |
| Remained basically unchanged | 12 | 80.0 |
| Deteriorated somewhat | 0 | 0.0 |
| Deteriorated considerably | 0 | 0.0 |
| Total | 15 | 100.0 |
Consumer Asset-Backed Securities
74. Over the past three months, how have the terms under which consumer ABS (for example, backed by credit card receivables or auto loans) are funded changed?
- Terms for average clients
- Maximum amount of funding
Number of Respondents Percent Tightened considerably 0 0.0 Tightened somewhat 0 0.0 Remained basically unchanged 14 100.0 Eased somewhat 0 0.0 Eased considerably 0 0.0 Total 14 100.0
- Maximum maturity
Number of Respondents Percent Tightened considerably 0 0.0 Tightened somewhat 0 0.0 Remained basically unchanged 14 100.00 Eased somewhat 0 0.0 Eased considerably 0 0.0 Total 14 100.0
- Haircuts
Number of Respondents Percent Tightened considerably 0 0.0 Tightened somewhat 0 0.0 Remained basically unchanged 14 100.0 Eased somewhat 0 0.0 Eased considerably 0 0.0 Total 14 100.0
- Collateral spreads over relevant benchmark (effective financing rates)
Number of Respondents Percent Tightened considerably 0 0.0 Tightened somewhat 0 0.0 Remained basically unchanged 14 100.0 Eased somewhat 0 0.0 Eased considerably 0 0.0 Total 14 100.0
- Maximum amount of funding
- Terms for most-favored clients, as a consequence of breadth, duration, and/or extent of relationship
- Maximum amount of funding
Number of Respondents Percent Tightened considerably 0 0.0 Tightened somewhat 0 0.0 Remained basically unchanged 14 100.0 Eased somewhat 0 0.0 Eased considerably 0 0.0 Total 14 100.0
- Maximum maturity
Number of Respondents Percent Tightened considerably 0 0.0 Tightened somewhat 0 0.0 Remained basically unchanged 14 100.0 Eased somewhat 0 0.0 Eased considerably 0 0.0 Total 14 100.0
- Haircuts
Number of Respondents Percent Tightened considerably 0 0.0 Tightened somewhat 0 0.0 Remained basically unchanged 14 100.0 Eased somewhat 0 0.0 Eased considerably 0 0.0 Total 14 100.0
- Collateral spreads over relevant benchmark (effective financing rates)
Number of Respondents Percent Tightened considerably 0 0.0 Tightened somewhat 0 0.0 Remained basically unchanged 14 0.0 Eased somewhat 0 0.0 Eased considerably 0 0.0 Total 14 100.0
- Maximum amount of funding
75. Over the past three months, how has demand for funding of consumer ABS by your institution’s clients changed?
| Number of Respondents | Percent | |
|---|---|---|
| Increased considerably | 0 | 0.0 |
| Increased somewhat | 1 | 7.1 |
| Remained basically unchanged | 13 | 92.9 |
| Decreased somewhat | 0 | 0.0 |
| Decreased considerably | 0 | 0.0 |
| Total | 14 | 100.0 |
76. Over the past three months, how has demand for term funding with a maturity greater than 30 days of consumer ABS by your institution’s clients changed?
| Number of Respondents | Percent | |
|---|---|---|
| Increased considerably | 0 | 0.0 |
| Increased somewhat | 1 | 7.1 |
| Remained basically unchanged | 13 | 92.9 |
| Decreased somewhat | 0 | 0.0 |
| Decreased considerably | 0 | 0.0 |
| Total | 14 | 100.0 |
77. Over the past three months, how have liquidity and functioning in the consumer ABS market changed?
| Number of Respondents | Percent | |
|---|---|---|
| Improved considerably | 0 | 0.0 |
| Improved somewhat | 0 | 0.0 |
| Remained basically unchanged | 14 | 100.0 |
| Deteriorated somewhat | 0 | 0.0 |
| Deteriorated considerably | 0 | 0.0 |
| Total | 14 | 100.0 |
Mark and Collateral Disputes
78. Over the past three months, how has the volume of mark and collateral disputes relating to lending against each of the following collateral types changed?
- High-grade corporate bonds
Number of Respondents Percent Increased considerably 0 0.0 Increased somewhat 0 0.0 Remained basically unchanged 19 100.0 Decreased somewhat 0 0.0 Decreased considerably 0 0.0 Total 19 100.0
- High-yield corporate bonds
Number of Respondents Percent Increased considerably 0 0.0 Increased somewhat 0 0.0 Remained basically unchanged 18 100.0 Decreased somewhat 0 0.0 Decreased considerably 0 0.0 Total 18 100.0
- Equities
Number of Respondents Percent Increased considerably 0 0.0 Increased somewhat 0 0.0 Remained basically unchanged 19 100.0 Decreased somewhat 0 0.0 Decreased considerably 0 0.0 Total 19 100.0
- Agency RMBS
Number of Respondents Percent Increased considerably 0 0.0 Increased somewhat 0 0.0 Remained basically unchanged 19 100.0 Decreased somewhat 0 0.0 Decreased considerably 0 0.0 Total 19 100.0
- Non-agency RMBS
Number of Respondents Percent Increased considerably 0 0.0 Increased somewhat 0 0.0 Remained basically unchanged 15 100.0 Decreased somewhat 0 0.0 Decreased considerably 0 0.0 Total 15 100.0
- CMBS
Number of Respondents Percent Increased considerably 0 0.0 Increased somewhat 0 0.0 Remained basically unchanged 16 100.0 Decreased somewhat 0 0.0 Decreased considerably 0 0.0 Total 16 100.0
- Consumer ABS
Number of Respondents Percent Increased considerably 0 0.0 Increased somewhat 0 0.0 Remained basically unchanged 15 100.0 Decreased somewhat 0 0.0 Decreased considerably 0 0.0 Total 15 100.0
79. Over the past three months, how has the duration and persistence of mark and collateral disputes relating to lending against each of the following collateral types changed?
- High-grade corporate bonds
Number of Respondents Percent Increased considerably 0 0.0 Increased somewhat 0 0.0 Remained basically unchanged 19 100.0 Decreased somewhat 0 0.0 Decreased considerably 0 0.0 Total 19 100.0
- High-yield corporate bonds
Number of Respondents Percent Increased considerably 0 0.0 Increased somewhat 0 0.0 Remained basically unchanged 18 100.0 Decreased somewhat 0 0.0 Decreased considerably 0 0.0 Total 18 100.0
- Equities
Number of Respondents Percent Increased considerably 0 0.0 Increased somewhat 0 0.0 Remained basically unchanged 19 100.0 Decreased somewhat 0 0.0 Decreased considerably 0 0.0 Total 19 100.0
- Agency RMBS
Number of Respondents Percent Increased considerably 0 0.0 Increased somewhat 0 0.0 Remained basically unchanged 19 100.0 Decreased somewhat 0 0.0 Decreased considerably 0 0.0 Total 19 100.0
- Non-agency RMBS
Number of Respondents Percent Increased considerably 0 0.0 Increased somewhat 0 0.0 Remained basically unchanged 16 100.0 Decreased somewhat 0 0.0 Decreased considerably 0 0.0 Total 16 100.0
- CMBS
Number of Respondents Percent Increased considerably 0 0.0 Increased somewhat 0 0.0 Remained basically unchanged 17 100.0 Decreased somewhat 0 0.0 Decreased considerably 0 0.0 Total 17 100.0
- Consumer ABS
Number of Respondents Percent Increased considerably 0 0.0 Increased somewhat 0 0.0 Remained basically unchanged 15 100.0 Decreased somewhat 0 0.0 Decreased considerably 0 0.0 Total 15 100.0
Optional Question
Question 80 requests feedback on any other issues you judge to be important relating to credit terms applicable to securities financing transactions and OTC derivatives contracts.10
Special Questions
In this Section:
The following special questions are intended to provide better context for interpreting the core set of questions in the previous section, which focus on changes in credit terms over the preceding three months. Unlike the core questions, these special questions will not be included in the survey on an ongoing basis.
Margin Lending
Over the past year, some publicly disseminated measures of margin lending have risen significantly. Question 81 seeks information on the rise in borrowing subject to traditional Regulation T limits relative to account equity by retail investors.11 Question 82 asks about the growth in the use of such financing by different types of hedge funds. Question 83 solicits similar information regarding financing by institutional managers of the specified types under the Financial Industry Regulatory Authority's (FINRA) portfolio margining program. Question 84 focuses on borrowing by the specified types of institutional managers under so-called enhanced leverage programs that are subject to neither Regulation T limits nor FINRA's portfolio margining requirements, that typically involve transactions booked in non-U.S. entities, and that may be used by clients seeking greater leverage or to more efficiently utilize collateral. Question 85 asks about the classes of equity securities funded by retail clients. Question 86 asks about the classes of equity securities funded by institutional managers.
81. How has the use of margin financing subject to traditional Regulation T limits by retail investors changed since June 2013?
| Number of Respondents | Percent | |
|---|---|---|
| Increased considerably | 0 | 0.0 |
| Increased somewhat | 1 | 11.1 |
| Remained basically unchanged | 7 | 77.8 |
| Decreased somewhat | 1 | 11.1 |
| Decreased considerably | 0 | 0.0 |
| Total | 9 | 100.0 |
82. How has the use of margin financing subject to traditional Regulation T limits by each of the following types of institutional managers, relative to account equity, changed since June 2013?
- Equity long-short hedge funds (fundamentally oriented)
Number of Respondents Percent Increased significantly 0 0.0 Increased somewhat 2 14.3 Remained basically unchanged 9 64.3 Decreased somewhat 2 14.3 Decreased considerably 1 7.1 Total 14 100.0
- Equity long-short hedge funds (quantitatively oriented)
Number of Respondents Percent Increased significantly 1 7.7 Increased somewhat 1 7.7 Remained basically unchanged 8 61.5 Decreased somewhat 2 15.4 Decreased considerably 1 7.7 Total 13 100.0
- Event-driven equity funds
Number of Respondents Percent Increased significantly 0 0.0 Increased somewhat 1 9.1 Remained basically unchanged 8 72.7 Decreased somewhat 1 9.1 Decreased considerably 1 9.1 Total 11 100.0
- Other equity-oriented hedge funds
Number of Respondents Percent Increased significantly 0 0.0 Increased somewhat 0 0.0 Remained basically unchanged 8 80.0 Decreased somewhat 1 10.0 Decreased considerably 1 10.0 Total 10 100.0
- Macro-oriented hedge funds
Number of Respondents Percent Increased significantly 0 0.0 Increased somewhat 0 0.0 Remained basically unchanged 8 80.0 Decreased somewhat 1 10.0 Decreased considerably 1 10.0 Total 10 100.0
- Other hedge funds
Number of Respondents Percent Increased significantly 0 0.0 Increased somewhat 1 9.1 Remained basically unchanged 8 72.7 Decreased somewhat 1 9.1 Decreased considerably 1 9.1 Total 11 100.0
83. How has the use of margin financing provided under FINRA's portfolio margining program by each of the following types of institutional managers changed since June 2013?
- Equity long-short hedge funds (fundamentally oriented)
Number of Respondents Percent Increased significantly 1 7.7 Increased somewhat 5 38.5 Remained basically unchanged 7 53.8 Decreased somewhat 0 0.0 Decreased considerably 0 0.0 Total 13 100.0
- Equity long-short hedge funds (quantitatively oriented)
Number of Respondents Percent Increased significantly 1 8.3 Increased somewhat 6 50.0 Remained basically unchanged 4 33.3 Decreased somewhat 1 8.3 Decreased considerably 0 0.0 Total 12 100.0
- Event-driven equity funds
Number of Respondents Percent Increased significantly 1 9.1 Increased somewhat 3 27.3 Remained basically unchanged 5 45.5 Decreased somewhat 2 18.2 Decreased considerably 0 0.0 Total 11 100.0
- Other equity-oriented hedge funds
Number of Respondents Percent Increased significantly 1 9.1 Increased somewhat 3 27.3 Remained basically unchanged 6 54.5 Decreased somewhat 0 0.0 Decreased considerably 1 9.1 Total 11 100.0
- Macro-oriented hedge funds
Number of Respondents Percent Increased significantly 1 9.1 Increased somewhat 3 27.3 Remained basically unchanged 6 54.5 Decreased somewhat 1 9.1 Decreased considerably 0 0.0 Total 11 100.0
- Other hedge funds
Number of Respondents Percent Increased significantly 1 8.3 Increased somewhat 3 25.0 Remained basically unchanged 7 58.3 Decreased somewhat 1 8.3 Decreased considerably 0 0.0 Total 12 100.0
84. How has the use of margin financing under enhanced leverage programs--which are subject to neither Regulation T limits nor FINRA's portfolio margining requirements--by each of the following types of institutional managers changed since June 2013?
- Equity long-short hedge funds (fundamentally oriented)
Number of Respondents Percent Increased significantly 0 0.0 Increased somewhat 7 53.8 Remained basically unchanged 5 38.5 Decreased somewhat 1 7.7 Decreased considerably 0 0.0 Total 13 100.0
- Equity long-short hedge funds (quantitatively oriented)
Number of Respondents Percent Increased significantly 0 0.0 Increased somewhat 7 53.8 Remained basically unchanged 5 38.5 Decreased somewhat 1 7.7 Decreased considerably 0 0.0 Total 13 100.0
- Event-driven equity funds
Number of Respondents Percent Increased significantly 0 0.0 Increased somewhat 4 36.4 Remained basically unchanged 6 54.5 Decreased somewhat 1 9.1 Decreased considerably 0 0.0 Total 11 100.0
- Other equity-oriented hedge funds
Number of Respondents Percent Increased significantly 1 8.3 Increased somewhat 4 33.3 Remained basically unchanged 5 41.7 Decreased somewhat 2 16.7 Decreased considerably 0 0.0 Total 12 100.0
- Macro-oriented hedge funds
Number of Respondents Percent Increased significantly 0 0.0 Increased somewhat 5 45.5 Remained basically unchanged 5 45.5 Decreased somewhat 1 9.1 Decreased considerably 0 0.0 Total 11 100.0
- Other hedge funds
Number of Respondents Percent Increased significantly 0 0.0 Increased somewhat 7 53.8 Remained basically unchanged 5 38.5 Decreased somewhat 1 7.7 Decreased considerably 0 0.0 Total 13 100.0
85. How has the use of margin financing by retail investors for each of the following classes of equities changed since June 2013?
- Technology and social media small-cap equities
Number of Respondents Percent Increased significantly 0 0.0 Increased somewhat 0 0.0 Remained basically unchanged 5 100.0 Decreased somewhat 0 0.0 Decreased considerably 0 0.0 Total 5 100.0
- Other small-cap equities
Number of Respondents Percent Increased significantly 0 0.0 Increased somewhat 0 0.0 Remained basically unchanged 5 100.0 Decreased somewhat 0 0.0 Decreased considerably 0 0.0 Total 5 100.0
- Technology and social media large-cap equities
Number of Respondents Percent Increased significantly 0 0.0 Increased somewhat 0 0.0 Remained basically unchanged 5 100.0 Decreased somewhat 0 0.0 Decreased considerably 0 0.0 Total 5 100.0
- Other large-cap equities
Number of Respondents Percent Increased significantly 0 0.0 Increased somewhat 0 0.0 Remained basically unchanged 5 100.0 Decreased somewhat 0 0.0 Decreased considerably 0 0.0 Total 5 100.0
- Non-U.S. equities
Number of Respondents Percent Increased significantly 0 0.0 Increased somewhat 0 0.0 Remained basically unchanged 5 100.0 Decreased somewhat 0 0.0 Decreased considerably 0 0.0 Total 5 100.0
86. Considering all types of margin financing available to all types of institutional managers, how has the use of margin financing by these managers for each of the following classes of equities changed since June 2013?
- Technology and social media small-cap equities
Number of Respondents Percent Increased significantly 0 0.0 Increased somewhat 7 53.8 Remained basically unchanged 6 46.2 Decreased somewhat 0 0.0 Decreased considerably 0 0.0 Total 13 100.0
- Other small-cap equities
Number of Respondents Percent Increased significantly 0 0.0 Increased somewhat 4 28.6 Remained basically unchanged 9 64.3 Decreased somewhat 1 7.1 Decreased considerably 0 0.0 Total 14 100.0
- Technology and social media large-cap equities
Number of Respondents Percent Increased significantly 1 7.7 Increased somewhat 7 53.8 Remained basically unchanged 5 38.5 Decreased somewhat 0 0.0 Decreased considerably 0 0.0 Total 13 100.0
- Other large-cap equities
Number of Respondents Percent Increased significantly 0 0.0 Increased somewhat 8 57.1 Remained basically unchanged 6 42.9 Decreased somewhat 0 0.0 Decreased considerably 0 0.0 Total 14 100.0
- Non-U.S. equities
Number of Respondents Percent Increased significantly 0 0.0 Increased somewhat 6 46.2 Remained basically unchanged 6 46.2 Decreased somewhat 1 7.7 Decreased considerably 0 0.0 Total 13 100.0
Financing of Tranches of Collateralized Loan Obligations
Some press reports have recently pointed to an uptick in the financing of collateralized loan obligations (CLO) tranches by investors seeking to increase the effective returns on such portfolios through leverage. Question 87 solicits information on changes in the terms for such funding since the start of the year. Question 88 asks about changes in demand by investors of specified types over that period. Question 89 focuses on where CLO tranches being funded stand in the capital structure.
87. How have the terms under which CLO tranches are funded at your institution changed since the beginning of 2014?
| Number of Respondents | Percent | |
|---|---|---|
| Tightened considerably | 0 | 0.0 |
| Tightened somewhat | 0 | 0.0 |
| Remained basically unchanged | 7 | 58.3 |
| Eased somewhat | 5 | 41.7 |
| Eased considerably | 0 | 0.0 |
| Total | 12 | 100.0 |
88. How has demand for funding of CLO tranches by your institution's clients for each of the following types changed since the beginning of 2014?
- Credit-oriented hedge funds
Number of Respondents Percent Increased significantly 0 0.0 Increased somewhat 9 75.0 Remained basically unchanged 3 25.0 Decreased somewhat 0 0.0 Decreased considerably 0 0.0 Total 12 100.0
- Other hedge funds
Number of Respondents Percent Increased significantly 0 0.0 Increased somewhat 6 46.2 Remained basically unchanged 7 53.8 Decreased somewhat 0 0.0 Decreased considerably 0 0.0 Total 13 100.0
- Private equity hedge funds
Number of Respondents Percent Increased significantly 0 0.0 Increased somewhat 2 18.2 Remained basically unchanged 9 81.8 Decreased somewhat 0 0.0 Decreased considerably 0 0.0 Total 11 100.0
- Pension plans
Number of Respondents Percent Increased significantly 0 0.0 Increased somewhat 1 9.1 Remained basically unchanged 10 90.9 Decreased somewhat 0 0.0 Decreased considerably 0 0.0 Total 11 100.0
- Insurance compaines
Number of Respondents Percent Increased significantly 0 0.0 Increased somewhat 0 0.0 Remained basically unchanged 11 100.0 Decreased somewhat 0 0.0 Decreased considerably 0 0.0 Total 11 100.0
- Separately managed accounts established with investment advisers
Number of Respondents Percent Increased significantly 0 0.0 Increased somewhat 2 18.2 Remained basically unchanged 9 81.8 Decreased somewhat 0 0.0 Decreased considerably 0 0.0 Total 11 100.0
89. To the extent that your institution is currently providing funding for tranches, where do the securities being financed stand in the CLO capital structure?
| Number of Respondents | Percent | |
|---|---|---|
| Essentially all triple-A-rated tranches | 1 | 8.3 |
| Mostly triple-A-rated tranches but with ome mezzanine tranches | 4 | 33.3 |
| A mix of triple-A-rated and mezzanine tranches | 5 | 41.7 |
| Essentially all mezzanine tranches | 1 | 8.3 |
| Mostly triple-A-rated tranches but with some mezzanine and equity tranches | 0 | 0.0 |
| A range of tranches across the capital structure; that is, triple-A-rated, mezzanine, and equity tranches, all in meaningful proportions | 1 | 8.3 |
| Essentially all mezzanine and equity tranches | 0 | 0.0 |
| Essentially all equity tranches | 0 | 0.0 |
| Total | 12 | 100.0 |
Footnotes
1. For questions that ask about credit terms, reported net percentages equal the percentage of institutions that reported tightening terms ("tightened considerably" or "tightened somewhat") minus the percentage of institutions that reported easing terms ("eased considerably" or "eased somewhat"). For questions that ask about demand, reported net fractions equal the percentage of institutions that reported increased demand ("increased considerably" or "increased somewhat") minus the percentage of institutions that reported decreased demand ("decreased considerably" or "decreased somewhat"). Return to text
2. Regulation T, promulgated by the Federal Reserve Board pursuant to authority under the Securities Exchange Act of 1934 to limit securities credit extended by U.S. broker-dealers, generally limits lending against equities to 50 percent of the value of the market value of the collateral. Return to text
3. The Board amended Regulation T in the late 1990s to permit self-regulatory organizations for U.S. broker-dealers to adopt alternative requirements computed under a portfolio margining system if their rules (and the relevant models) were approved by the Securities and Exchange Commission. Beginning in 2007, FINRA received such approval and certain broker-dealers were permitted to offer sophisticated institutional clients such a regime for some financing of equities, with lending generally limited to 85 percent of the market value of the collateral.
Enhanced leveraged programs, which typically utilize a non-U.S. entity to effect or finance some "legs" of the overall transaction, offer sophisticated institutional clients leverage potentially in excess of both the Regulation T and portfolio margining limits. Such programs may also allow collateral to be utilized more efficiently. In effect, the client opts out of the generally applicable "customer protection" regime, which requires segregation of some assets and thereby limits rehypothecation. Return to text
4. The survey asks specifically about requirements, timelines, and thresholds for posting additional margin, acceptable collateral, recognition of portfolio or diversification benefits, triggers and covenants, and other documentation features, including cure periods and cross-default provisions. Return to text
5. Question 80, not discussed here, was optional and allowed respondents to provide additional comments. Return to text
6. Note that survey respondents are instructed to report changes in liquidity and functioning in the market for the underlying collateral to be funded through repurchase agreements and similar secured financing transactions, not changes in the funding market itself. This question is not asked with respect to equity markets in the core questions. Return to text
7. For the purposes of these special questions, margin lending is defined as borrowing relative to account equity. Under this definition, margin lending is deemed to increase when the amount borrowed has risen relative to account equity so that leverage has increased. This circumstance differs from cases in which the amount borrowed has risen in absolute terms but is commensurate with a concurrent increase in equity--for example, due to strong market performance. Return to text
8. For this set of special questions, responses were received from 14 or fewer of the 22 dealers included in the survey. For questions pertaining to retail investors, no more than 9 dealers submitted responses. Return to text
9. For this set of special questions, responses were received from 13 or fewer of the 22 dealers. Return to text
10. See note 5 in the Summary. Return to text
11. Posing the question with reference to account equity is intended to focus on cases in which the amount borrowed has risen relative to account equity so that leverage has increased. This circumstance is different from cases in which the amount borrowed has risen in absolute terms but is commensurate with a concurrent increase in equity, for example, due to strong market performance. These special questions seek information on the former situation--that is, when the increase in margin borrowing results in greater leverage. Return to text
