 Print
Print
Freedom of Information Office
2015 Reserve Bank Budgets
Contents
Action
On December 16, 2014, the Board approved the 2015 Reserve Bank operating budgets totaling $3,968.7 million, an increase of $205.2 million, or 5.5 percent, from the 2014 estimated expenses and $173.0 million, or 4.6 percent, from the approved 2014 budget.1 The Board also approved the 2015 Reserve Bank, Federal Reserve Information Technology (FRIT), and the Office of Employee Benefits (OEB) capital budgets, which total $454.0 million.
The capital budgets are approved with the understanding that approval for actual capital outlays will be in accordance with the Board's Policies and Guidelines Concerning Reserve Bank Operations (FRAM 1-049). This policy states that Reserve Bank management may approve capital commitments for purchases or leases (single-item acquisitions and multicomponent projects) that were included in the Reserve Bank's capital budget approved by the Board, unless the acquisition is designated as strategic or sensitive by the Committee on Federal Reserve Bank Affairs (BAC).2 The chair of the BAC (or the chair's designee) will notify Reserve Bank management if any budgeted commitments and agreements have been designated as strategic or sensitive and, therefore, require the approval of the director of RBOPS or the Board.
Total Expense and Employment Summary
Table 1
Reserve Bank Expenses and Staffing
(dollars in millions)
| 2014 Budget | 2014 Estimate |
2014 Budget vs. 2014 Estimate |
2015 Budget |
2014 Estimate vs. 2015 Budget |
|||
|---|---|---|---|---|---|---|---|
| Amount | Percent | Amount | Percent | ||||
| Central bank services | $2,852.0 | $2,804.8 | -$47.2 | -1.7% | $2,970.5 | $165.7 | 5.9% |
| Monetary Policy | 424.9 | 422.1 | -2.8 | -0.7% | 443.7 | 21.6 | 5.1% |
| Open Market | 189.2 | 185.2 | -4.0 | -2.1% | 193.1 | 7.9 | 4.3% |
| Public Programs | 201.9 | 200.7 | -1.3 | -0.6% | 207.8 | 7.1 | 3.5% |
| Supervision | 1,189.4 | 1,167.5 | -21.9 | -1.8% | 1,260.2 | 92.7 | 7.9% |
| Cash | 581.7 | 564.7 | -16.9 | -2.9% | 593.6 | 28.9 | 5.1% |
| Loans to Depository Institutions | 78.9 | 77.8 | -1.0 | -1.3% | 78.1 | 0.3 | 0.3% |
| All Other* | 186.1 | 186.9 | 0.8 | 0.4% | 194.1 | 7.2 | 3.9% |
| Treasury Services | 550.2 | 540.1 | -10.0 | -1.8% | 579.9 | 39.8 | 7.4% |
| Priced Services | 393.4 | 418.5 | 25.0 | 6.4% | 418.2 | -0.2 | -0.1% |
| Total Expense | $3,795.7 | $3,763.5 | -$32.2 | -0.8% | $3,968.7 | $205.2 | 5.5% |
|
Total ANP |
18,979 | 18,827 | -152 | -0.8% | 19,295 | 468 | 2.5% |
| * Includes Reserve Accounts and Risk Administration and Services to Other Central Banks. Return to table. | |||||||
Discussion
2014 Budget Performance
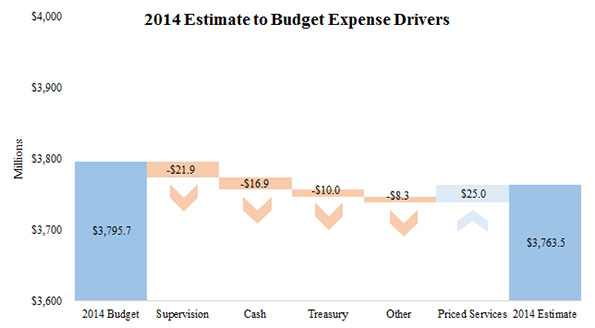
Total 2014 operating expenses for the Reserve Banks are estimated to be $3,763.5 million, which is $32.2 million, or 0.8 percent, less than the approved 2014 budget of $3,795.7 million. Estimated ANP is less than the 2014 budget, largely because of turnover and hiring delays.3
T he 2014 budget underrun is primarily driven by lower-than-planned expenses for supervision, cash, and Treasury services. In the supervision function, increased turnover, delays in hiring budgeted staff, and a System initiative to reduce travel led to lower overall expenses. Cash expenses were lower than anticipated because of updated plans for the CashForward project, cash-processing equipment delays, and higher-than-expected recoveries for cross-shipping fees.4 The underrun in Treasury services is due to decreasing volumes and program changes for several initiatives, including those related to the Treasury Web Application Infrastructure (TWAI). Transition expenses related to the fiscal agent consolidation partially offset this underrun.5 Increased expenses in the priced services function for the disposition of the FedACH Technology Transition program asset partially offset the other decreases in operating expenses.6
Total 2014 estimated employment of 18,827 ANP represents an underrun of 152 ANP, or 0.8 percent, from 2014 budgeted levels of 18,979 ANP. Increased turnover and hiring delays in the supervision function are large drivers of the underrun. In Treasury services, program resource reductions in several Treasury initiatives in response to volume declines are partially offset by staff additions to support the fiscal agent consolidation. Staffing delays in monetary policy and public programs and resource changes, primarily in support and overhead areas, also contribute to the reduction.
Table 2
Significant Staffing (ANP) Changes
2014 Budget to 2014 Estimate
| 2014 Budget | 18,979 |
| Supervision | -78 |
| Treasury | -47 |
| Monetary Policy & Public Programs | -29 |
| Other | 2 |
| 2014 Estimate | 18,827 |
2015 Budgeted Operating Expenses
Total Operating Expenses
The 2015 operating budgets of the Reserve Banks total $3,968.7 million, which is $205.2 million, or 5.5 percent, higher than the 2014 estimate. The largest increase is in the supervision function, which represents approximately one-third of total expenses budgeted in 2015. The growth in supervision is driven by expanded supervisory responsibilities, primarily for large financial institutions, and national supervision initiatives.
Budgeted expenses for services to the Treasury, which are fully reimbursable, are increasing primarily to support the expansion of the TWAI ($15.3 million), and as a result of the Treasury fiscal agent consolidation ($8.2 million). Additional growth budgeted in 2015 related to application development and technology modernization for several Treasury initiatives is partially offset by anticipated operational efficiencies due to decreased processing volumes.
In the monetary policy and public programs areas, several Reserve Banks are adding resources to meet policy, research, and outreach demands, including investments in analytical and assessment capacity.
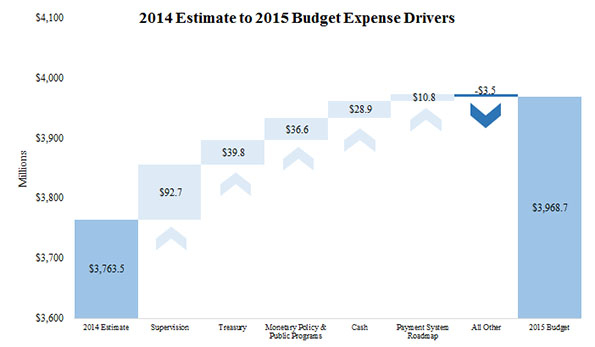
Increases in cash expenses include the completion of development work and the start of quality assurance testing for the CashForward project. In addition, support costs are projected to increase for law enforcement and video surveillance systems (VSS).
Pending Board approval, the Federal Reserve System, which has conducted careful study and received extensive public input on the topic, plans to pursue and to fund a set of strategies to improve the payment system in the United States.7
Other expenses are expected to decline because of the disposition of the FedACH Technology Transition program asset in 2014, partially offset by increases for the Fedwire modernization program.8
2015 Personnel Expenses and Staffing
Total 2015 budgeted employment for the Reserve Banks, FRIT, and OEB is 19,295 ANP, an increase of 468 ANP, or 2.5 percent, from 2014 estimated staff levels. The increase is primarily driven by supervision, Treasury, and information technology (IT) functions. Supervision ANP is increasing as resources are added to support expanded supervisory responsibilities, primarily for large financial institutions. In the Treasury function, personnel are added for planning and knowledge transfer as part of the fiscal agent consolidation and for ongoing projects
IT staff is increasing to support application development projects primarily for the Supervision and Treasury functions, offset by a reduction in development work for the CashForward project. Additional IT increases are for information security efforts. Staff is also increasing to support monetary policy and public programs, for the Fedwire modernization program, and for other support areas across the System.
Table 3
Significant Staffing (ANP) Changes
2014 Estimate to 2015 Budget
| 2014 Estimate | 18,827 |
| Supervision | 129 |
| Treasury | 111 |
| Information Technology | 81 |
| Monetary Policy & Public Programs | 50 |
| Cash | 49 |
| Other | 48 |
| 2015 Budget | 19,295 |
Reserve Bank officer and staff salaries and other personnel expenses for 2015 total $2,259.7 million, an increase of $124.9 million, or 5.9 percent, from 2014 estimated expenses. The increase reflects expenses associated with additional staff and budgeted salary adjustments, including merit increases, equity adjustments, promotions, and funding for variable pay.
The 2015 Reserve Bank budgets reflect a 3.0 percent merit program for eligible officers, senior professionals, and staff totaling $53.1 million. Equity adjustments and promotions total $8.5 million for officers and senior professionals and $22.8 million for staff. Funding for variable pay programs for officers, senior professionals, and staff totals $170.7 million.
2015 Operating expenses, net of revenue and reimbursements
More than 26 percent of Reserve Bank expenses in the 2015 budget are offset by either priced service revenues (10.4 percent) or reimbursable claims for services provided to the Treasury and other agencies (15.8 percent).9 Budgeted 2015 operating expenses, net of revenue and reimbursements, are expected to increase $167.8 million, or 6.1 percent, from 2014 estimated expenses. Budgeted 2014 priced services revenue is 3.6 percent lower than the 2014 estimated level, driven largely by continued declines in check volume as customers shift to other payment methods. Reimbursable claims are expected to increase 9.2 percent in 2015, reflecting increased activity on new or expanded Treasury services.
Table 4
Change in Net Expenses
(dollars in millions)
|
2014 Budget |
2014 Estimate |
2015 Budget |
Percent Change | ||
|---|---|---|---|---|---|
| 14B vs. 14E | 14E vs. 15B | ||||
| Total Expense | $3,795.7 | $3,763.5 | $3,968.7 | -0.8% | 5.5% |
| Less: | |||||
| Priced Services Revenue* | 423.6 | 429.9 | 414.4 | 1.5% | -3.6% |
| Reimbursable Claims | 569.1 | 573.1 | 626.1 | 0.7% | 9.2% |
| Net Expenses | $2,803.0 | $2,760.4 | $2,928.2 | -1.5% | 6.1% |
| * Full cost recovery is projected in the aggregate for priced services in 2014. Return to table. | |||||
2015 Capital Budgets
The 2015 capital budgets submitted by the Reserve Banks, FRIT, and OEB total $454.0 million. The increase in the 2015 capital budget is $44.6 million, or 10.9 percent, above the 2014 estimated levels of $409.4 million, largely reflecting ongoing multiyear building and infrastructure and automation projects. New initiatives in the 2015 capital budget support workplace renovations and optimization projects, conference facilities, and expanded infrastructure for the TWAI ($35.6 million). In support of the Reserve Bank strategies, the 2015 budgets include three major categories of capital initiatives: Reserve Bank automation/IT projects, building and infrastructure, and Treasury initiatives.
Automation/IT
The Reserve Banks, FRIT, and OEB included $193.0 million in funding for major IT initiatives and Reserve Bank automation projects. About 25 percent of the automation capital outlays, or $50.1 million, supports the System's computing and network infrastructure. Multiyear projects currently under way to migrate major applications off the mainframe account for $19.1 million of the 2015 capital budget.10 Cash automation initiatives include $39.3 million for the CashForward project and $5.1 million for cash sensor upgrades. Investments in analytical, technological, and operational tools are proposed for monetary policy ($11.2 million) and to support new and ongoing supervisory responsibilities ($7.1 million). Other automation investments include enhanced functionality for applications that support the Federal Reserve financial services, information security projects, and scheduled software and equipment upgrades.
Building and infrastructure
Building and infrastructure projects account for $183.2 million of the proposed capital budget. Renovations to reconfigure and optimize existing building space are proposed for the Federal Reserve Banks of New York ($30.9 million), Cleveland ($4.4 million), Richmond ($3.0 million), Kansas City ($2.7 million), and Chicago ($2.5 million). The Federal Reserve Bank of Kansas City will build an addition to its parking garage to accommodate staffing growth ($8.5 million). The Federal Reserve Banks of Dallas ($6.0 million) and San Francisco ($5.4 million) will continue their space renovation programs, the Federal Reserve Bank of Chicago continues its building security project ($2.3 million) and cash reconfiguration project ($3.2 million), while the Federal Reserve Bank of Cleveland plans to invest in conference facilities ($3.5 million). The remaining outlays in this category fund many other ongoing safety and maintenance needs and other facility improvements.
Treasury
The capital budgets include $77.8 million for Treasury initiatives, including additional space to accommodate staff at the Federal Reserve Bank of St. Louis for expanded Treasury operations ($8.1 million), support for TWAI ($40.9 million), and application development efforts supporting multiple projects.
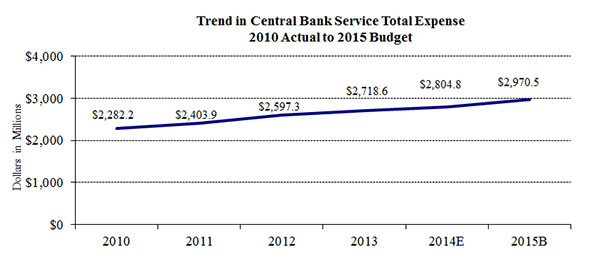
Five-year trend in Reserve Bank expenses
Total expenses for the Reserve Banks have grown an average of 4.5 percent annually from 2010 through the 2015 budget.
Table 5
Total Expenses of the Federal Reserve Banks, by Functional Area
(dollars in millions)
|
2010 Actual |
2011 Actual |
2012 Actual |
2013 Actual |
2014 Estimate |
2015 Budget |
CAGR 2010-2015 |
|
|---|---|---|---|---|---|---|---|
| Monetary and Economic Policy | $497.7 | $532.3 | $563.3 | $596.5 | $607.3 | $636.8 | 5.1% |
| Services to U.S. Treasury and Gov't Agencies | 433.4 | 459.1 | 477.3 | 500.5 | 540.1 | 579.9 | 6.0% |
| Services to Financial Institutions and the Public | 982.6 | 954.1 | 977.5 | 1,003.4 | 1,030.1 | 1,073.6 | 1.8% |
| Supervision | 801.9 | 917.4 | 1,056.6 | 1,118.8 | 1,167.5 | 1,260.2 | 9.5% |
| Fee Based Services to Financial Institutions | 467.4 | 398.3 | 387.5 | 372.4 | 418.5 | 418.2 | -2.2% |
| Total | $3,183.0 | $3,261.3 | $3,462.1 | $3,591.6 | $3,763.5 | $3,968.7 | 4.5% |
Trends in central bank services total expense
Expenses for central bank functions have grown an average of 5.4 percent annually over the past five years. Supervision is driving a large portion of this expense increase, with an average of 9.5 percent expense growth per year over the past five years and a corresponding increase of 968 ANP since 2010. The additional resources and staffing were added over this period in response to the financial crisis and to implement the Dodd-Frank Act requirements. More recently, continued implementation of expanded supervisory responsibilities mandated by the Dodd-Frank Act and growth in the number of supervised state member banks has resulted in additional resource demands. Forecasted resource growth in supervision expense beyond 2015 is expected to moderate and remain fairly stable going forward, as the number of problem institutions are projected to stabilize.
Monetary policy expenses have grown on average 5.1 percent annually. This growth is largely driven by increases at the Federal Reserve Bank of New York. Rapid growth during the financial crisis has been followed by a focus on improving operational agility and restructuring analytical, technological, and operational activities to address the increased needs and responsibilities for financial stability monitoring. Growth in monetary policy expenses also reflects increases resources dedicated to regional economic research.
Expenses in the cash area have increased on average 2.6 percent annually, as a multiyear effort to modernize the cash processing and inventory-tracking infrastructure nears completion. These increases have been partially offset by efficiency improvements in cash operations.
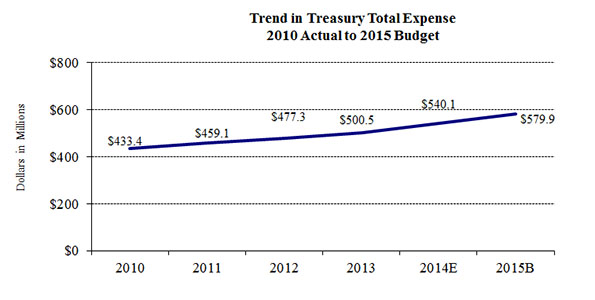
Trends in Treasury services expense
Treasury services expenses have grown on average 6.0 percent annually since 2010. Expenses have increased to meet Treasury's evolving needs, including the automation of Treasury's collection and payment services, the addition of Treasury applications to the TWAI, and other requested projects. A portion of the growth has been offset by staffing reductions and program changes initiated by the Treasury, including the Treasury Retail Securities consolidation effort.
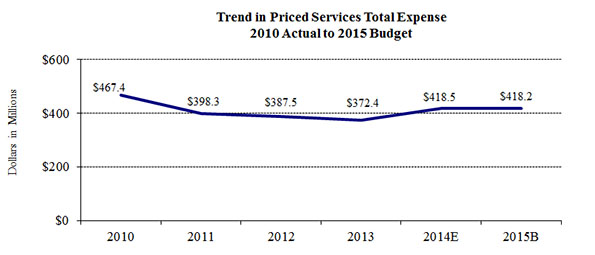
Trends in priced services total expense
Priced services expenses have decreased at an average of 2.2 percent annually. With the continued decline of paper-check volume and the efficiencies associated with electronic check processing, check service expenses have declined an average of 12.5 percent annually since 2010. These declines have been slightly offset by increases for Fedwire and FedLine modernization programs and enhancements in addition to the disposition of the FedACH Technology Transition program asset.
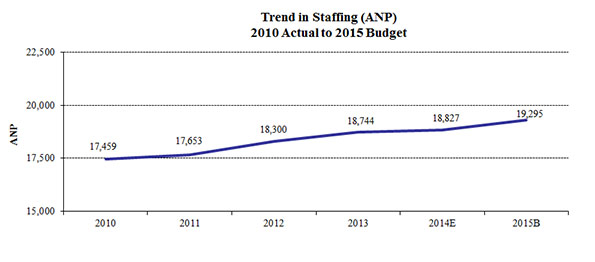
Trends in staffing
Total staffing levels are increasing at an average of 2.0 percent annually since 2010. The primary driver is in supervision to address both Dodd-Frank Act implementation and portfolio growth. IT is also a driver of increased staffing to support information security efforts and large application development projects. Monetary policy areas have grown modestly to support financial stability monitoring and operational activities. These increases are offset, in part, by decreased staffing in priced services functions.
Risks in the 2015 budget
The most significant risks in the 2015 budget are related to personnel. Changes in benefit assumptions related to the discount rate and updated demographic information would affect Reserve Bank budgets. Additionally, Banks are concerned about their ability to hire and retain staff. A number of Reserve Banks have aggressive hiring plans, and some Banks may experience difficulty meeting schedules for hiring staff with specialized skills and experience, particularly in supervision and IT. The primary risks in supervision relate to the implementation of key supervisory responsibilities under the Dodd-Frank Act that still require final rulemaking and changing supervisory programs. The Treasury's fiscal agent consolidation effort will continue to affect projects over a longer term planning horizon as the future vision for collections, payments, and cash management systems is refined.
Appendix
Statistical Supplement
| Table A | Total Expenses of the Federal Reserve Banks, by District |
| Table B | Total Employment of the Federal Reserve Banks, by District |
| Table C | Total Employment of the Federal Reserve Banks, by Functional Area |
| Table D | Budgeted Changes to the Cash Compensation Components of the Federal Reserve Banks, Officers and Staff, by District |
| Table E | Capital Outlays of the Federal Reserve Banks, by District |
Notes:
In the following tables, Reserve Bank expenses include those budgeted by FRIT and OEB that are chargeable to the Reserve Banks.
Components may not add to totals because of rounding. Table-to-table comparisons may also differ due to rounding.
Table A
Total Expenses of the Federal Reserve Banks
by District, 2014 and 2015
(dollars in thousands)
| District |
2014 Budget |
2014 Estimate |
2015 Budget |
Percent change | ||
|---|---|---|---|---|---|---|
| 14B vs. 14E | 14E vs. 15B | 14B vs. 15B | ||||
| Boston | 220,134 | 222,812 | 231,598 | 1.2% | 3.9% | 5.2% |
| New York | 908,868 | 888,762 | 938,292 | -2.2% | 5.6% | 3.2% |
| Philadelphia | 202,612 | 198,009 | 200,805 | -2.3% | 1.4% | -0.9% |
| Cleveland | 176,213 | 163,660 | 173,463 | -7.1% | 6.0% | -1.6% |
| Richmond | 360,955 | 359,257 | 359,688 | -0.5% | 0.1% | -0.4% |
| Atlanta | 318,983 | 342,425 | 323,023 | 7.3% | -5.7% | 1.3% |
| Chicago | 340,698 | 337,355 | 356,634 | -1.0% | 5.7% | 4.7% |
| St. Louis | 285,778 | 288,837 | 335,373 | 1.1% | 16.1% | 17.4% |
| Minneapolis | 199,831 | 192,996 | 214,535 | -3.4% | 11.2% | 7.4% |
| Kansas City | 222,383 | 219,960 | 255,317 | -1.1% | 16.1% | 14.8% |
| Dallas | 212,245 | 212,206 | 223,263 | 0.0% | 5.2% | 5.2% |
| San Francisco | 346,958 | 337,181 | 356,686 | -2.8% | 5.8% | 2.8% |
| Total | 3,795,657 | 3,763,460 | 3,968,677 | -0.8% | 5.5% | 4.6% |
Return to statistical supplement index.
Table B
Total Employment of the Federal Reserve Banks
by District, 2014 and 2015
(average number of personnel)
| District |
2014 Budget |
2014 Estimate |
2015 Budget |
Change | ||
|---|---|---|---|---|---|---|
| 14B vs. 14E | 14E vs. 15B | 14B vs. 15B | ||||
| Boston | 1,097 | 1,072 | 1,109 | -25 | 37 | 12 |
| New York | 3,247 | 3,225 | 3,294 | -22 | 70 | 47 |
| Philadelphia | 946 | 942 | 921 | -4 | -21 | -25 |
| Cleveland | 968 | 946 | 990 | -22 | 43 | 21 |
| Richmond | 1,586 | 1,563 | 1,546 | -24 | -17 | -41 |
| Atlanta | 1,627 | 1,586 | 1,594 | -41 | 8 | -33 |
| Chicago | 1,512 | 1,502 | 1,529 | -10 | 27 | 18 |
| St. Louis | 1,145 | 1,146 | 1,246 | 1 | 100 | 101 |
| Minneapolis | 1,133 | 1,097 | 1,114 | -36 | 17 | -19 |
| Kansas City | 1,512 | 1,528 | 1,688 | 16 | 160 | 175 |
| Dallas | 1,217 | 1,243 | 1,267 | 25 | 25 | 50 |
| San Francisco | 1,671 | 1,667 | 1,700 | -4 | 33 | 29 |
| Subtotal | 17,662 | 17,516 | 17,998 | -146 | 482 | 336 |
| FRIT | 1,265 | 1,261 | 1,244 | -4 | -17 | -21 |
| OEB | 52 | 50 | 53 | -2 | 2 | 1 |
| Total | 18,979 | 18,827 | 19,295 | -152 | 468 | 316 |
Return to statistical supplement index
Table C
Total Employment of the Federal Reserve Banks1
by Functional Area
(average number of personnel)
| 2010 | 2011 | 2012 | 2013 | 2014E | 2015B |
CAGR 2010-2015 |
|
|---|---|---|---|---|---|---|---|
| Monetary and Economic Policy | 1,115 | 1,179 | 1,223 | 1,237 | 1,250 | 1,284 | 2.9% |
| Services to U.S. Treasury and Gov't Agencies | 1,092 | 1,114 | 1,071 | 1,138 | 1,067 | 1,178 | 1.5% |
| Services to Financial Institutions and the Public | 2,828 | 2,719 | 2,659 | 2,670 | 2,659 | 2,694 | -1.0% |
| Supervision | 3,052 | 3,339 | 3,725 | 3,860 | 3,891 | 4,020 | 5.7% |
| Fee Based Services to Financial Institutions | 1,147 | 910 | 840 | 717 | 688 | 710 | -9.2% |
| Local Support and Overhead | 6,379 | 6,303 | 6,457 | 6,635 | 6,723 | 6,791 | 1.3% |
| Nationally Provided Support | 972 | 1,084 | 1,274 | 1,305 | 1,336 | 1,331 | 6.5% |
| Centralized Service Providers | 873 | 1,003 | 1,051 | 1,182 | 1,214 | 1,287 | 8.1% |
| Total | 17,459 | 17,653 | 18,300 | 18,744 | 18,827 | 19,295 | 2.0% |
|
1. Includes average number of personnel (ANP) at FRIT and OEB. Return to table. Nationally Provided Support: Support services performed on behalf of multiple Districts under a regionalized or centralized function. In this table, select nationally provided support ANP have been included in the associated functional areas. The table has been recategorized from previous years for consistency in reporting. Centralized Service Providers: Support services provided by FRIT and OEB. |
|||||||
Return to statistical supplement index
Table D
Budgeted Changes to Cash Compensation Programs of the Federal Reserve Banks
Officers and Staff by District, 2015
(dollars in thousands)
| District |
Total 12/31/14 estimated salary liability (a) |
Additions to salary base |
Incremental variable pay (e) |
Total | ||||
|---|---|---|---|---|---|---|---|---|
|
Merit (b) |
Equity & market adjustments (c) |
Promotions and reclasses (d) |
Percentage increase to total 12/31/14 salary liability (b+c+d) / (a) |
Dollars (b+c+d+e) |
Percentage increase to total 12/31/14 salary liability (b+c+d+e)/(a) |
|||
| Boston | 114,054 | 3,422 | 875 | 906 | 4.6% | 650 | 5,853 | 5.1% |
| New York | 420,535 | 12,616 | 2,763 | 6,912 | 5.3% | 3,373 | 25,664 | 6.1% |
| Philadelphia | 82,278 | 2,468 | 634 | 823 | 4.8% | 58 | 3,983 | 4.8% |
| Cleveland | 82,009 | 2,463 | 735 | 844 | 4.9% | 685 | 4,727 | 5.8% |
| Richmond | 136,579 | 4,020 | 986 | 600 | 4.1% | 911 | 6,516 | 4.8% |
| Atlanta | 137,252 | 3,283 | 524 | 975 | 3.5% | 579 | 5,362 | 3.9% |
| Chicago | 152,145 | 4,542 | 892 | 884 | 4.2% | 1,129 | 7,447 | 4.9% |
| St. Louis | 99,938 | 3,020 | 621 | 994 | 4.6% | 1,336 | 5,970 | 6.0% |
| Minneapolis | 90,403 | 2,712 | 649 | 452 | 4.2% | 658 | 4,472 | 4.9% |
| Kansas City | 119,692 | 3,591 | 870 | 1,484 | 5.0% | 1,517 | 7,462 | 6.2% |
| Dallas | 100,231 | 2,187 | 838 | 1,002 | 4.0% | 468 | 4,495 | 4.5% |
| San Francisco | 179,560 | 5,314 | 956 | 1,747 | 4.5% | 1,227 | 9,246 | 5.1% |
| FRIT | 133,800 | 3,270 | 877 | 1,319 | 4.1% | 725 | 6,190 | 4.6% |
| OEB | 7,445 | 223 | 53 | 43 | 4.3% | 15 | 334 | 4.5% |
| Total | 1,855,922 | 53,131 | 12,273 | 18,985 | 4.5% | 13,331 | 97,720 | 5.3% |
|
The table above shows the cash compensation components that add to base salary (merit, equity, and promotion) and the 2015 incremental increase in variable pay expense compared to those estimated for 2014. December 31, 2014 Salary Liability: the annualized salary expense based on the salaries in effect on December 31. Merit: the amount of 2015 budgeted salary expense that reflects the cumulative effect of planned salary increases based on performance. Equity Adjustments: the amount of 2015 budgeted salary expense to bring individual salaries to the minimum of a grade range or to better align salaries based on internal or external compensation pressures. Promotions: the amount of 2015 budgeted salary expense that reflects salary increases for individuals as a result of promotions resulting from a significant increase in job responsibilities. Variable Pay: The change in 2015 budgeted incentive payments (payment for the achievement of predetermined goals) and cash awards (awards in recognition of exceptional achievements) compared to the 2014 estimate. |
||||||||
Table E
Capital Outlays of the Federal Reserve Banks
by District, 2014 and 2015
(dollars in thousands)
| District |
2014 Budget |
2014 Estimate |
2015 Budget |
Percent change | ||
|---|---|---|---|---|---|---|
| 14B vs. 14E | 14E vs. 15B | 14B vs. 15B | ||||
| Boston | 41,926 | 36,640 | 28,506 | -12.6% | -22.2% | -32.0% |
| New York | 114,967 | 88,461 | 115,869 | -23.1% | 31.0% | 0.8% |
| Philadelphia | 21,191 | 18,404 | 20,521 | -13.2% | 11.5% | -3.2% |
| Cleveland | 22,010 | 17,273 | 16,997 | -21.5% | -1.6% | -22.8% |
| Richmond | 15,705 | 15,573 | 15,204 | -0.8% | -2.4% | -3.2% |
| Atlanta | 16,724 | 31,270 | 16,137 | 87.0% | -48.4% | -3.5% |
| Chicago | 38,126 | 26,979 | 26,522 | -29.2% | -1.7% | -30.4% |
| St. Louis | 13,527 | 10,410 | 14,324 | -23.0% | 37.6% | 5.9% |
| Minneapolis | 13,534 | 6,584 | 4,657 | -51.4% | -29.3% | -65.6% |
| Kansas City | 15,595 | 15,833 | 25,811 | 1.5% | 63.0% | 65.5% |
| Dallas | 18,088 | 14,379 | 17,340 | -20.5% | 20.6% | -4.1% |
| San Francisco | 65,093 | 56,325 | 60,463 | -13.5% | 7.3% | -7.1% |
| Subtotal | 396,486 | 338,129 | 362,351 | -14.7% | 7.2% | -8.6% |
| FRIT | 78,449 | 71,112 | 91,086 | -9.4% | 28.1% | 16.1% |
| OEB | 469 | 179 | 550 | -61.8% | 207.2% | 17.3% |
| Total | 475,404 | 409,421 | 453,986 | -13.9% | 10.9% | -4.5% |
Return to statistical supplement index
Footnotes
1. These expenses include those budgeted by Federal Reserve Information Technology and the Office of Employee Benefits that are chargeable to the Reserve Banks. Expenses exclude assessments for the Board of Governors operating expenses, pension costs, the cost of currency, and the Consumer Financial Protection Bureau. Return to text.
2. Generally, strategic capital initiatives are initiatives that substantially affect or influence future System direction, significant research and development efforts or building projects, and certain large-dollar initiatives. Sensitive acquisitions are capital commitments, while important to meeting the Reserve Banks operating needs, represent exceptions to the Bank's strategic plans. Return to text.
3. ANP is the average number of employees in terms of full-time positions for the period. For instance, a full-time employee who works one-half of the year counts as 0.5 ANP for that calendar year; two half-time employees who work the full year count as 1 ANP. Return to text.
4. The CashForward initiative will replace legacy software applications, automate business processes, and employ technologies to meet current and future needs for the cash function. Phase 1 was completed in 2010 and Phase 2 was completed in July 2012. The project's planned completion date is in 2017. Return to text.
5. In April 2014, the Treasury announced the consolidation of the fiscal agent services provided by the Federal Reserve Banks as part of the Federal Government's effort to increase operational efficiency and effectiveness. Although Treasury anticipates long-term savings, an expense increase is projected for 2014 and 2015 as services are transitioned from ten sites to four consolidated sites over the next several years. Select business lines began transitioning in 2014, and increased expenses are primarily for severance and retention payments in exiting Banks. Return to text.
6. The Reserve Banks have been engaged in a multiyear technology initiative to modernize the FedACH processing platform by migrating the service from a mainframe system to a distributed computing environment. In late 2013, the Reserve Banks conducted an assessment focused on the viability and cost-effectiveness of the program. As a result, the Reserve Banks suspended the program in 2014 and began to investigate the use of other technology solutions. Return to text.
7. Among other things, the System's payment strategies call for a new U.S. payment infrastructure to support a safer, faster payment capability that promotes efficient commerce, facilitates innovation, reduces fraud, and improves public confidence; and accelerated development and adoption of enhanced payment security standards. Return to text.
8. The Fedwire Modernization initiative involves the transition of the Fedwire Funds and Fedwire Securities applications from the legacy mainframe environment to a distributed platform. Return to text.
9. Reimbursable claims include the expenses of fiscal agency and depository services provided to the U.S. Treasury, other government agencies, and other fiscal principals. Reimbursable claims are slightly higher than Treasury service expenses shown in table 1 because the reimbursable claims also include expenses associated with the government's use of the Reserve Banks' check, ACH, Fedwire Funds, and Fedwire Securities services; these expenses are included in priced services expense in table 1. Return to text.
10. The Reserve Bank migration strategy involves moving a majority of applications from the mainframe to alternate processing environments. 2015 budgeted projects include the migration of the Fedwire Securities and statistics and reserves (STAR) applications. A decision for the future of the ACH processing platform is planned for third-quarter 2015. Return to text.
