 Print
Print
Minutes of the Federal Open Market Committee
October 28-29, 2008
| FOMC Minutes | Summary of Economic Projections |
In conjunction with the October 28-29, 2008 FOMC meeting, the members of the Board of Governors and the presidents of the Federal Reserve Banks, all of whom participate in deliberations of the FOMC, provided projections for economic growth, unemployment, and inflation in 2008, 2009, 2010, and 2011. Projections were based on information available through the conclusion of the meeting, on each participants assumptions regarding a range of factors likely to affect economic outcomes, and on his or her assessment of appropriate monetary policy. Appropriate monetary policy is defined as the future policy that, based on current information, is deemed most likely to foster outcomes for economic activity and inflation that best satisfy the participants interpretation of the Federal Reserves dual objectives of maximum employment and price stability.
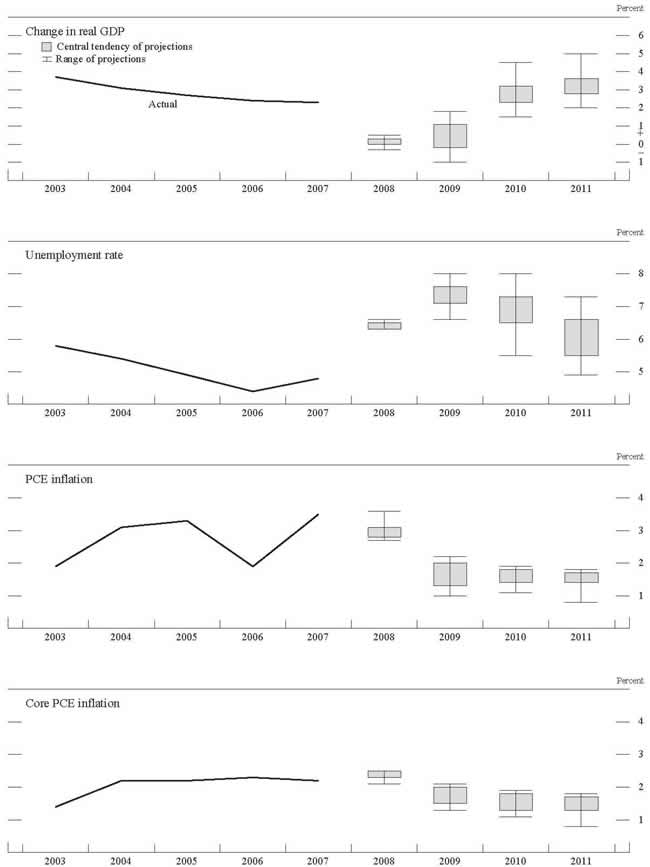
Given the recent intensification and broadening of the global financial crisis, FOMC participants viewed the outlook for economic growth and employment as having worsened significantly since June. As indicated in Table 1 and depicted in Figure 1, participants expected that real GDP growth would remain very weak next year and that the subsequent pace of recovery would be quite slow; they also anticipated that the unemployment rate would increase substantially further. In view of the recent sharp declines in the prices of energy and other commodities and the widening slack in resource utilization, participants expected that inflation would drop markedly in coming quarters. Participants generally judged that the degree of uncertainty surrounding their projections for both economic activity and inflation was greater than historical norms. Most participants viewed the risks to the growth outlook as skewed to the downside, and nearly all of them saw the risks to the inflation outlook as either balanced or tilted to the downside.
| Variable | 2008 | 2009 | 2010 | 2011 |
|---|---|---|---|---|
| Central tendency1 | ||||
| Change in real GDP | 0.0 to 0.3 | -0.2 to 1.1 | 2.3 to 3.2 | 2.8 to 3.6 |
| June projection | 1.0 to 1.6 | 2.0 to 2.8 | 2.5 to 3.0 | n/a |
| Unemployment rate | 6.3 to 6.5 | 7.1 to 7.6 | 6.5 to 7.3 | 5.5 to 6.6 |
| June projection | 5.5 to 5.7 | 5.3 to 5.8 | 5.0 to 5.6 | n/a |
| PCE inflation | 2.8 to 3.1 | 1.3 to 2.0 | 1.4 to 1.8 | 1.4 to 1.7 |
| June projection | 3.8 to 4.2 | 2.0 to 2.3 | 1.8 to 2.0 | n/a |
| Core PCE inflation | 2.3 to 2.5 | 1.5 to 2.0 | 1.3 to 1.8 | 1.3 to 1.7 |
| June projection | 2.2 to 2.4 | 2.0 to 2.2 | 1.8 to 2.0 | n/a |
| Range2 | ||||
| Change in real GDP | -0.3 to 0.5 | -1.0 to 1.8 | 1.5 to 4.5 | 2.0 to 5.0 |
| June projection | 0.9 to 1.8 | 1.9 to 3.0 | 2.0 to 3.5 | n/a |
| Unemployment rate | 6.3 to 6.6 | 6.6 to 8.0 | 5.5 to 8.0 | 4.9 to 7.3 |
| June projection | 5.5 to 5.8 | 5.2 to 6.1 | 5.0 to 5.8 | n/a |
| PCE inflation | 2.7 to 3.6 | 1.0 to 2.2 | 1.1 to 1.9 | 0.8 to 1.8 |
| June projection | 3.4 to 4.6 | 1.7 to 3.0 | 1.6 to 2.1 | n/a |
| Core PCE inflation | 2.1 to 2.5 | 1.3 to 2.1 | 1.1 to 1.9 | 0.8 to 1.8 |
| June projection | 2.0 to 2.5 | 1.8 to 2.3 | 1.5 to 2.0 | n/a |
Note: Projections of change in real gross domestic product (GDP) and of inflation are from the fourth quarter of the previous year to the fourth quarter of the year indicated. PCE inflation and core PCE inflation are the percentage rates of change in, respectively, the price index for personal consumption expenditures (PCE) and the price index for PCE excluding food and energy. Projections for the unemployment rate are for the average civilian unemployment rate in the fourth quarter of the year indicated. Each participant's projections are based on his or her assessment of appropriate monetary policy.
1. The central tendency excludes the three highest and three lowest projections for each variable in each year. Return to table
2. The range for a variable in a given year includes all participants' projections, from lowest to highest, for that variable in that year. Return to table
Figure 1: Central tendencies and ranges of economic projections, 2008-11 *
*Accessible version of figure 1 | Return to figure 1
The Outlook
Participants projections for real GDP growth in 2008 had a central tendency of 0 to 0.3 percent, compared with the central tendency of 1 to 1.6 percent for the growth projections that were made last June. The downward revisions in their growth forecasts for the year as a whole were due almost entirely to substantial shifts in their views of second-half growth. A number of participants noted that incoming data on consumer spending and employment had been weaker than expected during the summer, even prior to the intensification of the financial crisis. Many participants highlighted the recent decline in consumer confidence and the extent to which households were swiftly curbing their outlays in response to large losses in stock-market and housing wealth and deterioration in labor market conditions. Severe dislocations in credit markets were also seen as weighing heavily on consumer spending and business investment.Participants growth projections had a central tendency of -0.2 to 1.1 percent for 2009, 2.3 to 3.2 percent for 2010, and 2.8 to 3.6 percent for 2011, as most participants expected that the near-term weakness in economic activity would continue into next year and that the subsequent recovery would be relatively gradual. Growth in 2009 was likely to be restrained by persistent credit market strains and ongoing adjustments in the housing sector, as well as by weak fundamentals for household and business spending. Indeed, many participants anticipated that financial market stresses would recede only slowly, notwithstanding the extraordinary measures that had been taken to enhance liquidity and stabilize financial markets and institutions. Participants also noted that demand for exports was likely to be damped in coming quarters by the significantly weaker economic outlook for many U.S. trading partners. Participants expected that more robust economic expansion would resume in 2010, and most anticipated that growth would rise further in 2011 to a pace that would temporarily exceed its longer-run sustainable rate and hence would help reduce the degree of slack in resource utilization.
Participants anticipated that labor market conditions would continue to deteriorate over the coming year. Their projections for the unemployment rate during the fourth quarter of this year had a central tendency of 6.3 to 6.5 percent, an upward shift of more than 1/2 percentage point from their June projections and a further rise from Septembers unemployment rate of 6.1 percent--which was the latest available figure at the time of the FOMC meeting. Looking further ahead, the central tendency of participants unemployment rate projections was 7.1 to 7.6 percent for 2009, 6.5 to 7.3 percent for 2010, and 5.5 to 6.6 percent for 2011. Most participants judged that the unemployment rate in 2011 would still be above its longer-run sustainable level and hence would be likely to decline further in the period beyond the forecast horizon.
The central tendency of participants projections for total PCE inflation in 2008 declined to 2.8 to 3.1 percent, about a percentage point lower than the central tendency of their projections last June. Participants noted that this downward revision in the near-term inflation outlook mainly reflected the recent sharp decline in the prices of energy and other commodities, apparently triggered by the global slowdown in economic activity. Most participants also marked down their forecasts for inflation beyond 2008, reflecting their expectations of widening resource slack over coming quarters as well as gradual pass-through of the drop in the prices of energy and raw materials. The central tendency of participants projections for total PCE inflation was 1.3 to 2 percent for 2009, 1.4 to 1.8 percent for 2010, and 1.4 to 1.7 percent for 2011. Participants generally projected that inflation at the end of the projection period would be close to or a bit below their assessments of the measured rates of inflation consistent with the Federal Reserves dual mandate for promoting price stability and maximum employment.
Risks to the Outlook
Participants continued to view uncertainty about the outlook for economic activity as higher than normal.1 The risks to their projections for GDP growth were judged as being skewed to the downside and the associated risks to their projections for the unemployment rate were tilted to the upside. Participants emphasized the considerable degree of uncertainty about the future course of the financial crisis and its impact on the real economy. Previous episodes of financial market turmoil might not provide much information about the likely trajectory going forward, given the severity of the current crisis and the extraordinary government measures that had been taken. Several participants highlighted the risk of a persistent negative feedback loop between credit markets and economic activity, while others referred to the possibility that financial market functioning might normalize more rapidly and hence that the adverse effects of the crisis might be somewhat smaller than anticipated in their modal outlook. Some participants noted that further monetary policy easing could eventually become constrained by the lower bound of zero on nominal interest rates, in which case an elevated degree of uncertainty might be associated with gauging the magnitude and stimulative effects of other policy tools such as quantitative easing.| Variable | 2008 | 2009 | 2010 | 2011 |
|---|---|---|---|---|
| Change in real GDP1 | ±0.6 | ±1.3 | ±1.4 | ±1.4 |
| Unemployment rate1 | ±0.2 | ±0.6 | ±0.9 | ±1.0 |
| Total consumer prices2 | ±0.3 | ±1.0 | ±1.0 | ±1.0 |
Note: Error ranges shown are measured as plus or minus the root mean squared error of projections that were released in the autumn from 1987 through 2007 for the current and following three years by various private and government forecasters. As described in the box "Forecast Uncertainty," under certain assumptions, there is about a 70 percent probability that actual outcomes for real GDP, unemployment, and consumer prices will be in ranges implied by the average size of projection errors made in the past. Further information is in David Reifschneider and Peter Tulip (2007), "Gauging the Uncertainty of the Economic Outlook from Historical Forecasting Errors," Finance and Economics Discussion Series 2007-60 (Board of Governors of the Federal Reserve System, November).
1. For definitions, refer to general note in table 1. Return to table
2. Measure is the overall consumer price index, the price measure that has been most widely used in government and private economic forecasts. Projection is percent change, fourth quarter of the previous year to the fourth quarter of the year indicated. Return to table
As in June, most participants continued to view the uncertainty surrounding their inflation projections as higher than historical norms. The majority of participants judged the risks to the inflation outlook as roughly balanced, and a number of others viewed these risks as skewed to the downside--a marked shift from June, when the risks to inflation were generally seen as tilted to the upside. Many participants noted that their assessments regarding the downside risks to inflation were linked to their judgments regarding the magnitude of downside risks to economic activity. Some participants also noted that heightened volatility of prices for energy and other commodities was contributing to the elevated degree of uncertainty regarding the inflation outlook.
Diversity of Views
Figures 2.A and 2.B provide further detail on the diversity of participants views regarding likely outcomes for real GDP growth and the unemployment rate, respectively. For both variables, the dispersion of participants projections for 2008 was noticeably narrower than in the forecasts provided in June, mainly due to the accumulation of incoming data regarding the performance of the economy to date. In contrast, participants projections for 2009 and 2010 exhibited substantially greater dispersion than in June, mainly reflecting the diversity of views regarding the duration of the financial crisis and the magnitude and persistence of its impact on the real economy. The dispersion in participants projections was also affected to some degree by differences in their estimates of the longer-run rates of output growth and unemployment to which the economy would converge under appropriate policy and in the absence of any further shocks.
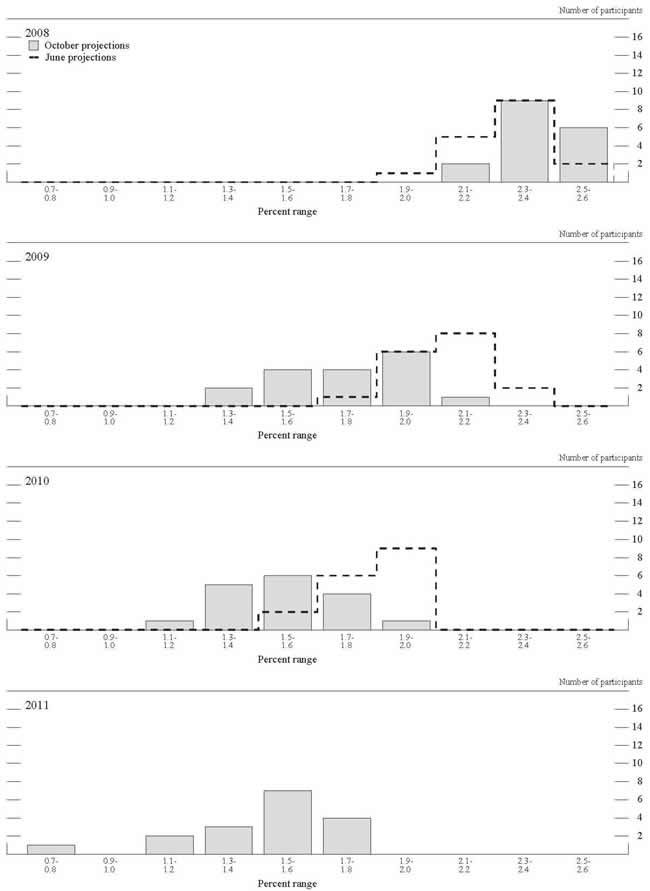
Figures 2.C and 2.D provide corresponding information regarding the diversity of participants views regarding the inflation outlook. The dispersion in participants projections for 2009 and 2010 was substantially greater than in June, primarily reflecting differences in their views about how much slack in resource utilization was likely to develop and about the extent to which that slack would place downward pressure on increases in wages and prices. Some participants indicated that their inflation projections for 2011 were roughly in line with their assessments of the measured rate of inflation consistent with the Federal Reserves dual mandate for promoting price stability and maximum employment; other participants anticipated that inflation in 2011 would be a bit below their assessments of the mandate-consistent inflation rate, mainly reflecting the lagged effects of weak economic activity and the relatively sluggish pace of recovery.
Figure 2.A. Distribution of participants projections for the change in real GDP, 2008-11*
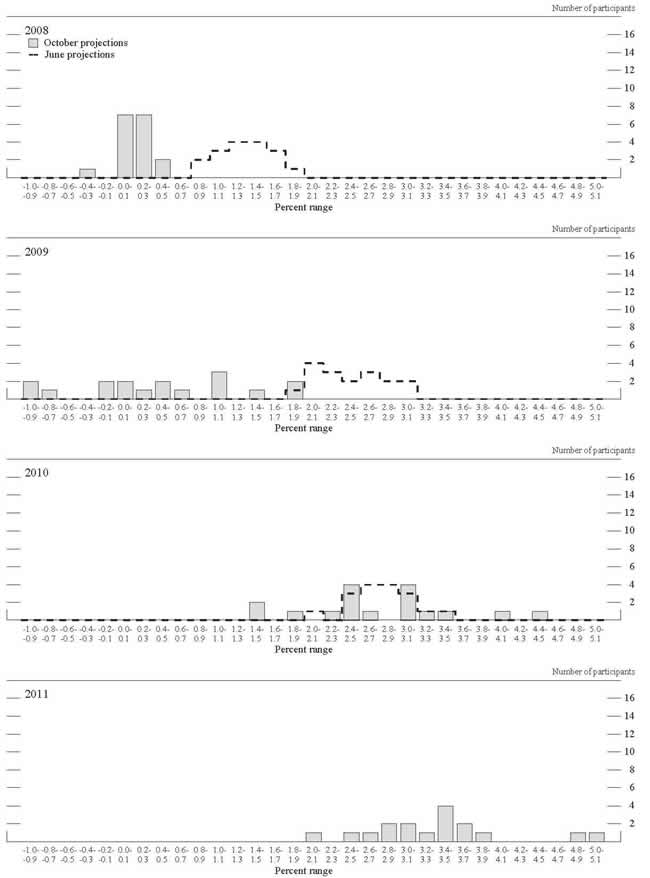
* Accessible version of figure 2(a) | Return to figure 2(a)
Figure 2.B. Distribution of participants projections for the unemployment rate, 2008-11*
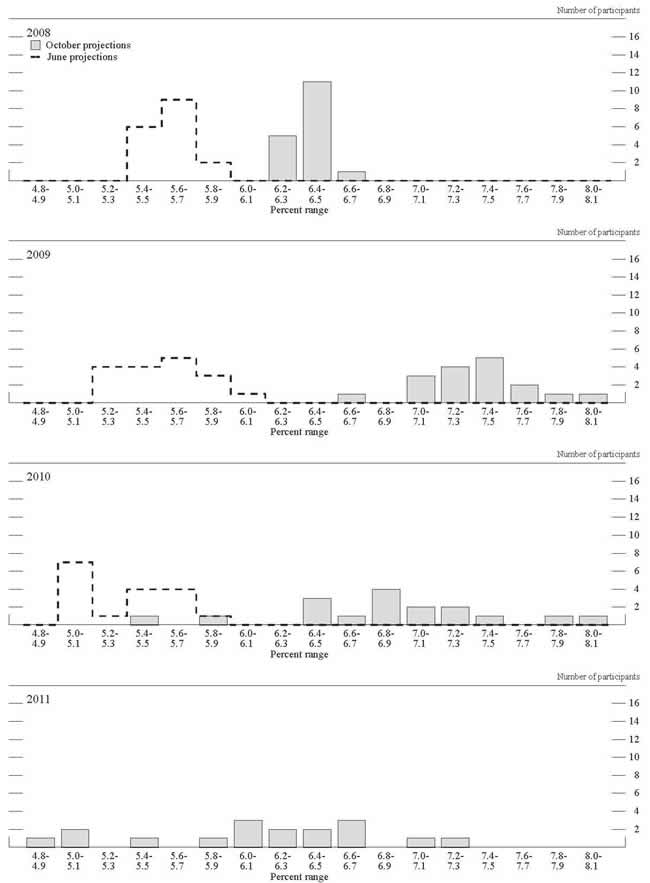
* Accessible version of figure 2(b) | Return to figure 2(b)
Figure 2.C. Distribution of participants projections for PCE inflation, 2008-11*
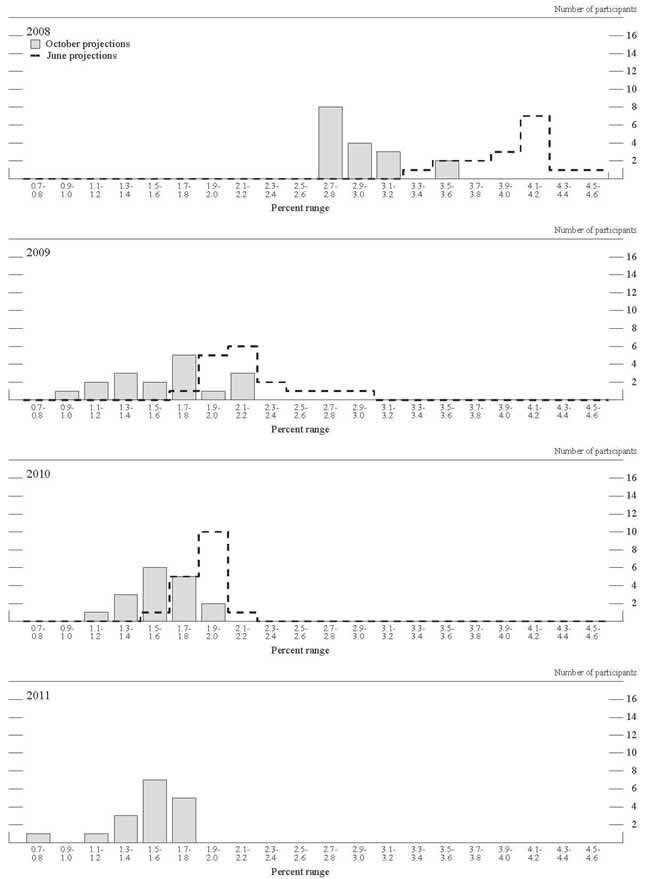
* Accessible version of figure 2(c) | Return to figure 2(c)
Figure 2.D. Distribution of participants projections for core PCE inflation, 2008-11*
* Accessible version of figure 2(d) | Return to figure 2(d)
Forecast Uncertainty
The economic projections provided by the members of the Board of Governors and the presidents of the Federal Reserve Banks inform discussions of monetary policy among policymakers and can aid public understanding of the basis for policy actions. Considerable uncertainty attends these projections, however. The economic and statistical models and relationships used to help produce economic forecasts are necessarily imperfect descriptions of the real world. And the future path of the economy can be affected by myriad unforeseen developments and events. Thus, in setting the stance of monetary policy, participants consider not only what appears to be the most likely economic outcome as embodied in their projections, but also the range of alternative possibilities, the likelihood of their occurring, and the potential costs to the economy should they occur.
Table 2 summarizes the average historical accuracy of a range of forecasts, including those reported in past Monetary Policy Reports and those prepared by Federal Reserve Board staff in advance of meetings of the Federal Open Market Committee. The projection error ranges shown in the table illustrate the considerable uncertainty associated with economic forecasts. For example, suppose a participant projects that real GDP and total consumer prices will rise steadily at annual rates of, respectively, 3 percent and 2 percent. If the uncertainty attending those projections is similar to that experienced in the past and the risks around the projections are broadly balanced, the numbers reported in table 2 would imply a probability of about 70 percent that actual GDP would expand between 2.4 percent to 3.6 percent in the current year, 1.7 percent to 4.3 percent in the second year, and 1.6 percent to 4.4 percent in the third and fourth years. The corresponding 70 percent confidence intervals for overall inflation would be 1.7 percent to 2.3 percent in the current year and 1.0 percent to 3.0 percent in the second, third, and fourth years.
Because current conditions may differ from those that prevailed on average over history, participants provide judgments as to whether the uncertainty attached to their projections of each variable is greater than, smaller than, or broadly similar to typical levels of forecast uncertainty in the past as shown in table 2. Participants also provide judgments as to whether the risks to their projections are weighted to the upside, downside, or are broadly balanced. That is, participants judge whether each variable is more likely to be above or below their projections of the most likely outcome. These judgments about the uncertainty and the risks attending each participants projections are distinct from the diversity of participants views about the most likely outcomes. Forecast uncertainty is concerned with the risks associated with a particular projection, rather than with divergences across a number of different projections.
Footnotes
1. Table 2 provides estimates of forecast uncertainty since 1987 for the change in real GDP, the unemployment rate, and total consumer price inflation. At the end of this summary, the box Forecast Uncertainty discusses the sources and interpretation of uncertainty in economic forecasts and explains the approach used to assess the uncertainty and risks attending participants projections. Return to text

