Availability of Credit to Small Businesses
September 2012
- Executive Summary
- Flows and Terms of Business Credit
- Credit Use by Small Businesses
Flows and Terms of Business Credit
Between 2007 and 2012, the years covered by this report, financial markets experienced extraordinary stresses. Conditions in financial markets began deteriorating in 2007 and worsened dramatically in the fall of 2008.8 As the financial crisis intensified, the U.S. economy entered a recession. The financial crisis and the recession negatively affected credit flows to businesses for several reasons, including tight lending conditions that restricted the supply of credit by financial institutions, reduced investment opportunities that depressed the demand for funds by businesses, and the deterioration of the financial health of potential borrowers. Since the recession ended in the second quarter of 2009, overall lending conditions and credit flows have improved for firms, but the improvement has been slower for small businesses.
Aggregate Business Financing
Nonfinancial business debt growth, which recorded double-digit percentage growth rates in 2006 and 2007, slowed sharply over 2008 and became negative in 2009 (figure 1, panel A).9 Debt growth rebounded slowly in 2010 and has picked up more significantly since then. As a result, the ratio of nonfinancial business debt to gross domestic product reached record levels in 2008 but has since drifted down (figure 1, panel B).
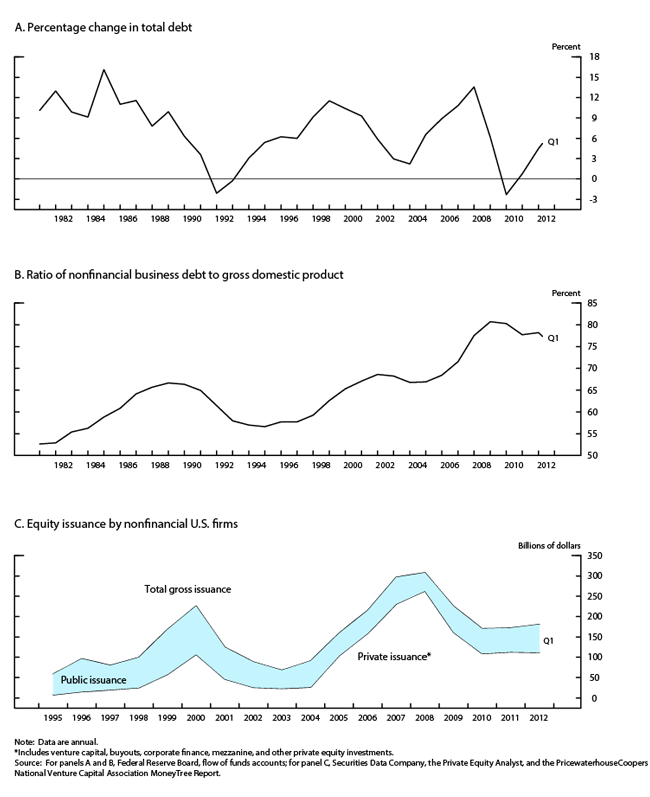
Gross equity issuance by nonfinancial firms has also fallen notably since 2007 (figure 1, panel C). Public equity issuance, through both initial and seasoned offerings, which had maintained a moderate pace by historical standards from 2002 to 2007, dropped in 2008 but rebounded to its pre-crisis levels in 2009. In contrast, private equity issuance, which had increased sharply in the years preceding the financial crisis, dropped in 2009 and 2010 and has since maintained a moderate pace. In 2006 and 2007, the rate of equity retirements through cash-financed mergers and share buybacks was booming, resulting in substantially negative net equity issuance. However, equity retirements plummeted in 2008 and especially 2009 before rebounding in 2010 and 2011. As a result, net equity issuance, which remained negative throughout the period, returned to deeply negative levels by the end of 2011.
Financing by Nonfinancial Corporations
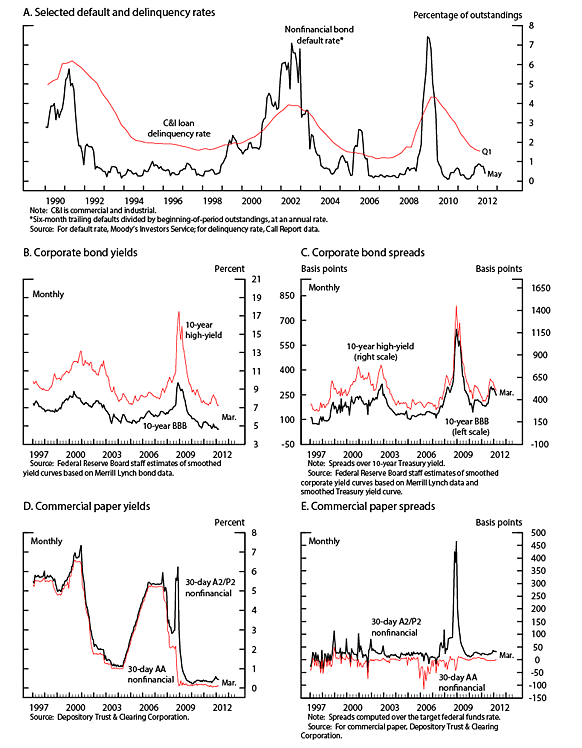
The financial crisis left a heavy imprint on the financing conditions for firms in public capital markets and at banks. Default rates on corporate bonds and on commercial and industrial (C&I) loans, which had fallen to near-historical lows in 2006 and 2007, rose sharply starting in late 2008 but retraced most of their increases after 2009 (figure 2, panel A). Yields on BBB-rated and high-yield corporate bonds soared during the height of the financial crisis in late 2008 and early 2009 but fell to almost record lows in the subsequent years (figure 2, panel B). The spreads of yields on corporate bonds to those on comparable-maturity Treasury securities also rose steeply during the height of the financial crisis but declined over 2009 and have since remained a bit above pre-recession levels (figure 2, panel C). Borrowing costs for shorter-term debt issued by nonfinancial firms also increased substantially during the financial crisis. In particular, rates on commercial paper issued by A2/P2-rated nonfinancial corporations increased sharply in 2008 but dropped in 2009 and have remained very low since then (figure 2, panel D). Similarly, the spreads of rates on A2/P2-rated commercial paper over the target federal funds rate moved up in 2007, skyrocketed in 2008, and retraced most of their increases in 2009 (figure 2, panel E).
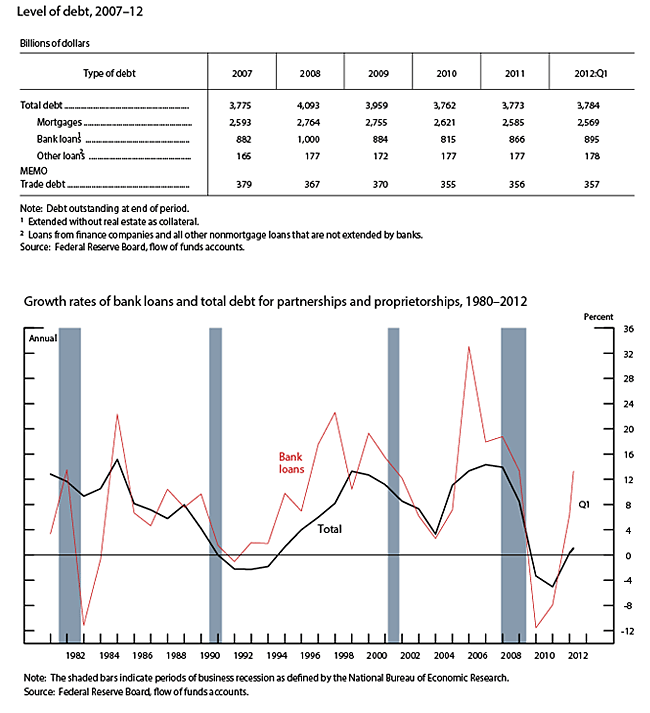
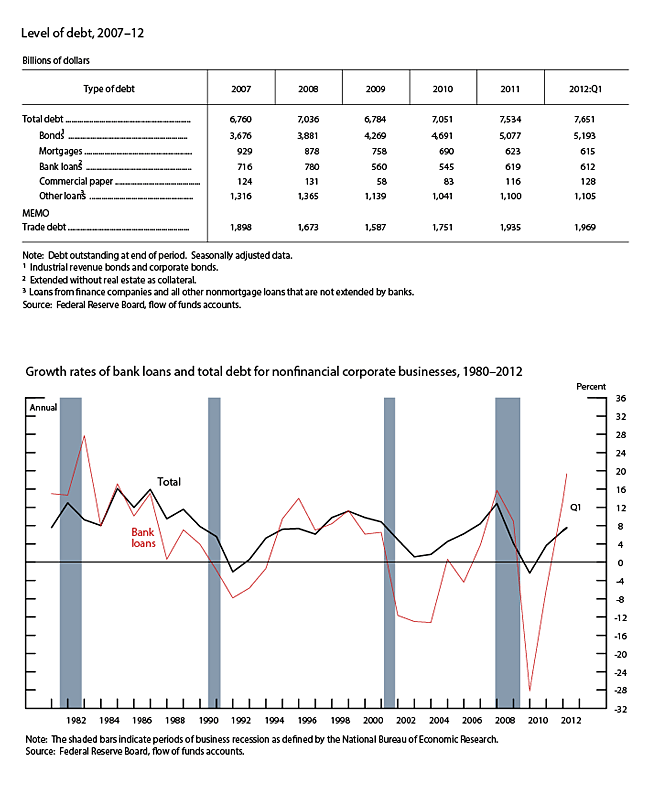
Nonfinancial corporate debt rose in 2007 and early 2008 and then contracted sharply during the height of the financial crisis, but it has expanded at a moderate pace since 2010 (figure 3). The pace of bond issuance by nonfinancial corporations, while still positive, declined sharply in the second half of 2008, but it picked up notably over the next two years, reflecting in part falling yields on corporate bonds. Commercial paper outstanding at nonfinancial firms dropped sharply in 2009 but rebounded over the next two years. In contrast, loans from banks contracted in 2009 and 2010 but have increased since then. As a result of tight lending standards and depressed real estate prices, commercial mortgage debt has declined steadily since 2007.
Financing by Small Businesses
Fully comprehensive data that directly measure the financing activities of small businesses do not exist. However, various sources of information can serve as proxies for small business activity and can be used to identify patterns of small business financing. These sources suggest that financing flows to small businesses weakened considerably as a result of the financial crisis and the recession, and that they have only partly recovered.
Total small business debt outstanding, estimated as the total debt of partnerships and proprietorships, increased in 2007 and for most of 2008, but it dropped from 2009 through the first half of 2011 (figure 4).10 Since then, small business debt has rebounded a bit, though at a moderate pace relative to other recent recessions. The two largest components of total small business debt are mortgage debt and loans not secured by real estate that are made by commercial banks. Bank loans extended without real estate collateral have followed a pattern similar to that of total partnerships and proprietorships debt, falling during the financial crisis but recovering somewhat in the second half of 2011. In contrast, mortgage debt has declined since 2009 as a result of the general weakness in real estate markets. Commercial bank loans (both with and without real estate collateral) with principal less than or equal to $1 million, which are often extended to small firms, have also shown declines through the first half of 2011 (table 1).
Table 1. Small business loan and microloan holdings of U.S. commercial banking organizations, by type of loan, 2007-11
| Size of loan and year | All | Commercial and industrial | Nonfarm nonresidential real estate | |
|---|---|---|---|---|
| Small business loans ($1 million or less) | ||||
| Amount outstanding, June 30 (billions of dollars) | ||||
| 2007 | 595.8 | 275.5 | 320.4 | |
| 2008 | 616.1 | 286.4 | 329.7 | |
| 2009 | 604.2 | 274.0 | 330.2 | |
| 2010 | 568.9 | 266.2 | 302.8 | |
| 2011 | 529.7 | 241.4 | 288.3 | |
| Change 1 (percent) | ||||
| 2008 | 3.4 | 4.0 | 2.9 | |
| 2009 | -1.9 | -4.3 | .2 | |
| 2010 | -5.8 | -2.9 | -8.3 | |
| 2011 | -6.9 | -9.3 | -4.8 | |
| Microloans ($100,000 or less) | ||||
| Amount outstanding, June 30 (billions of dollars) | ||||
| 2007 | 124.4 | 99.1 | 25.3 | |
| 2008 | 136.7 | 111.9 | 24.8 | |
| 2009 | 128.5 | 104.5 | 24.0 | |
| 2010 | 130.5 | 110.5 | 20.0 | |
| 2011 | 111.2 | 93.3 | 17.9 | |
| Change1 (percent) | ||||
| 2008 | 9.9 | 12.9 | -1.9 | |
| 2009 | -6.0 | -6.7 | -3.1 | |
| 2010 | 1.6 | 5.8 | -16.6 | |
| 2011 | -14.8 | -15.6 | -10.7 | |
Note: Small business loans are business loans of $1 million or less; microloans, a subset of small business loans, are for $100,000 or less. U.S. commercial banking organizations are insured U.S. domestically chartered banks excluding credit card institutions and U.S. branches and agencies of foreign banks. Details many not sum to totals because of rounding.
1. Change is measured from June of the preceding year to June of the year indicated. Return to table
Source: Call Reports (June 30), various years.
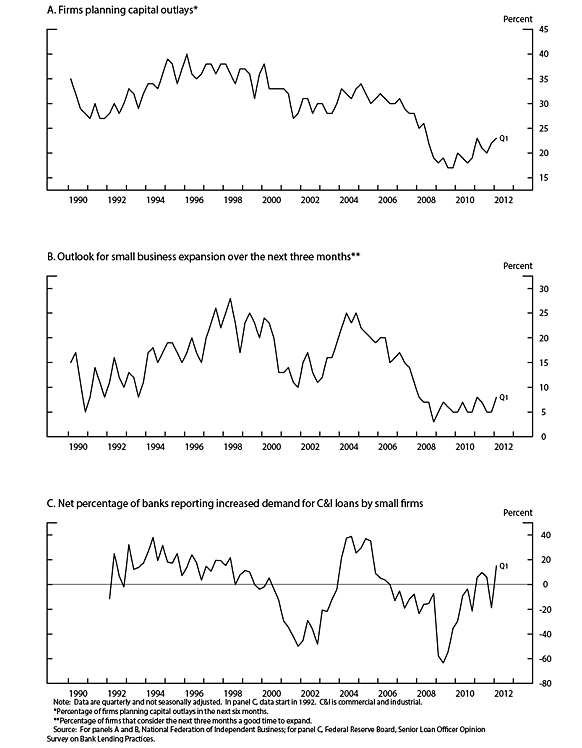
Indicators of small business financing needs suggest that demand for credit started to decline around 2006, plummeted in 2008, and has shown signs of recovery since 2010. The demand for small business financing can be inferred from small business investment plans as reported in surveys conducted by the National Federation of Independent Business (NFIB).11 According to the surveys, the net percentage of firms that planned capital outlays and the net percentage that anticipated business expansions were at about their historical averages in 2005 and 2006, plummeted to record lows during the financial crisis, and have increased only slightly in recent years (figure 5). Data on demand for C&I loans, as reported in the Federal Reserve Board's Senior Loan Officer Opinion Survey on Bank Lending Practices (SLOOS), show a similar decline during the financial crisis but suggest a somewhat stronger recovery after the recession.12
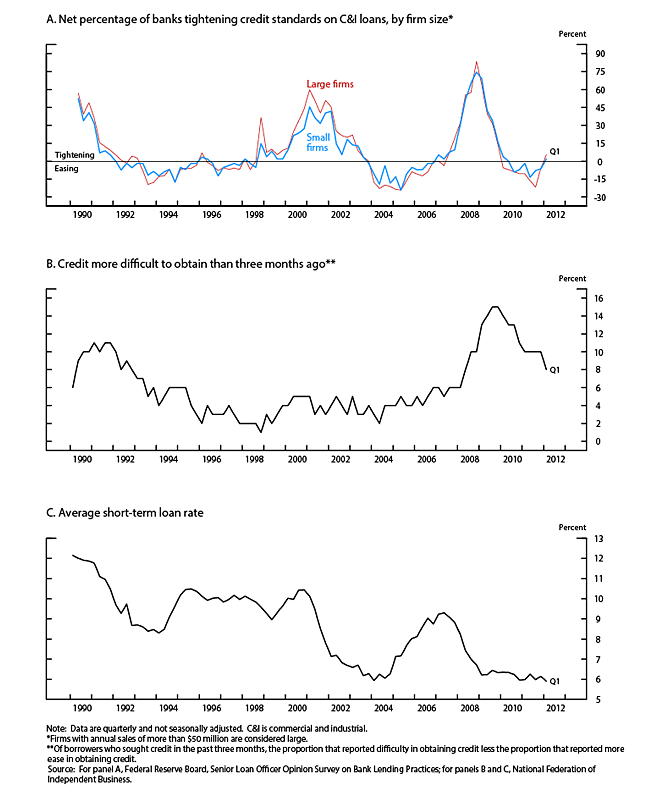
Credit conditions for small business lending by banks became substantially tighter during the financial crisis but have eased notably since 2010. Results from the SLOOS indicate that lending standards for small borrowers tightened substantially in 2008 and 2009 but loosened in 2010 and 2011 (figure 6). The net percentage of NFIB respondents reporting that credit had become more difficult to obtain, which had remained low by historical standards in the years prior to the financial crisis, rose in 2008 and reached its highest levels on record in 2009. Since then, it has retraced a good portion of its increases during the financial crisis, as the average short-term interest rate paid by NFIB respondents decreased from about 9 percent in 2007 to about 6 percent in the first quarter of 2012.13 Although credit conditions for small firms tightened notably during the financial crisis, responses to other questions in the NFIB survey suggest that small business owners have remained cautious. In particular, since 2008, respondents have appeared to remain more concerned about their outlook for sales than about credit conditions, as most cite weak product demand as the most significant problem they face.
References
8. For an analysis of the 2007-09 financial crisis, see Bernanke (2010). Return to text
9. Data used in this section are from the flow of funds accounts published by the Federal Reserve Board, Consolidated Reports of Condition and Income for banks, and surveys of lenders and of small businesses. Information from the flow of funds accounts relates to organizational type rather than to size of firm. A business can be organized as a corporation (C type or S type), a proprietorship, or a partnership. Most proprietorships and partnerships are small businesses. Large, publicly traded firms are generally C corporations, which are subject to corporate income taxes and securities laws. The S type of corporation is designed primarily for small businesses and generally is not subject to corporate income taxes. Return to text
10. In this section, data on partnerships and proprietorships are from the flow of funds accounts published by the Federal Reserve Board, and total small business debt is approximated by unincorporated nonfinancial business debt from the flow of funds accounts. These data may include some large proprietorships and partnerships, which would not be considered small businesses. Return to text
11. Each month, the NFIB polls a random sample of its members to assess business conditions and the availability of credit for small businesses. For the first month of each quarter, roughly 11,000 firms receive questionnaires, and about 2,000 typically respond; for the remaining two months of each quarter, about 4,000 questionnaires are mailed, with around 800 responses. About 90 percent of the respondents have fewer than 40 employees. Return to text
12. The SLOOS is available on the Federal Reserve Board's website at www.federalreserve.gov/boarddocs/SnLoanSurvey. Return to text
13. Data on small business loan prices (interest rates and fees) are not publicly reported or widely available. Therefore, the analysis and discussion of pricing in this report are limited. Return to text
*On October 12, 2012, figure 2, panel A, was updated so that the data for the nonfinancial bond default rate now include the previously missing May value. In addition, in figure 5, panel C, the value for the fourth quarter of 1991 was removed from the start of the series so that the data now begin in 1992, as originally noted.

