

 Print
Print

Framework: The New Potential for Data in Managing Neighborhood Change
Since its launch in 2008, the federal Neighborhood Stabilization Program (NSP) has been providing substantial funding to local governments to address neighborhood problems arising from the foreclosure crisis. While local officials have been urged to use hard data on neighborhood conditions to devise smart and efficient stabilization strategies, in reality few local agencies have been able to mobilize much relevant data for this purpose so far. In fact, looking back at efforts to address problems of deterioration and abandonment over the past three decades, it is hard to argue that data have played much of a role.
Nonetheless, there are indications that we may now be on the cusp of transformational change in using hard data on neighborhood conditions to devise smart, efficient revitalization strategies. Underlying the transformation are the remarkable recent advances that have been made in web technology and Geographic Information Systems (GIS) capacity. But arguably more important is what has begun to happen inside many city and county governments. Advancing technology is permitting dramatic improvements in the development and integration of local parcel-level data systems, whose costs are also decreasing. In addition, new university- and nonprofit-based data intermediaries have been established in many cities by organizations that have been able to assemble substantial relevant neighborhood-level information from across agencies and levels of government. Groups like these in 35 cities, along with the Urban Institute, have formed a network, the National Neighborhood Indicators Partnership (NNIP), to expand such capacities in other localities and advance the state of the art in the field (www.neighborhoodindicators.org  ).
).
Finally, officials and practitioners are increasingly using the data and systems in innovative ways, both for analysis to support strategic planning and for facilitating program implementation. We believe that even these early examples suggest that data-driven decisionmaking in neighborhood stabilization can markedly improve the effectiveness of such programs.
Key Elements in a Data-Driven Environment
In this article, we introduce the three key elements of this emerging data-driven environment that provide context for the other five articles in this publication:
- Data to manage neighborhood change. This section describes the types of data useful in neighborhood stabilization efforts that are becoming more available in American cities
- Five ways to influence change. This section illustrates five ways in which the newly available data can be used to influence change in neighborhood real estate markets, specifically in planning and implementing neighborhood stabilization.
- Using data at different experience levels. This section then offers ideas about how administrators in communities whose data systems are in various stages of evolution can use available data productively in their neighborhood stabilization programs.
Local governments will continue to face challenges in revitalizing their neighborhoods for many years in the future. Accordingly, we assume a definition of neighborhood stabilization broader than that used by the federal NSP--that is, a definition that assumes a wider range of response strategies and a longer time horizon. It should be useful to be thinking about creative uses of data to assist in the full array of activities localities may undertake to influence neighborhood real estate markets over the longer term.
Data to Manage Neighborhood Change
In providing data to improve neighborhood stabilization, the most valuable contribution has been the automation of computer-based administrative records on properties already maintained by local governments. In this section, we review data from those sources first, and then note data from other sources that can benefit the stabilization process.
Property Data Systems from Local Government Records
All local governments (cities or counties, depending on the place) maintain basic records on land parcels in order to control land ownership and operate property tax systems. These records, including information on each of the individual land-ownership parcels in the jurisdiction (summarized in table 1), are updated at various intervals. Most localities also maintain some minimal data on mortgages, primarily because these data are pertinent to clarifying property titles (and not because of any potential role in stabilization planning). Other local agencies with responsibility for, say, building safety and related functions, also keep records on activities that are linked to land-parcel identification numbers (e.g., building permits, code enforcement violations, and condemnations).1
| Local governments |
Auditor/treasurer/assessor
Recorder or registrar of deeds/clerk of courts
Building/housing departments/code enforcement
Water/utilities department
Other departments and agencies
|
|---|---|
| Other institutions involved in neighborhood revitalization |
CDCs and other housing nonprofits
|
| Other sources for property data |
Special surveys
Proprietary datasets on mortgage lending
|
Note: Department/agency names and functions differ among cities.
Before these records were automated, updating and using them for anything but basic recordkeeping was arduous. For example, a developer trying to assemble parcels to build a new project had to spend substantial time looking up and copying information from paper files one by one. Now, such tasks are much easier. As of 2008, 80 of the largest 100 cities provided web access to some parcel-level data from assessor's records, and in many cases, users could click on individual parcels on a map to automatically bring up tables identifying owners and property characteristics.2
In addition, advanced GIS software allows parcel boundaries and other geographic features to be identified more precisely in space (by coordinates) and linked with other engineering information (e.g., locations of fire hydrants, pumping stations, street repairs, breaks in water pipes, etc.--data not shown in table 1). Many localities also have automated crosswalks between postal addresses and parcel numbers, so that address-based data added to the system can be linked directly to existing parcel records. And a number of cities have established formal plans to integrate all of their jurisdiction's location-based information to form Enterprise GIS systems.3
We know of no overall surveys showing how many cities have reached various levels of GIS development. Our impression, based on numerous anecdotes, is that most medium- and larger-sized cities have automated the local government data identified in table 1, but that very few have what could be considered truly comprehensive Enterprise GIS systems.4 The fifth article in this compilation (by Janes and Davis) describes the Baltimore systems and the variety of ways they are being used to further neighborhood revitalization objectives. We also believe that comparatively few cities, even when the data are available, have taken what turn out to be two critical steps for neighborhood stabilization planning: systematically linking the records of different system components to each other and using the data proactively. (See the section "Using Data at Different Levels of Experience" for a progression of use).
Availability of Other Relevant Data
Table 1 lists data sources for parcel-level data about properties, including local government, housing, and community development nonprofits as well as other sources. As to data from nonprofits, for example, community development corporations (CDCs) and other nonprofits may be willing to share information on properties they are developing or primary data such as surveys on property conditions and vacancies that might be collected by a neighborhood organization. In addition, proprietary sources such as RealtyTrac and LPS Analytics can provide valuable data on mortgage delinquency and foreclosure, although the costs are often prohibitive for community work.
In addition to property data, socioeconomic indicator data at the neighborhood level can help stabilization planners better understand the people and the dynamics of the neighborhoods in which they are working. Examples include crime rates; birth rates (by age, race, and other characteristics of the mother); Temporary Assistance to Needy Families (public assistance) and Food Stamp enrollment; child care locations and quality ratings; school enrollment and proficiency scores; and other indicators that reflect quality of life. These data are typically not keyed to individual parcels but are instead aggregated to the census tract 5or perhaps even the zip code; nevertheless, this aggregated data offers useful context within which to design environment-specific stabilization interventions. The availability of such data has expanded dramatically in many cities due to the work of local data intermediaries like the partners in NNIP.
Other data for small areas has become easier to access through a number of national files prepared not only by the Census Bureau but by other government data collection efforts. A good example is the annually updated data on mortgage lending at the census tract level, mandated by the Home Mortgage Disclosure Act (HMDA).6 These files include information on denied mortgage applications as well as originations, such as mortgage amounts and race, gender, income level, and type (owner-occupant vs. investor) of the borrowers. Data on vacancies from the U.S. Postal Service are now available by tract, and information from Internal Revenue Service (IRS) returns on incomes by source are available at the zip-code level. The U.S. Department of Housing and Urban Development (HUD) also periodically makes tract-level data available on the projects it assists by program type, as well as an address-level file on HUD-assisted, privately owned multifamily properties with expiration dates.7 These files provide characteristics of assisted families as well as information on the size and locations of the projects themselves.
Five Ways to Influence Change
Jump to:
- Strengthening Citywide Laws, Regulations, and Enforcement Capacities
- Selecting Particular Neighborhoods for Prioritized Action and Designing Context-Appropriate Strategies for Selected Neighborhoods
- Designing Strategies for Individual Properties within Selected Neighborhoods
- Implementing Prioritized Stabilization Strategies across Neighborhoods<
- Managing Ongoing Stabilization Programs Using Neighborhood Data to Track Performance
In this section, we describe how data can be used to further the objectives of neighborhood stabilization. As noted earlier, we define neighborhood stabilization to include all activities that localities may undertake to influence neighborhood real estate markets over the longer term, not just those that are allowed under the federal NSP.
Our definition of neighborhood stabilization includes five processes that influence change:
- Strengthening citywide laws, regulations, and enforcement capacities
- Selecting particular neighborhoods for prioritized action and designing context-appropriate strategies for selected neighborhoods
- Designing strategies for individual properties within selected neighborhoods
- Carrying out selected stabilization strategies within neighborhoods
- Managing ongoing stabilization programs using neighborhood data to track performance
All of these strategies are carried out by local government agencies and housing nonprofits, but these entities often do not have the capacity to perform the necessary data analysis unassisted. Local data intermediaries like those in NNIP play an important role in this regard. They are formed not only to assemble data from a variety of local agencies but also to make it available to users and help them apply it productively. Several NNIP partners have been at the forefront of applying data creatively in neighborhood stabilization planning (as we highlight below in our discussion of the stabilization processes).
Strengthening Citywide Laws, Regulations, and Enforcement Capacities
Stabilization efforts within neighborhoods can be facilitated or frustrated by the framework of laws, regulations, and enforcement capacities that exist in a city. The processes described in the following examples involve the use of data to help decisionmakers better understand the nature of the problems they face and the options for addressing them. In this way, data are critical to helping administrators make better-informed decisions in a citywide policy environment.
Our first example is a citywide initiative in Cleveland that was motivated by the work of Case Western Reserve University's Center on Urban Poverty and Community Development. The center developed NEO CANDO, Northeast Ohio Community and Neighborhood Data for Organizing, a free online data system that allows users to access neighborhood-level data on a variety of social, economic, housing, and health-related conditions. Since 2005, the NEO CANDO site (http://neocando.case.edu/cando/index.jsp) has incorporated parcel-level data, including lot characteristics, assessed values, tax billing information, and property transfers. In the past few years, the center has been able to add to the system considerable valuable information pertaining to foreclosures.
How has it been used? In 2006, for instance, NEO CANDO supported analysis of the circumstances of real-estate-owned (REO) properties owned by different banks. These data served as the basis for a preliminary injunction against one major bank that owned many REOs but was not adequately maintaining them. The resulting court-ordered injunction calls for the bank to keep its properties up to code and prevents it from selling properties with violations at distressed prices.
This success prompted the City of Cleveland to initiate Operation Prevent, which aims to hold all banks and investors accountable for the condition of the properties they own. To support the project, the city and the center's team developed an interface and data algorithms for NEO CANDO that flag, and then alert stakeholders such as code enforcement staff, housing agency staff, and CDCs to, the presence of foreclosed properties that appear abandoned or are entering and leaving REO status at distressed prices.8 The center is also developing an online portal that allows local CDCs to directly input information on code violations and vacant homes, supplementing the resources of the city's stretched staff.9
Another example of how data can be used in the interests of neighborhood stabilization at the city level is in the realm of policy analysis of investor purchases of distressed properties. Walker and Mallach discuss this case further in the second article of this compilation.
Selecting Particular Neighborhoods for Prioritized Action and Designing Context-Appropriate Strategies for Selected Neighborhoods
Even the most amply funded neighborhood stabilization programs cannot afford to operate full-scale programs in all neighborhoods. Priorities must be set. Clearly, to warrant government intervention, a neighborhood must have a substantial level of foreclosure activity. However, a "worst-first" approach often does not make sense. Many administrators are now urging priority for neighborhoods that are more near the middle of the distribution--areas that have substantial foreclosures, but also enough existing market strength that a reasonable amount of investment might restore healthy private market conditions. These are places where investment will be most highly leveraged. In cities where administrators legitimately choose to invest in those places that are more troubled, tools such as demolition and land banking may have to be more prominent in neighborhood stabilization efforts in the short term.
Making these kinds of decisions well obviously depends on considerable information. The Foreclosure-Response.org website provides some relevant data for all U.S. metro areas. The site features indexes developed by the Local Initiatives Support Corporation (LISC) of both comparative foreclosure risk and market strength for all census tracts nationally, along with a guidebook to help local analysts use them.10 That guidebook emphasizes, however, that these data must be supplemented by local data and understanding of market dynamics to identify key thresholds in any specific place.
How best to lead practitioners through a process using such data to make sound decisions is still much more of an art than a science, but various groups are working on tools to improve results. Perhaps the best example at this point is an approach developed by The Reinvestment Fund (TRF) in Philadelphia. As part of a project originally undertaken to provide a basis for the Mayor's Neighborhood Transformation Initiative in Philadelphia, TRF analyzed a vast amount of parcel-level data, identified six distinct types of neighborhood real estate markets, and classified all city neighborhoods according to that typology. Each market type was associated with a package of appropriate public interventions (that is, the typology pointed out where it appeared most sensible to give priority to cleaning up vacant lots, demolishing versus rehabilitating row houses, subsidizing new construction, improving roads and other city infrastructure, etc.).11
TRF's approach, which enriches understanding of the interaction of market conditions and foreclosure trends, is clearly ready-made to support the kind of thinking and analysis suggested above for neighborhood stabilization strategies at the neighborhood level. This approach has been applied for that purpose in Philadelphia and elsewhere. The third article in this compilation (by Goldstein) provides a full description of its application in Baltimore (also see the discussion of this approach in the article by Janes and Davis).
Designing Strategies for Individual Properties within Selected Neighborhoods
Once a neighborhood has been selected for intervention, the next step is to design strategies that make sense for individual properties within the neighborhood. These, of course, can range widely: steps to prevent foreclosure and keep residents in their homes, intensive code enforcement and other actions to assure ongoing maintenance, subsidizing or facilitating private or nonprofit repurchase and rehab, direct public acquisition with or without rehab, etc.
Deciding which mix of actions is appropriate for which properties and what priorities to give to each may be one of the most challenging assignments neighborhood planners have ever had to face. Without substantial updated information about specific properties in the targeted neighborhood, they would largely be shooting blind.
Probably the best example of bringing data to bear in an environment like this is again the work of NEO CANDO in Cleveland. As noted, that system has incorporated and regularly updates a very rich set of parcel-level data, including almost all of the indicators listed in table 1 as well as others. The system is one of the most complete property-by-property information repositories on mortgage status and foreclosures in the country.
The NEO CANDO approach evolved from an experience that began in 2005 when the Center on Urban Poverty and Community Development staff began to work directly with Neighborhood Progress Inc. (NPI), Cleveland's primary community development intermediary, in developing strategies for neighborhood improvement. The joint team met regularly to identify potential properties for new development and to consider remedial actions for problem properties showing signs of blight. They relied heavily on information drawn from the NEO CANDO system for all of the properties in a given neighborhood; this information included maps and tables that provided a host of relevant facts about properties, such as existing development plans, vacancy status, and various problem indicators. The process was interactive. Community development practitioners on NPI's team could conceptualize various courses of action and then, with help of the center's staff, test them against the data in NEO CANDO.
After the foreclosure crisis hit, this same data-driven mode of operation was applied to the task of neighborhood stabilization planning. The process has won considerable acclaim as a (perhaps "the") model for effective data use in NSP.12 Community developers have always faced difficult decisions in trying to choose the most sensible interventions for individual properties (or clusters of properties). Historically, they gathered some information about the properties in question ahead of time, but collecting useful data on a few properties at a time was always onerous. In contrast, what the Cleveland example shows is that NEO CANDO makes an extraordinary amount of relevant information available directly to users at no cost and in formats that are easy to understand and work with.
At the outset, the teams included neighborhood residents and staff from the center and NPI. In later stages, the participant list was broadened to include housing counselors and some city officials. The data serve to provide early warnings of imminent problems. Team members can be dispatched to help owners prevent foreclosures as well as to initiate actions on other properties in deeper trouble (code enforcement, acquisition, rehab), and they are equipped to do so in a much more timely and informed manner than had been possible before. A Federal Reserve Board video on the NEO CANDO process (www.federalreserve.gov/communitydev/stablecommunities.htm) succinctly shows how these data-review sessions work.
NEO CANDO and its partners have developed what is probably the most advanced approach to using data to manage neighborhood change that now exists. However, other cities are part-way there. The fourth article in this publication (by Wascalus, Matson, and Grover) explains the expanding data resources of the University of Minnesota's Center for Urban and Regional Affairs and how they are beginning to be used in a similar process to select strategies for individual properties in distressed neighborhoods in Minneapolis.
Implementing Prioritized Stabilization Strategies across Neighborhoods
As discussed above, using a data system like NEO CANDO involves making decisions about properties based on a comprehensive review of data in a specific neighborhood. In this section, we point to processes where citywide data sets are used to spur actions affecting properties in many neighborhoods.
An application in Washington, DC, illustrates the approach. Until a few years ago, tenants living in rental properties that were in foreclosure often had no knowledge the process was under way until a new owner acquired the property and eviction was imminent. Recognizing this as a serious problem, the local NNIP partner (NeighborhoodInfo DC) is now regularly retrieving information on foreclosure notices soon after they are filed with the city and releasing the data to housing counseling groups. These groups can then visit the buildings that have entered foreclosure to inform tenants in those properties of the situation, their rights, and their options at an early stage.
Another type of application in this category involves using information to improve the efficiency of local-level government stabilization activities. A good example is the property acquisition process in Baltimore. In the early 2000s, the mayor pledged to do something about the city's massive stock of vacant, derelict rowhouses. The first step in his response, called Project 5000 because of the number of affected properties, was to ramp up the city's property acquisitions to an unprecedented level. To accomplish this, city staff and contractors developed a new information system with considerable details about each property, ranging from physical condition and financial data to schedules for specific actions to be accomplished. The system automatically generated frequent reports that supported city leaders' strategic thinking about more effective acquisition techniques (varying depending on the characteristics of different types of properties) and a rigorous management process. Results included the hoped-for major expansion of throughput along with marked reductions in both acquisition time and cost. (Janes and Davis explain this experience in more detail later in this compilation.13 )
Managing Ongoing Stabilization Programs Using Neighborhood Data to Track Performance
Building off the last example is the idea of using similar linked information systems to manage the broader process of neighborhood stabilization. This approach is being supported by the NSP requirement that automated property-by-property records be maintained in relation to all program outlays. With today's information technology, storing needed information at the property level is no longer an expensive proposition. Categories of information include expenditures by type (detailed categories), responsible parties, key events (like property purchases and other private investments), schedule dates, and other data relevant to each type of program.
Once such data are in the system, it becomes possible to operate a quite sophisticated process of performance management. This is particularly true when data on program activities and costs (acquisitions, rehabs, resales, etc.) can be related to data on broader outcomes for the same neighborhood--data noted in table 1, like property sales volumes and prices and foreclosure rates, along with demographic and social data such as crime rates, etc. Reports on all these topics should be reviewed regularly (perhaps quarterly) by an intersectoral stabilization team, like the one in Cleveland. To be sure, one purpose of such meetings would be basic accountability: Is planned work getting done on time and on budget? But, more important, these reviews should offer the team valuable insights on what is working, what is not, and why--a formidable basis for making smarter mid-course corrections.
Ongoing learning like this should naturally feed back into a much stronger neighborhood planning and management process over the longer term. The same data sets can be used to generate early warning indicators that let neighborhood revitalization teams get on top of new problems more quickly as they emerge.
The teams should also be able to develop new computer-based tools to facilitate decisionmaking. An example of this is a web-based tool developed in Providence, Rhode Island, that allows users to create listings of properties according to any criteria they choose (for example, characteristics that might identify good candidates for rehabilitation, demolition, or some other intervention) and then sort the listings any way they want (for example, by number of code violations or recent change in assessed value) to create priority sequences for different programmatic responses. They can then pull down screens showing detailed data (including photographs) for individual properties. Two other features of this tool have proven valuable: (1) a comments box, to enable users to write in their own observations about the property, and (2) a "surrounding properties display" showing a map and characteristics of properties surrounding the one selected.14
This article, and most of the others in this publication, focuses on the use of property-related data to inform the design and implementation of neighborhood stabilization strategies. It is important to keep in mind, however, that there are other indicators of neighborhood well-being that are ultimately more important to neighborhood stability than the status of the real estate market. In the last article, Zielenbach and Sivak illustrate innovative uses of data from the records of a community development lender and credit union in monitoring and furthering broader goals related to employment and wealth-building.
Using Data at Different Levels of Experience
Jump to:
NEO CANDO and the other efforts cited earlier offer exemplary applications of data toward neighborhood stabilization. In most instances, however, these applications represent more than a decade of data development and coalition building. Communities without this infrastructure in place may be intimidated by the long-term investment in time and money, and, at worst, might be discouraged from even considering using data to guide their planning and policymaking. That would relegate communities to ill-informed decisions during this era of increasing demands for scarce resources. Building a data system and partnerships that contribute to sound decisionmaking may not be simple, but it is an achievable goal that will provide lasting benefits to justify the effort.
In this section, we demonstrate how any community can use data to make more informed planning and operational decisions. Following are suggested steps that cities with various levels of experience using data can take to move toward more-informed decisionmaking and greater neighborhood stabilization.
While this section describes actions in defined stages, in reality this work is an iterative process. Organizations will use imperfect data that are immediately accessible, improve the quality of the data in hand, and gather more data as they become available. Practitioners likely already have experience using data on a property-by-property basis. Over time, the practitioners will become more sophisticated and systematic consumers of data and will ask new questions that will call for additional kinds of information.
Beginning Level: Foundations for Data Collection and Use
Communities getting started should first identify who should be engaged in the process. Involving staff from agencies that address abandonment and other symptoms of distress on the ground is essential for moving from information to action. In addition, practitioners can bring knowledge to the table about the local foreclosure process, community stakeholders, and neighborhood context. The needs of this audience should always be the primary focus for data collection and analysis. Governmental and nonprofit agencies that collect data related to neighborhood stabilization represent a second group that should be consulted. While assembling the list of relevant players, organizers should compile a list of existing programs and data sources that will provide a baseline picture of neighborhood stabilization efforts and inform their strategies about coalition building and data acquisition.15
Communities will also need to identify a group inside or outside of government that has the capacity to manipulate data files, identify what questions the data can appropriately answer, and produce charts and maps accessible to non-technical audiences. It's also a good idea to involve potential funders, such as local foundations or banks, early in the discussions. City or university staff may not need external funding for analytic work right away, but they will likely need additional resources as the work moves from exploratory analysis to an essential part of stabilization operations.
With the initial buy-in of both the programmatic and analytic organizations, the next step is to acquire relevant data. As mentioned earlier, electronic records of property ownership, assessed values, and sales do exist in most places. Unfortunately, this does not mean that these data are accessible to stabilization teams in a usable format. For example, the most common city online systems only allow for viewing property information one-by-one. Some stabilization teams may not have access to any parcel-level data files at all.
Groups starting out should learn about the status of property data in their area and initiate efforts to obtain files from their local government agencies. The most common situation organizations encounter is that the local agency has the data in an organized, electronic form, but will not share the entire file on a regular basis. There are usually a variety of reasons for restricting access to the data, one being that the government is selling the data directly or has an exclusive distribution agreement with a commercial firm. Hopefully this frustrating situation will become less and less common as more local governments embrace the principles of open data. In the meantime, NNIP's Data Sharing Guide at www.neighborhoodindicators.org/library/guides/nnip-lessons-local-data-sharing offers practical advice on how to negotiate with agency staff for data access based on the decade-long experience of local data intermediaries. Groups can also try a combination of Freedom of Information Act requests and advocacy for free data access for public benefit uses.
Depending on the place, negotiations to acquire local data could proceed quickly or take several months. In the meantime, communities can tap into national data available from federal, nonprofit, or commercial sources to help understand their neighborhood housing markets. Table 2 illustrates specific questions related to neighborhood stabilization that national and commercial data sources can help answer. Data from national sources are typically free--for example, as mentioned previously, Foreclosure-Response.org offers free census tract-level indicators on housing market and foreclosure risk and guidance on how to use the data. Commercial data, on the other hand, are often costly and have restrictions on dissemination, but they can provide key information and are generally more current than national data. And, publicly minded commercial firms may give grassroots groups complimentary or discounted data.
| Question | Data source |
|---|---|
| How did the volume of home purchase mortgages vary across city neighborhoods last year? |
HMDA (www.ffiec.org/hmda/ or www.metrotrends.org/natdata/index.cfm )
|
| What was the mix of income levels of borrowers or of owner-occupants who bought homes last year? | HMDA |
| Which zip codes in my metropolitan area have the highest foreclosure inventory?Mortgage delinquencies? |
LISC Foreclosure Risk Scores (Foreclosure-Response.org )
|
| Has the number of vacant addresses been increasing or decreasing in my target neighborhood? | U.S. Postal Service vacancy data (tract-level from HUD, address-level from commercial firms) |
| Where are concentrations of real-estate-owned properties in the city? | Commercial address-level data on properties that foreclosed and are now owned by banks (RealtyTrac, etc.) |
| What have been the quarterly trends in home sales and median sales prices? |
Commercial property sales data (local realtor association or Boxwood-Means, available through PolicyMap at www.PolicyMap.org )
|
Despite limitations to national and commercial data, analysis based on these easily available sources is a good starting point to help organizations get accustomed to using data and to build their appetite for more. Individual organizations can use the data in their long-term planning or in their day-to-day work. The analysis can also be the impetus for a convening of the various groups working on the neighborhood stabilization. As with the interactive sessions in Cleveland, information needs to be portrayed in accessible maps and charts and related to the interests of practitioners and policymakers. As proven in meetings around the country, presenting a well-crafted package of analysis builds a common understanding about the patterns and trends of neighborhood health, sparks new conversations, and spurs new working relationships. Inevitably, these meetings raise more questions that will suggest the next priorities for analysis.
Intermediate Level: Expanding to Local Data
Cities at a more advanced stage of using data will have collected a few local property-level data files. Local data provide the geographic detail of the commercial data above, and are generally more financially feasible to obtain recurrently, rather than a one-time purchase. Local data are also more likely to be address- or parcel-level, which allows better identification of issues of quality and of outliers. Some of the questions about foreclosures and home sales listed in table 2 can be answered in more detail using local data compared to national data; more important, local data also opens up many questions and more possibilities for analysis. As illustrated in table 3, the analysis can examine indicators individually (as in the code violation example below) or might combine indicators from two sources laid side-by-side (looking at 911 calls in high-foreclosure areas, for example). Users can also derive new indicators, such as comparing the property address to the owner address to identify owner-occupancy or calculating the length of residence from the last sale date. Finally, local groups can begin straightforward linking of files with the same identifier (either address or parcel). This process is often necessary to learn more about properties entering foreclosure. By linking the record of the filing, which lists only a parcel identifier, parties involved, and date, to the assessor's file, neighborhood planners can learn about the property structure type, assessed value, owner-occupancy, and date of last sale.
| Question | Data source |
|---|---|
| Where are the properties with repeated code violations? | Code violation data |
| Which high-foreclosure neighborhoods also have rising numbers of 911 calls? | Foreclosure filings, police calls |
| What's the ratio of foreclosure sales to market sales in the neighborhoods? | Property deed data |
| What are the trends in owner-occupancy in a specific neighborhood? | Assessor's file with ownership status derived |
| What percentage of the properties entering foreclosure are single-family homes? | Foreclosure filings linked to assessor's file |
Local users should be prepared to receive data with little or no documentation and in need of cleaning. The organization responsible for analyzing the data can identify some indicators that are reliable in the short term, and work on improving the data collection and their understanding of the file in the long term. The NNIP experience shows that applied use improves data quality by motivating improvements in collection and documentation.
Another option for getting started or expanding the use of local data is community- or public-sector-driven primary data collection. While in many cities this happens on an ad hoc basis in a few neighborhoods, a rigorous collection protocol is far more valuable. As one example, a broad coalition in Memphis, with the leadership of the Center for Community Building and Neighborhood Action (CBANA) at the University of Memphis, implemented a citywide Neighborhood Survey and Problem Property Audit from 2008 to 2010. Authorized and funded by the city's Division of Housing and Community Development, the effort included trained volunteers from numerous neighborhood organizations and block clubs (organized and working together as part of the local foundation-supported "Problem Properties Collaborative," which was staffed by CBANA and the Community Development Council of Greater Memphis) as well as other volunteer organizations. The effort also received coordinated logistical support from the Memphis Police Department whenever a survey team was working in the field, with more intensive arrangements for neighborhoods with higher crime.
Using handheld computers with GIS software, preloaded parcel maps, and drop-down menus for recording on-site observations, CBANA-trained volunteers evaluated more than 200,000 residential properties in the city of Memphis, documenting problems. They ranked the seriousness of conditions, such as structural problems and trash on the lots, for each property based on the anti-blight housing code. Additionally, they linked the condition of every parcel that entered foreclosure in 2007 and 2008 with administrative data on its status in the foreclosure and resale process (figure 1 provides an example from the Mendenhall Estates neighborhood).16 With this information, the city and neighborhood groups--and ultimately the CDCs and others working with Neighborhood Stabilization Program funding--could target properties for enhanced code enforcement, identify abandoned homes and demolition candidates, and inform property-acquisition plans. The system has also been used to identify city- and private foundation-sponsored acquisition actions against problem properties and the selection of the new community development intermediary's (Memphis Community LIFT) targeted neighborhood areas. Primary data collection such as the Memphis "Neighborhood by Neighbor" survey also has the advantage of grassroots involvement and support for local data systems--a good way to build momentum at early stages of system building. For more details on the project and to learn about potentials for replicating it in other cities, visit CBANA's website at http://cbana.memphis.edu/community.php. 17
With either local administrative or property survey data, analysts can prepare hot-spot maps to show patterns across the city, charts with trends over time for target neighborhoods, and zoomed-in maps of individual parcels. Each application will reinforce the value of locally driven analysis using administrative data. Beyond the individual analysis tasks, building relationships and identifying new opportunities for data acquisition and partnership should be a continuing focus.
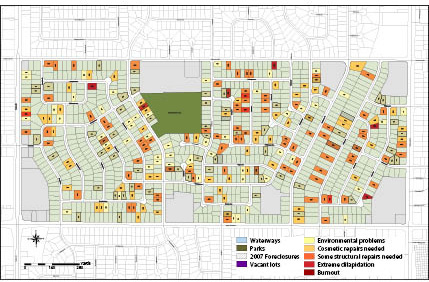
Source: University of Memphis, Center for Community Building and Neighborhood Action (CBANA).
Advanced Level: Analyzing Local Data In-Depth
From here, groups can move on to more in-depth analysis and innovative measures using property-level data. Analysts in Cleveland using data from NEO CANDO and in other cities with similar data systems have created property history files by linking transactions for each property over time. This enables a better understanding of the different stages of the foreclosure process (such as how many months on average between a foreclosure notice and sale) and the identification of foreclosure outcomes, such as completion rates and short sales (see table 4). It also is the first step to identifying investors flipping homes through the short time frame of resale and ratio of original sales price to the next one. Other complex, derived variables include analysis of the text fields, such as grouping properties owned by one investor using different shell companies with the same owner address.
| Question | Data source |
|---|---|
| How many months on average is the foreclosure process? | Foreclosure filings matched with deed data |
| How many properties are in the foreclosure pipeline by neighborhood? | Foreclosure filings matched with deed and sales data |
| Where are the REO properties concentrated? Which banks own the most properties? | Assessor's data with ownership classified by name |
| How long has a property been in REO? | Assessor's data over time with ownership classified by name |
Figure 2 illustrates the type of housing market analysis that an advanced parcel system makes possible. To create these indicators for Washington, DC, political wards, the local data intermediary NeighborhoodInfo DC links four sources of data--property characteristics (to exclude commercial and multifamily properties), foreclosure filings, deeds from foreclosure sales, and home sales. Properties are identified as real-estate owned through automated searching of the text in the owner field for names of banks and servicers. The results demonstrate where foreclosure-related activity dominates the residential real estate market, as in Ward 8 where 60 percent of all sales are classified as non-market sales.
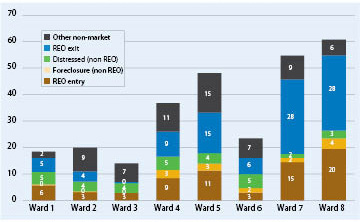
Source: DC Recorder of Deeds and Office of Tax and Revenue data tabulated by Neighborhoodinfo DC.
They also calculate the indicators for individual neighborhoods to better serve practitioners' interests. CDC directors considering acquiring a particular foreclosed property can take into account what the potential demand might be for a rehabbed home. The analysis will be repeated over time to show shifts in the composition of the housing market. For example, nonprofit organizations working on marketing a certain neighborhood to first-time homebuyers could see progress in the number of properties that are "exiting REO"--that is, transferring from bank ownership to a private owner. (For more ideas from NeighborhoodInfo DC about how to analyze and present parcel data, visit www.neighborhoodinfodc.org/Foreclosure/index.html .)
Organizations can also tackle linking address-level records with those with parcel identifiers. A parcel is a legally defined piece of land that can have many addresses (such as an apartment building). Some local governments publish an official parcel-to-address crosswalk, but if not, researchers outside of government will need to build one. This crosswalk opens up new avenues of analysis, such as identifying the individual REO properties that were locations of reported crimes. Users can also combine data sources to create indices of distressed properties, layering incidents of code enforcements, tax liens, fire calls, etc. in order to prioritize the most troubled properties.
Groups with successful parcel-based data systems never consider their work "finished." Even places with advanced data systems continue with the tasks described for cities just starting out--securing and renewing data agreements, nurturing relationships among differing organizations, and endeavoring to provide accessible analysis relevant to program planning and implementation.
All Levels: Moving to a Culture of Informed Decisionmaking
Communities at all levels of sophistication in using data must work to discern the practical implications of analytic findings and to form collaborations to design, implement, and refine interventions. Ideally, what will shift over time is that stakeholders will become more experienced consumers of data, enabling practitioners to have a more grounded program of work and residents a more informed and influential voice--both in terms of the questions asked and consensus-building on priorities and strategies. When civic players have regular opportunities to review and become more comfortable with parcel and neighborhood data, a common understanding of neighborhood issues is most likely to emerge; relationships across nonprofit and government agencies are strengthened; and efforts across agencies, neighborhoods, and stakeholders can become more coordinated. Systematic use of data to guide neighborhood stabilization programs will eventually lead to a culture shift where well-informed decisions help communities make full use of scarce resources to improve their neighborhoods.
Complementing Our Framework: Five Approaches to Stabilization
The remaining articles in this compilation illustrate and expand on the themes offered in this framework, as noted earlier.
- Walker and Mallach examine issues and policies related to investor purchases and illustrate how data can be used in our first process: strengthening citywide laws, regulations, and enforcement capacities.
- Goldstein discusses how The Reinvestment Fund's Market Value Analysis approach is being applied in Baltimore and offers an excellent illustration of the use of data in our second process: selecting particular neighborhoods for prioritized action and designing context-appropriate strategies for selected neighborhoods.
- Wascalus, Matson, and Grover review the development and use of property-level data in Minneapolis in our third process: designing strategies for individual properties within neighborhoods. As such, this article is a useful complement to our story of how the same process has been carried out by NEO CANDO in Cleveland.
- Janes and Davis explain many aspects of the development and use of property data systems in Baltimore and, as such, the article provides a good example of the overall approach we suggest. Moreover, its discussion of system applications offers particularly good illustrations of our fourth and fifth processes: implementing prioritized stabilization strategies across neighborhoods and managing ongoing stabilization programs using neighborhood data to track performance, respectively.
- Zielenbach and Sivak reach beyond our framework, using work by the HOPE family of organizations (which operates in four states) as an example to illustrate the development of data related to underlying fundamentals: employment and wealth building.
About the Authors
Kathryn L.S. Pettit is a senior research associate in the Metropolitan Housing and Communities Policy Center at the Urban Institute and co-director of the National Neighborhood Indicators Partnership. Her research focuses on measuring and understanding housing markets and neighborhood change. She is a recognized expert on local and national data systems useful in housing and urban development research and program development.
G. Thomas Kingsley is a senior fellow at the Urban Institute. His research specializes in housing, urban policy, and governance issues. He served for more than a decade as the director of the institute's Center for Public Finance and Housing and is currently co-director of the National Neighborhood Indicators Partnership. He previously served as director of the Rand Corporation's Housing and Urban Policy Program, and as assistant administrator of the New York City Housing and Development Administration.
1. For a detailed listing of data sources and technical guidance for analysis, see Kathryn L.S. Pettit, Barika Williams, Peter Tatian, G. Thomas Kingsley, and Leah Hendey (2011), Using Property Databases for Community Action (Washington, DC: The Urban Institute). Return to text
2. Arnold Chandler, Josh Kirschenbaum, G. Thomas Kingsley, and Kathryn L.S. Pettit (2007), The Potential of Parcel-Based GIS in Community Development and Urban Land Management, Working Paper (Cambridge, MA: Lincoln Institute of Land Policy). Return to text
3. ESRI (2003), Enterprise GIS for Municipal Government: An ESRI White Paper (Redlands, CA: ESRI Press); and Cory Fleming (2005), The GIS Guide for Local Government Officials (Redlands, CA: ESRI Press). Return to text
4. Good examples of well-developed property information systems are those in Baltimore, Maryland; Portland, Oregon; and Washington, DC. See District of Columbia Office of the Chief Technology Officer (2005), Federated Geospatial Data Model (Washington, DC: District of Columbia Government). Return to text
5. Census tracts are small geographies normally with populations in the 3,000-6,000 range. They were originally defined by the Bureau of the Census with an effort to recognize important geographic features (such as major highways) and socioeconomic homogeneity. The bureau provides considerable data at the tract level, which is considered by many as at least an approximation of "neighborhood" scale. Return to text
6. These files are explained in Kathryn L.S. Pettit and Audrey Droesch (2008), A Guide to Home Mortgage Disclosure Act Data (Washington, DC: Fannie Mae Foundation). Return to text
7. Other national files provide data for small areas on summaries of income tax filings (Internal Revenue Service), on trends in characteristics of businesses and employment (Department of Commerce surveys), and on characteristics of public schools (National Center for Educational Statistics). The Urban Institute regularly cleans and streamlines these files to make them easier to use. Recent versions are now available to the public at www.MetroTrends.org/natdata/ under "UI National Data Depository." Return to text
8. See www.baltimorecity.gov/LinkClick.aspx?fileticket=_ezq6oAMe6M%3d&tabid=1039&mid=1838. Return to text
9. See www.baltimorecity.gov/Government/AgenciesDepartments/Planning/MasterPlansMapsPublications/HousingMarketTypology.aspx. Return to text
10. See G. Thomas Kingsley, Leah Hendey, and David Price (2011), Setting Priorities for Neighborhood Stabilization: A Guide to Using Foreclosure-Response.org Indexes (Washington, DC: Foreclosure-Response.org), www.foreclosure-response.org/assets/maps&data/SettingPrioritiesforNeighborhoodStabilization.pdf . The indexes are documented in Chris Walker and Francisca Winston (2010) "A HMDA-Based Housing Market Index to Track Neighborhood Change," and (2009) "Zip-Code Foreclosure Risk Score Methodology Appendix" (Washington, DC: Local Initiatives Support Corporation). Return to text
11. TRF has since applied the approach in other cities. The process is documented on The Reinvestment Fund's website in the "Real Estate Market Analysis" section (www.trfund.com/policysolutions/remarketvalue.html ). Also see Ira Goldstein (2010), "Maximizing the Impact of Federal NSP Investments through the Strategic Use of Market Data," in Prabal Chakrabarti, Matthew Lambert, and Mary Ellen Petrus, eds., REO and Vacant Properties: Strategies for Neighborhood Stabilization (Washington DC: Federal Reserve Bank of Boston, Federal Reserve Bank of Cleveland, and Federal Reserve Board of Governors). Return to text
12. The process is documented in Peggy Sand and Phillip Bush (2011), Market Data-Driven Stabilization: A Case Study of Cleveland's NEO CANDO Data System (Washington, DC: Enterprise Community Partners, Inc.) and Coulton and others, "REO and Beyond: The Aftermath of the Foreclosure Crisis," in note 9. Return to text
13. Also see William Ballard and G. Thomas Kingsley (2009), Systems to Improve the Management of City-Owned Land in Baltimore, report prepared for the Annie E. Casey Foundation (Washington, DC: The Urban Institute). Return to text
14. G. Thomas Kingsley and Kathryn L.S. Pettit (2008), Data and Decisions: Parcel-Level Information Changing the Way Business Gets Done (Washington, DC: Metropolitan Policy Program, Brookings Institution). Return to text
15. Examples of such a scan for Atlanta and Chicago were produced for the NNIP cross-site project on foreclosures; see, respectively, Michael Rich, Michael Carnathan, and Dan Immergluck (2009), Addressing the Foreclosure Crisis: Action Oriented Research in Metropolitan Atlanta (Atlanta, GA: NeighborhoodNexus) and Anne Cole (2009), Housing Counseling Research in Chicago (Chicago, IL: Metropolitan Chicago Information Center). Return to text
16. Tk Buchanan, Phyllis G. Betts, Jackson Gilman, and Robert Brimhall (2010), Neighborhood-by-Neighbor: A Citywide Problem Property Audit (Memphis, TN: University of Memphis, April), http://cbana.memphis.edu/GenResearch/NxN_SUMMARY_FINAL_REVISION_8_30_2010.pdf . Return to text
17. The Detroit Residential Parcel Survey (http://datadrivendetroit.org/projects/detroit-residential-parcel-survey/ ) offers another example of how cities can expand the use of local data to inform their neighborhood stabilization efforts. Return to text
