Survey of Household Economics and Decisionmaking
Survey of Household Economics and Decisionmaking Interactive Charts
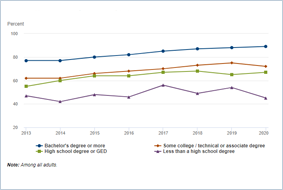
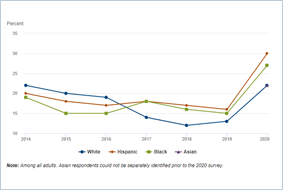
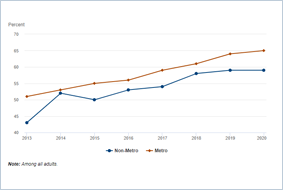
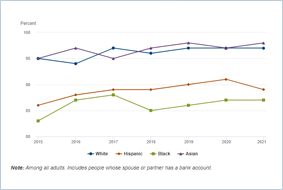
View interactive timeline charts for adults overall, or by age, education, race/ethnicity, or metro/non-metro status.
Note: In the 2023 Survey of Household Economics and Decisionmaking (SHED), the survey asked about bill payments in a different way and the results are not directly comparable to prior years. This corresponding data visualization will not be updated beyond the 2022 survey results due to the variable change.
For more interactive charts, visit:
FRED FRASER NYFed Data Visualizations Atlanta Fed Data
