FEDS Notes
August 02, 2024
As the U.S. is Derisking from China, Other Foreign U.S. Suppliers Are Relying More on Chinese Imports
Trang Hoang and Gordon Lewis
Introduction
China's share of U.S. goods imports has fallen significantly since 2017 following the U.S.-China tariff hikes and other geopolitical tensions. Even though the U.S. has reduced its direct sourcing from China, other foreign suppliers of U.S. imported goods have increased their reliance on imports from China. This trend raises the question of whether the U.S.' reduced direct reliance on Chinese goods might have been offset by its increased indirect reliance through other trading partners, and whether third-party countries, such as Vietnam and Mexico, are serving as China's backdoor to get goods flowing into the U.S. market (Alfaro and Chor, 2023; Freund et al, 2023b; Haberkorn et al, 2024).1
In this note, we examine trading patterns between China and other foreign suppliers to the U.S. to shed light on the evolution of the U.S. reliance on Chinese imported goods over time. Using trade data from the U.S. Census Bureau and UN Comtrade, we document three trends. First, China seems to account for a larger share of the value-added of goods imported by the United States from the rest of the world. Second, while China has intensified its direct trade linkages with many other foreign U.S. suppliers, the United States has imported more from countries, like Vietnam, that have closer trade ties with China, representing a compositional shift in the pool of foreign suppliers to the U.S. Third, the scope for rerouting Chinese goods toward the U.S. via other countries appears to have been limited, at least through 2022.
U.S. suppliers' reliance on Chinese goods increased over 2017-22
We focus our analysis on a key statistic: China's share of goods imports by the average U.S. supplier weighted by that supplier's share of U.S. goods imports. Formally, let $$ s_t $$ denote the average share of goods imports from China by non-China U.S. suppliers:2
$$$$ s_t=\sum_{k}{CH_{kt}w_{kt}} $$$$
where:
- $$ CH_{kt} $$= China's share of supplier $$ k $$'s goods imports in year $$ t $$
- $$ w_{kt} $$= supplier $$ k $$'s weight, measured as U.S. goods imports from supplier k divided by total U.S. goods imports (excluding imports from China), in year $$ t $$
Figure 1 shows that the share of goods imported from China by the average U.S. supplier (the solid black line) moved up over the past several years, in contrast to the decline recorded in the share of U.S. goods imports coming from China. For the average U.S. supplier, 14.5 percent of total goods imports came from China in 2017. This share rose to around 16.5 percent in 2020 and remained near that rate in 2021 and 2022. Meanwhile, China's share of U.S. goods imports went down from 22 percent to 17 percent during the same period.
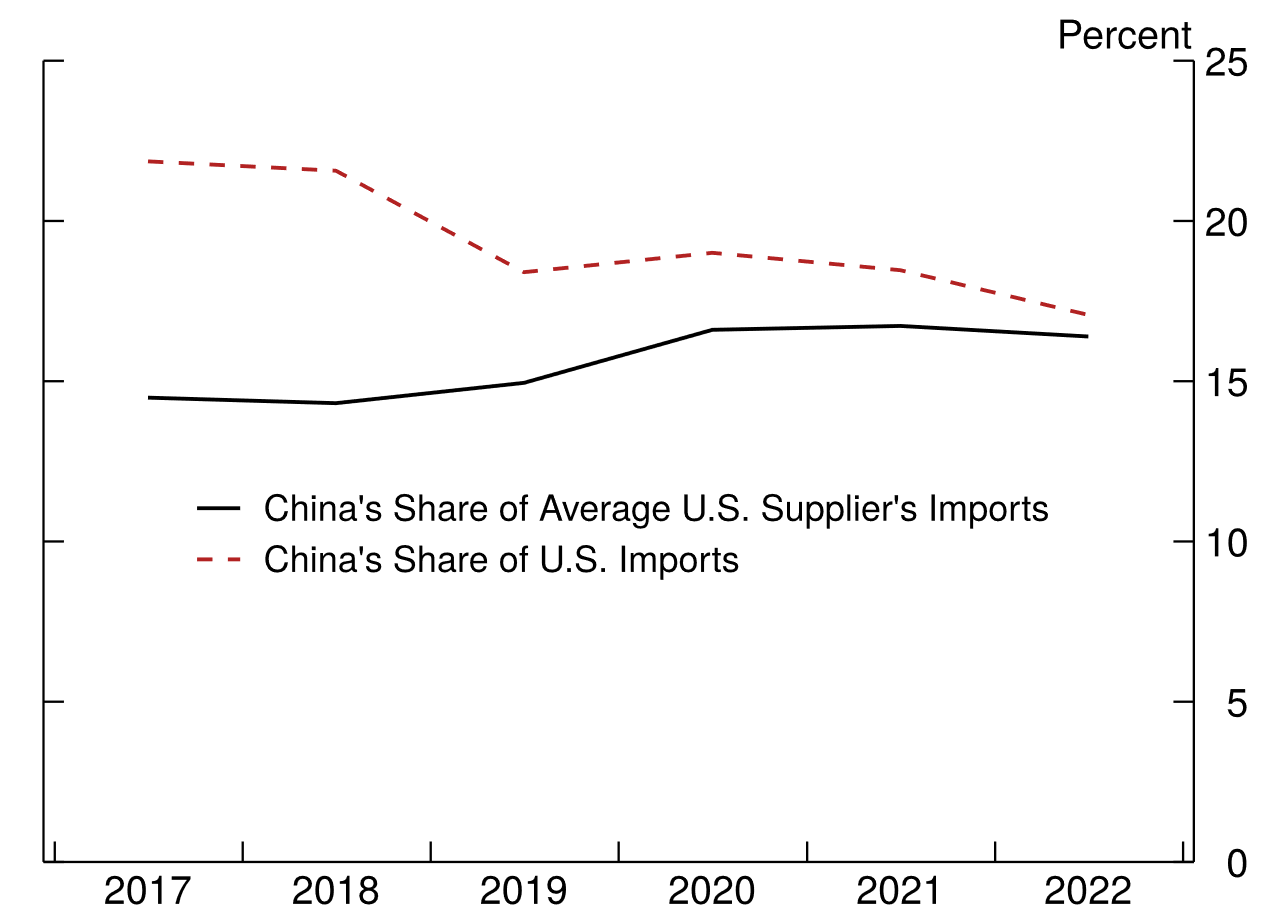
Source: U.S. Census Bureau and UN Comtrade; FRB Staff Calculations.
The finding that U.S. suppliers are importing more from China does not necessarily imply that U.S. imports from those countries contain more Chinese value added. To make that determination conclusively, we would need data on the Chinese value-added content of U.S. imports, which are not available after 2020. Nevertheless, we show that the import share from China has historically been a reasonable proxy for Chinese value added as a share of gross exports. Figure 2 presents, for selected regions and countries, China's share of total goods imports (solid red lines) and China's value-added embedded in gross exports (dashed blue lines) from 2012-2020.3 The two series followed similar trends during this period, suggesting that as these countries and regions increased the share of their imports from China, they also sourced more intensively Chinese intermediate inputs for production of the goods and services they export.4
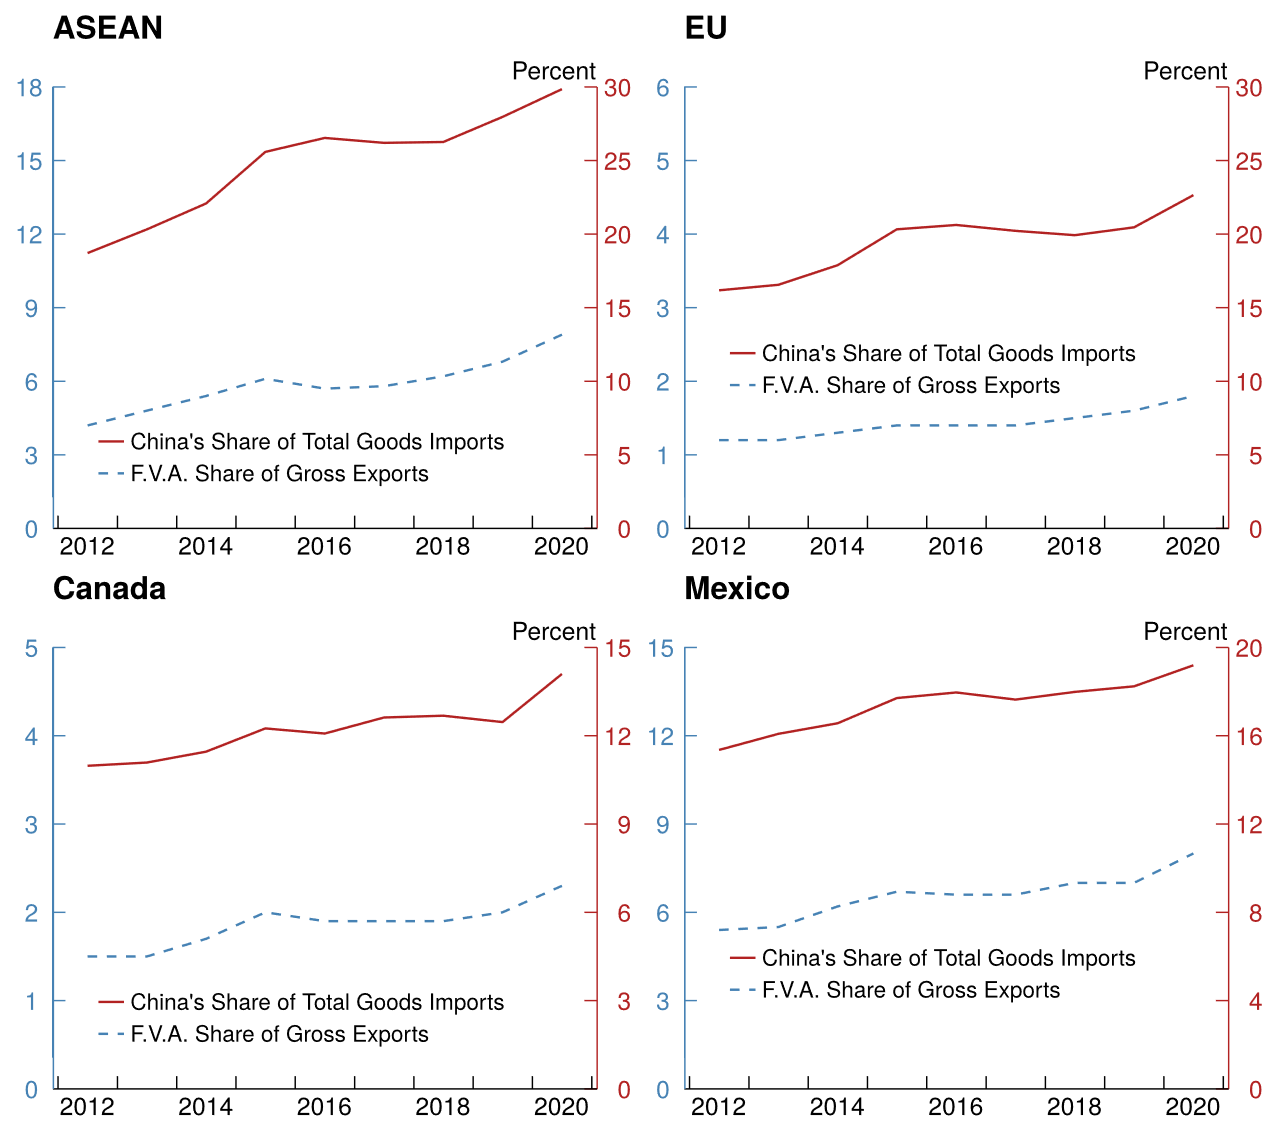
Note: F.V.A. stands for "foreign value added".
Source: OECD; UN Comtrade; FRB Staff Calculations
The most important U.S. suppliers increased their own reliance on Chinese goods
In the remainder of the note, we document that the increase in China's share of U.S. suppliers' imports reflect two factors. First, the most important U.S. suppliers have increased their own reliance on Chinese imports. Second, the U.S. has imported more from countries that have stronger trade ties with China. Later, we also show evidence suggesting that rerouting of Chinese goods toward the U.S. through other countries was quite limited.
Unlike the U.S., the largest U.S. suppliers have increased their own share of goods imports from China between 2017 and 2022, as shown in Figure 3.5 Germany, for example, increased its share of goods imports from China from 10.2% to 12%, while Vietnam saw an even greater increase from 27.5% to 32.8%. Japan is the only exception, with a decline in China's share from 24.5% to 21%, which largely took place in 2022.
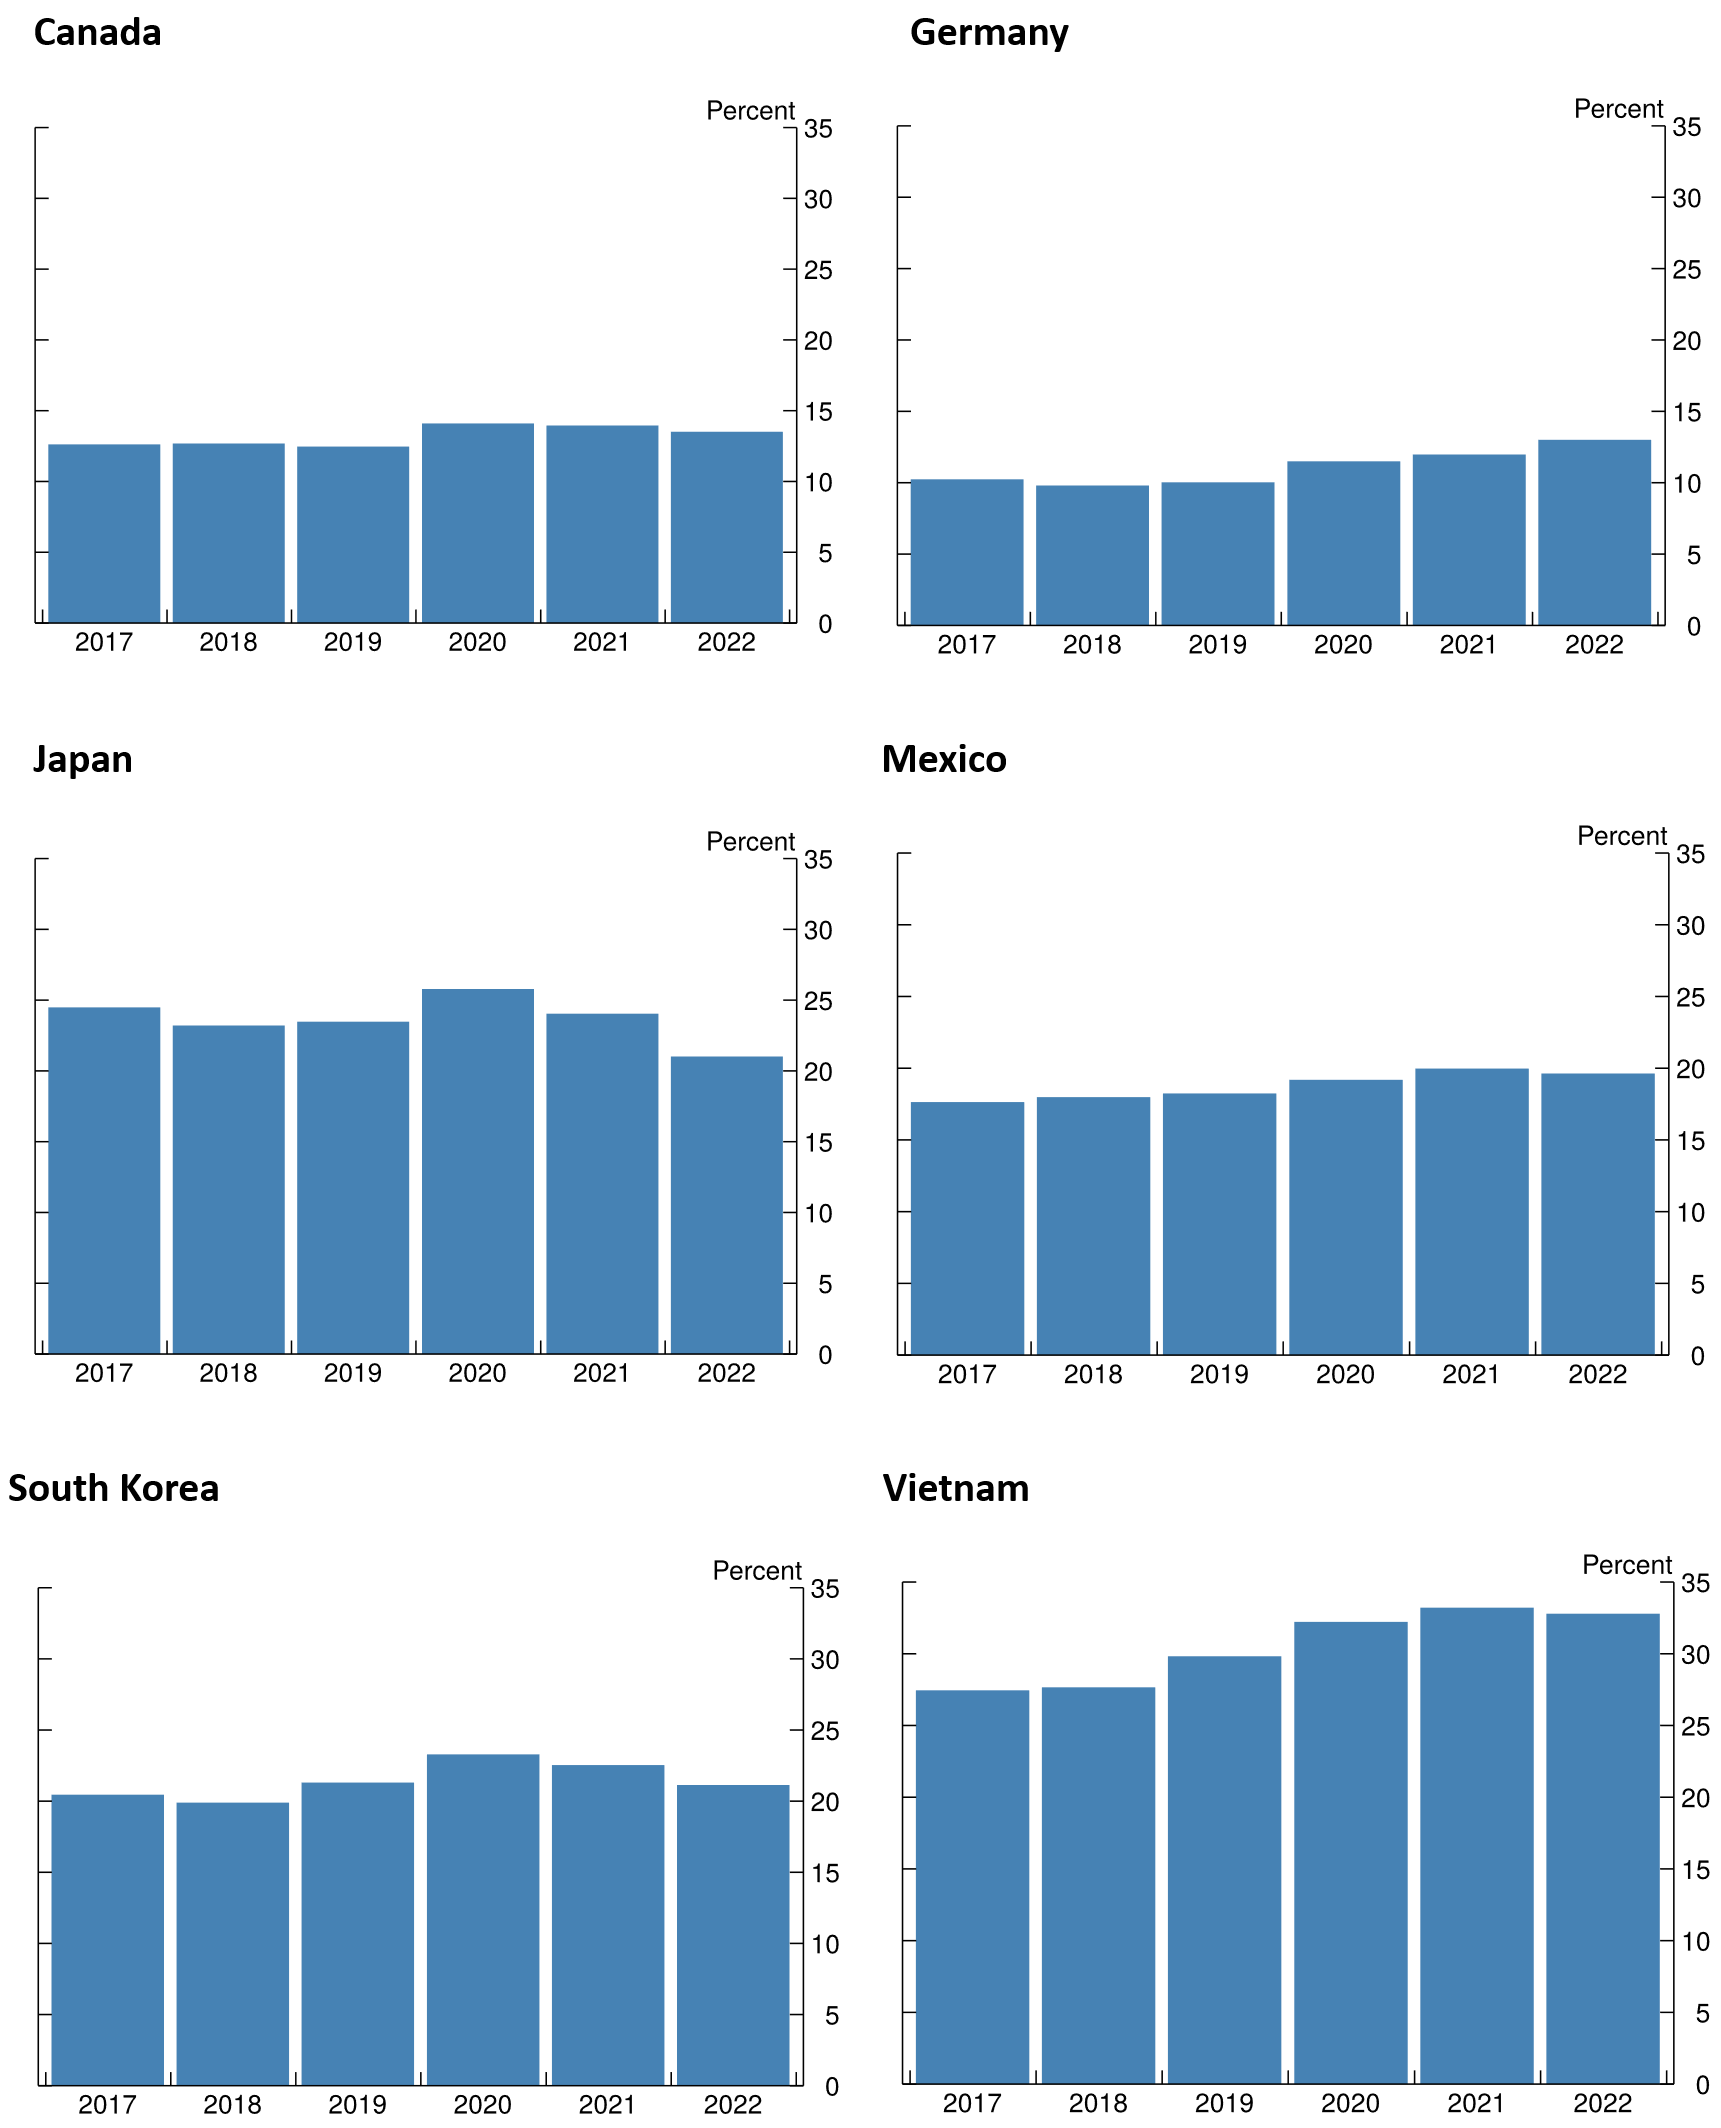
Note: The percent represents the share of total goods imports coming from China.
Source: UN Comtrade; FRB Staff Calculations.
The U.S. is shifting toward countries with relatively stronger trade ties to China
The U.S. is also shifting its trade towards countries that have traditionally had strong trade ties with China. Figure 4a shows the group of countries that have gained the most U.S. market share between 2017 and 2022: Vietnam, Taiwan, Canada, Mexico, India, and South Korea. Together, these countries represent a near 5.5 percentage point increase in U.S. market share, which more than accounts for the 5.1 percentage point decrease in China's U.S. market share over the same period.
Turning to Figure 4b, we see that these countries (save for Canada) import more from China than the average U.S. sourcing country, represented by the red dashed line at 14.5%. For example, Vietnam sourced 27% of its goods imports from China in 2017, well above average for a U.S. supplier. Thus, even if other countries' imports from China remain unchanged, a U.S. shift towards countries with stronger ties to China could potentially increase China's value-added content in U.S. goods imports.
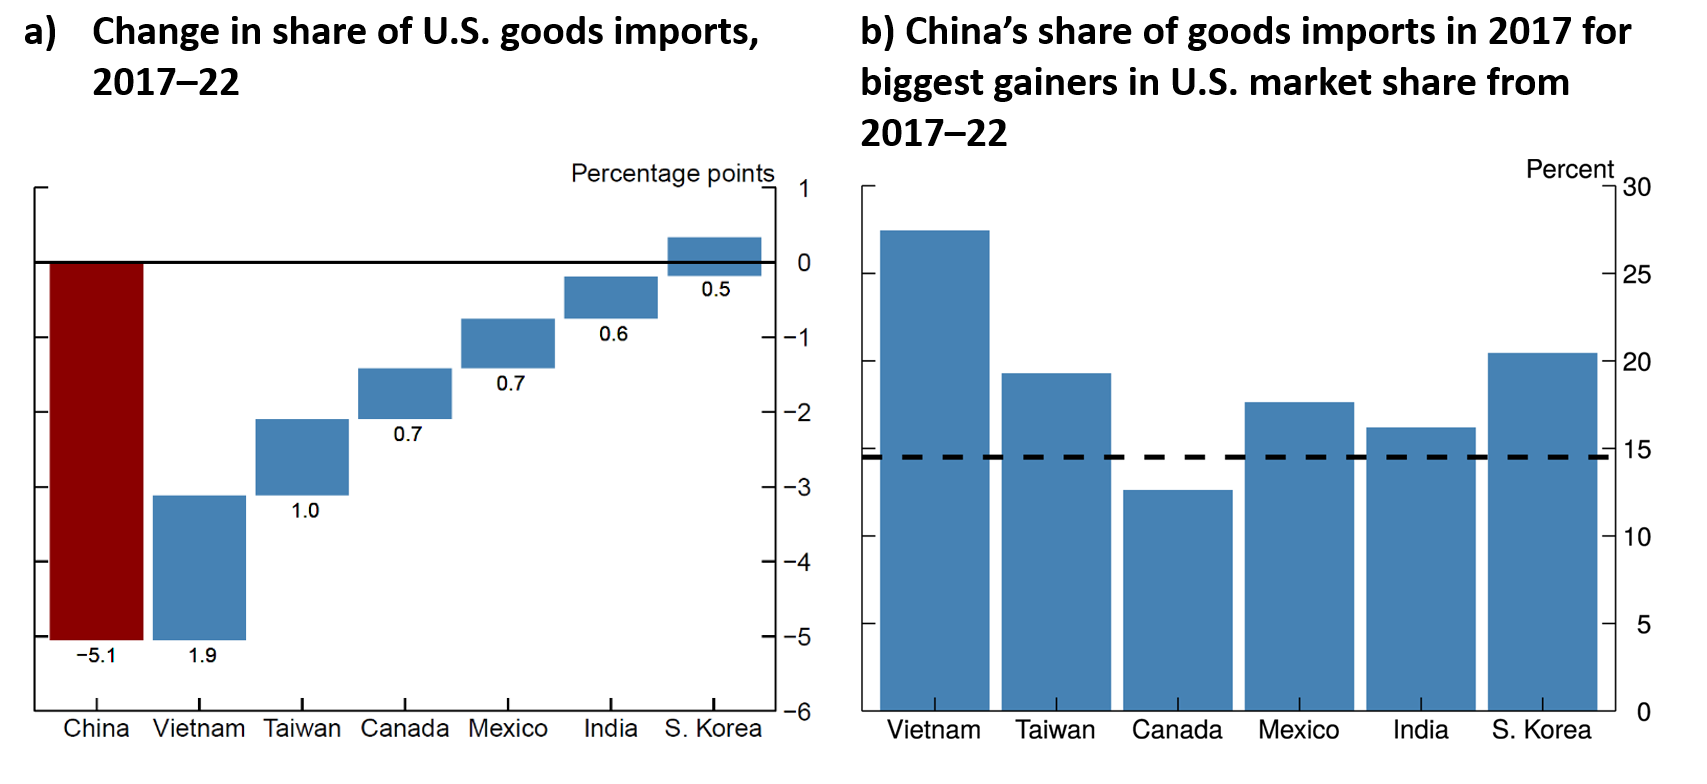
Note: The dashed line shows China's share of goods imports by the average U.S. source in 2017.
Source: U.S. Bureau of Economic Analysis and UN Comtrade; FRB Staff Calculations.
Quantifying the importance of each factor
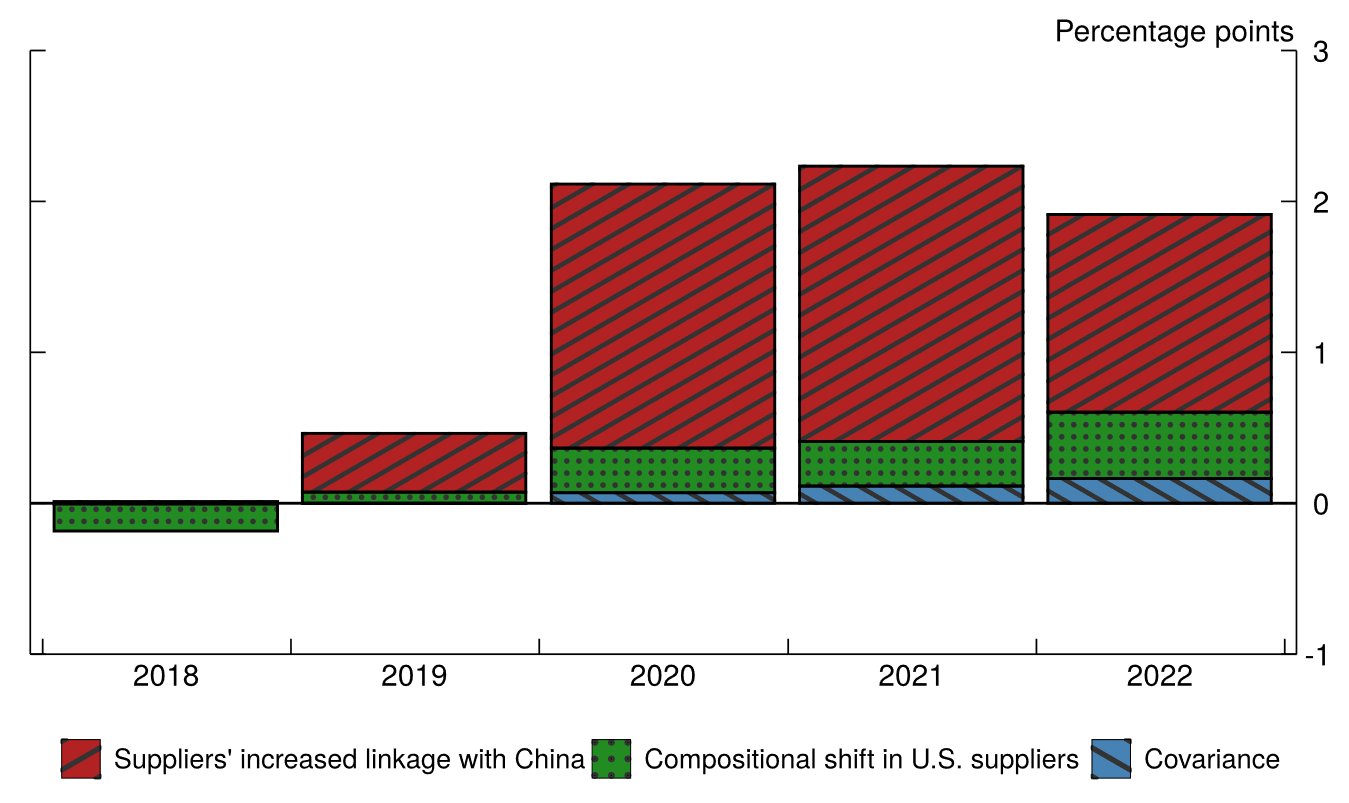
To quantify the importance of each factor on the average U.S. supplier's reliance on Chinese goods, we break down the change in China's share of goods imports by the average U.S. supplier into three components. Formally, the change in $$ s_t $$ between year $$ t $$ and a base year (year $$ 0 $$) can be written as:
$$$$ s_t-s_0=\ \sum_{k}{\left(CH_{kt}-CH_{k0}\right)w_{k0}}+\ \sum_{k}{CH_{k0}{(w}_{kt}-w_{k0})}+\ \sum_{k}\left(CH_{kt}-CH_{k0}\right)\left(w_{kt}-w_{k0}\right). $$$$
The first term captures the change in existing suppliers' reliance on Chinese goods documented in Section 3. This term is positive if relatively more important U.S. suppliers (i.e., higher $$ w_{k0} $$) increase their share of goods imports from China between year $$ t $$ and year $$ 0 $$.
The second captures the compositional shift effect documented in Section 4. This term is positive if U.S. market share is reallocated to suppliers with high initial Chinese share, $$ CH_{k0} $$. In the extreme case when China's lost market share in the U.S. is distributed evenly towards other suppliers, this term would be zero.
The third and last term captures the covariance between the changes in suppliers' linkage with China and their market shares in the U.S. It is positive if suppliers that import more (less) from China also gain more (less) U.S. market share, and negative otherwise. Thus, a positive covariance would be consistent with transshipment and/or firms moving final stage of production from China to other countries but still using inputs from China.6
Figure 5 presents the results. The bulk of the 2-percentage-point increase in China's import share for the average U.S. supplier between 2017 and 2022 is accounted by existing suppliers' increased linkage with China (the diagonally shaded red bars). Interestingly, this term picked up in 2020, despite China's COVID lockdown-related disruptions, arguably reflecting a surge in demand for goods during the pandemic in these economies, similar to what was observed in the United States (Aladangady and Garcia, 2020).
Though accounting for a smaller proportion, the compositional shift (the dotted green bars) increased in importance during 2017-2022. This finding suggests that the U.S. market share that China lost was not distributed evenly across U.S. suppliers, but disproportionally went to countries with relatively stronger ties with China.
Finally, a small, but non-negligible, share of the increase in China's import share for the average U.S. supplier comes from the covariance between the first two factors (the diagonally shaded blue bars). Put differently, those countries toward which the U.S. diverted its imports were the same ones through which China diverted its exports. This factor, however, is small—accounting for less than 0.2 percentage points even in 2022, supporting the view that any reconfiguration of supply chains away from China takes a longer time to materialize.
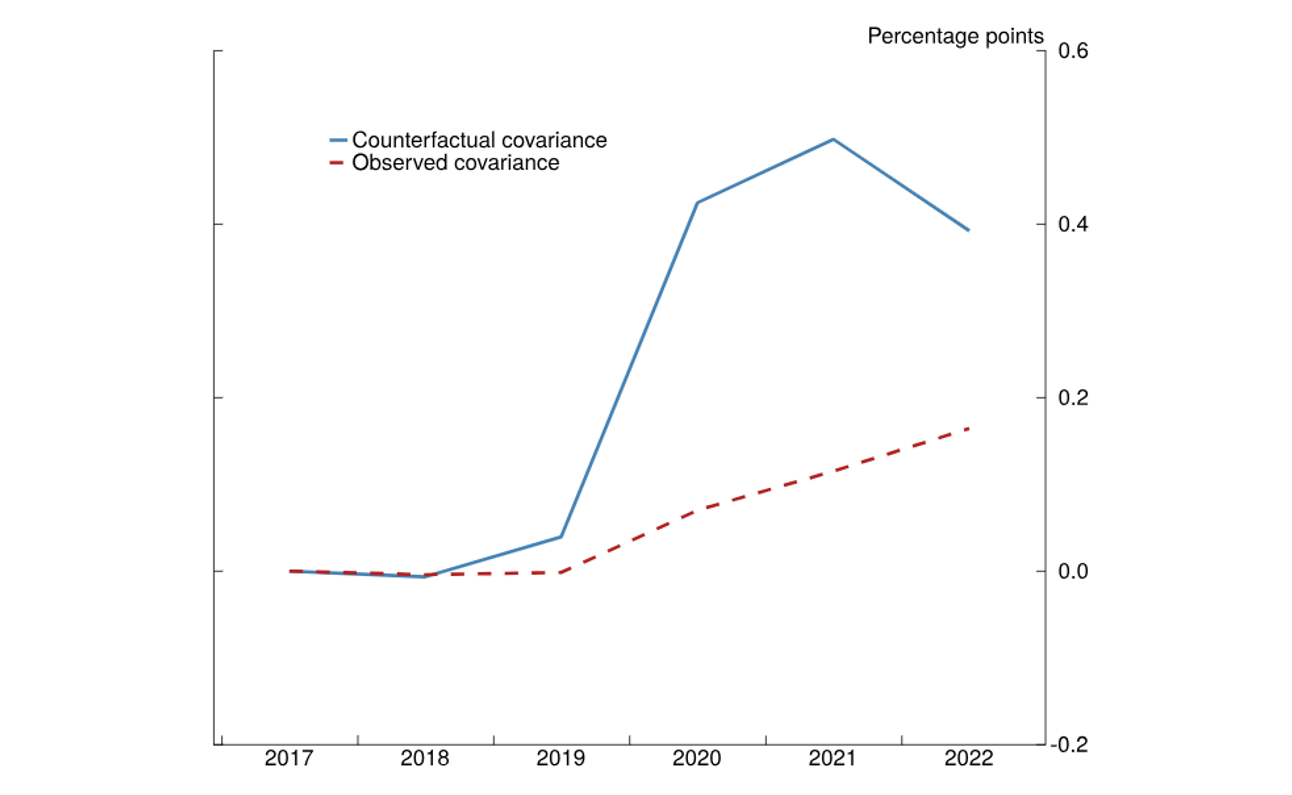
To give a sense of the magnitude, we compute the counterfactual covariance term in the extreme scenario that Chinese exports and U.S. imports are diverted solely to Vietnam and Mexico, the two countries often regarded as China's "backdoor".7 We expect that if the increase in U.S. suppliers' reliance on Chinese goods, seen in Figure 1, comes solely from Chinese exports being diverted from the U.S. to Vietnam and Mexico before flowing into the U.S, there would be a higher covariance between suppliers' increased linkage with China and U.S. compositional shift toward these countries. Indeed, Figure 6 shows that the counterfactual covariance (the solid blue line) is above the observed covariance (the dashed red line) and accounts for 0.4 percentage points in 2022, more than double that of the observed covariance.8 Given the difference between the data and this extreme counterfactual, it is not unlikely that the true extent of any reconfiguration happening is somewhere in between, a level which, while not negligible, is still small compared to the other factors previously mentioned. Nonetheless, this is something worth keeping in mind as new data inevitably comes in and shifts our understanding of the trade relationship between the U.S., China, and other third-party trading partners.
Source: UN Comtrade; FRB Staff Calculations.
Source: UN Comtrade; FRB Staff Calculations.
Discussion and Concluding Remarks
In this note, we document that the average U.S. supplier's import share from China increased 2 percentage points between 2017 and 2022. This finding suggests that China's value-added content in U.S. goods imports likely declined less than China's direct trade share. Nonetheless, despite the rhetoric of third-party countries serving as China's backdoor into the U.S., our findings also suggest that this is not the only factor that accounts for the increase in U.S. indirect reliance on Chinese goods.9
Other explanations are plausible. First, as argued in Hoang and Mix (2024), the 2018-2019 U.S. tariff hikes on Chinese goods might have created a negative demand shock to China, thus lowering its wages and prices and boosting imports of Chinese goods in third-party countries. Chinese capital and intermediate goods sold elsewhere would eventually end up in production of goods flowing into the U.S. In other words, U.S. suppliers' increased linkages with China might be an inevitable economic consequence of the trade war, which made Chinese goods cheaper for these countries.
Second, the U.S. disproportionally replacing Chinese goods with goods from Vietnam or Mexico might simply reflect that such countries are better substitutes to China than others.10 Consequently, countries that produce similar products might be more likely to be integrated in the same supply chains, which explains their strong trade ties with China.
In any case, our findings are not definitive and further investigation is needed. We would need direct evidence of Chinese investment in third countries and reconfiguration of supply chains. It would also be important to disentangle the effect of different policy changes (tariff hike, industrial policies, green transition, national security, etc.) and to distinguish them from China's natural rise in the global supply chain from a low cost, low value-added to a high value-added manufacturing location, as experienced in earlier decades by South Korea and Japan.
References
Aladangady, Aditya, and Daniel Garcia (2020). "The Unusual Composition of Demand during the Pandemic," FEDS Notes. Washington: Board of Governors of the Federal Reserve System, January 14, 2021.
Alfaro, Laura, and Davin Chor (2023). "Global Supply Chains: The Looming 'Great Reallocation'", NBER Working Paper No. w31661.
Fajgelbaum, Pablo, Pinelopi Goldberg, Patrick Kennedy, Amit Khandelwal, and Daria Taglioni. 2024. "The US-China Trade War and Global Reallocations." American Economic Review: Insights, 6 (2): 295–312.
Freund, Caroline, Aaditya Mattoo, Alen Mulabdic, and Michele Ruta (2023a). "Is US Trade Policy Reshaping Global Supply Chains?," Policy Research Working Paper Series 10593, The World Bank
Freund, Caroline, Aaditya Mattoo, Alen Mulabdic, and Michele Ruta (2023b). "U.S.-China decoupling: Rhetoric and reality," VoxEU.org, August
Haberkorn, Flora, Trang Hoang, Gordon Lewis, Carter Mix, and Dylan Moore (2024). "Global trade patterns in the wake of the 2018-2019 U.S.-China tariff hikes," FEDS Notes. Washington: Board of Governors of the Federal Reserve System, April 12, 2024.
Hoang, Trang, and Carter Mix (2024). "Trade Wars and Rumors of Trade Wars: The Dynamic Effects of the U.S.-China Tariff Hikes", Working paper. https://drive.google.com/file/d/1KlXCvNDJBFbEZh78yCCCRWLCc3o2GiCc/view
1. This trend has also been widely discussed in news media. For example, The Economist published an article in February 2024 titled How Trump and Biden have failed to cut ties with China, arguing that Vietnam might just "play a role as a conduit, matching Chinese production to American demand". Return to text
2. In practice, some countries with missing data any year between 2017 and 2022 are excluded. The final sample includes 140 countries in total. Our estimates are robust when we use all available data. Return to text
3. We chose these regions based on data availability and their importance as U.S. suppliers. Return to text
4. While the trend over time for both series are similar, China's share of imports rose faster than its valued-added share of gross exports, especially in Canada and in the European Union, suggesting that some import growth went into domestic consumption and investment. Return to text
5. By nominal goods import values in 2022, for the share of U.S. goods imports coming from these countries are Mexico (13.6%), Canada (13.2%), Japan (4.6%), Germany (4.5%), Vietnam (4%), and South Korea (3.6%). Return to text
6. The positive correlations between suppliers' linkage with China and suppliers' market share in the U.S. has been documented by others as evidence for rerouting. For example, Alfaro and Chor (2023) pointed to China's increased share of imports by Vietnam and Mexico and these countries' increased exports to the U.S. as suggestive evidence that these countries might serve as the backdoor for Chinese exporters. Return to text
7. To compute the counterfactual covariance, we keep U.S. composition of imports and China's share of third-party countries' imports in 2017 the same as data. We make two assumptions: (1) Except for Vietnam and Mexico, China's share of third-party countries stayed constant at 2017 level; (2) Vietnam and Mexico gain equal U.S. market shares between 2017-2022 (and by construction, other countries would lose market shares), which are calibrated to match China's share of average U.S. supplier's imports (the black line in Figure 1). Return to text
8. The other extreme case—either Chinese exports or U.S. imports being diverted evenly across third-party countries—would imply zero covariance. Return to text
9. An important caveat of our analysis is that we have not considered Chinese investments in third-party countries, and thus we may potentially underestimate the extent to which these countries rely on China for both goods and investment. Return to text
10. Fajgelbaum et al (2024) show that countries benefit most from the U.S.-China tariff hikes in terms of export growth if they respond as substitutes to U.S. and China production and operate along downward-sloping supply curves. Return to text
Hoang, Trang, and Gordon Lewis (2024). "As the U.S. is Derisking from China, Other Foreign U.S. Suppliers Are Relying More on Chinese Imports," FEDS Notes. Washington: Board of Governors of the Federal Reserve System, August 02, 2024, https://doi.org/10.17016/2380-7172.3498.
Disclaimer: FEDS Notes are articles in which Board staff offer their own views and present analysis on a range of topics in economics and finance. These articles are shorter and less technically oriented than FEDS Working Papers and IFDP papers.