FEDS Notes
March 28, 2025
Do People Care More About Inflation or Wage Growth?
Nicolas Lewin, Jacob Orchard, and Kabir Dasgupta1
Following the COVID-19 pandemic, consumer sentiment was low despite historically low unemployment and high wage growth. This same period coincided with inflation rates that were the highest in a generation. Do consumers care more about high inflation rates than high wage growth and low unemployment?2
We utilize micro-data from the University of Michigan's Surveys of Consumers (hereinafter referred to as the Surveys of Consumers) alongside education group-specific inflation rates, rates of wage growth similar to the Atlanta Fed Wage Growth Tracker constructed from the Current Population Survey (CPS), and unemployment rates also from the CPS – all at the monthly level – to study the relationship between objective price and wage pressures, and subjective well-being measures. We find that a consumer's education-group specific inflation rate is more predictive of their well-being than the education-group specific unemployment rate or wage growth. When we look into the link between objective and subjective well-being measures by different individual-level characteristics such as age and homeownership status, we find that homeowners' subjective well-being is more sensitive to both changes in their education-specific wage growth and inflation rates than renters.
1. Education Group: Financial Well-Being, Inflation, and Wage Growth
We use monthly data from the Surveys of Consumers to construct measures of financial well-being for consumers by three distinct education groups – (1) "college", which refers to individuals who have completed a bachelor's degree or higher; (2) "some college", which refers to individuals who have some college credits and those who have graduated with an associates degree, but not a bachelors; and (3) "no college", which refers to individuals who have a high-school degree or did not graduate from high-school.3 Figure 1 shows the proportion of individuals in each of these education groups that say they are financially worse off than one year ago from the late 1990s until 2024.4 We see that for all education groups over this period, the proportion saying they were worse off was lowest in the early 2000s and immediately prior to the COVID-19 pandemic. We see large increases in the share of consumers reporting that they were worse off during the 2008 financial crisis and in the wake of the COVID-19 pandemic (the onset of which is denoted by the vertical blue line).
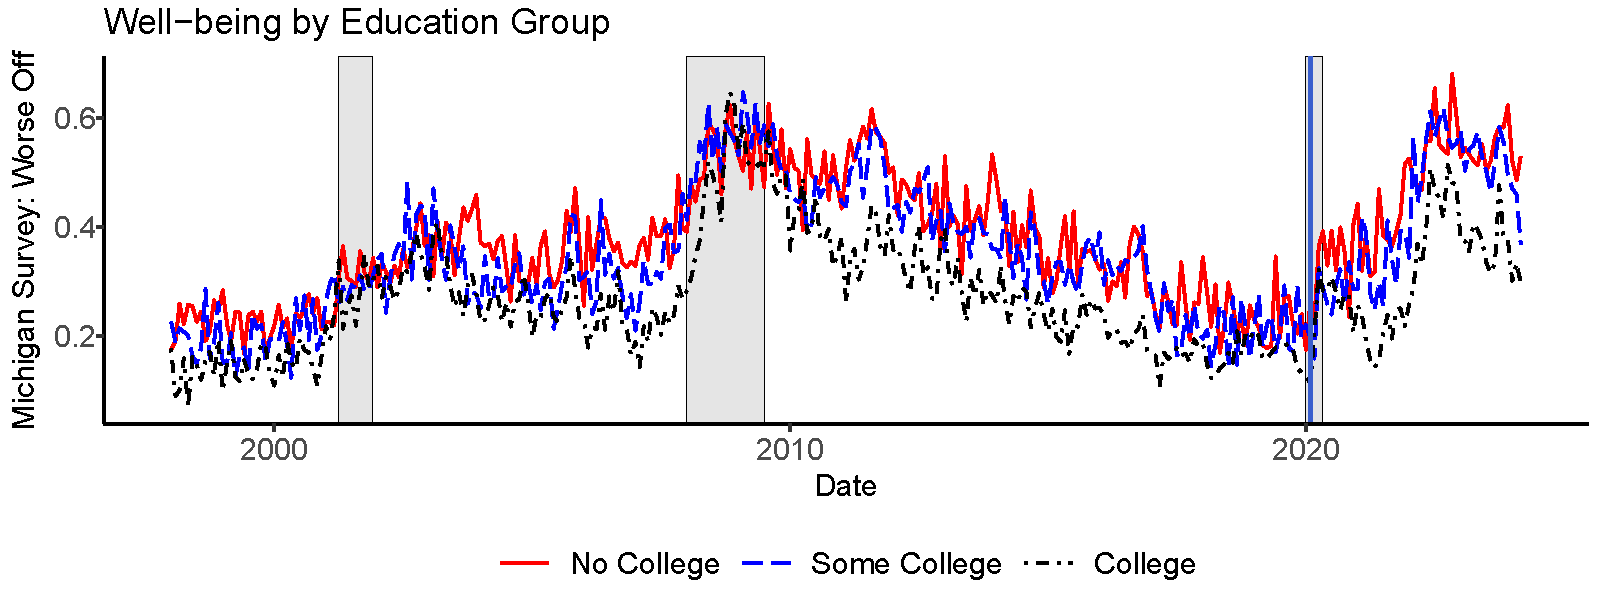
Note: The shaded bars indicate periods of business recession as defined by the National Bureau of Economic Research (NBER): March 2001–November 2001, December 2007–June 2009, and February 2020–April 2020
Source: Michigan Surveys of Consumers and authors' calculations
For most months observed in the period covered by Figure 1, we see that individuals in the "non-college" educated group have the highest proportion saying they are "worse-off". However, the gap in the well-being measure between college and non-college individuals varies considerably over time. For example, the gap disappears during the Great Financial Crisis, but grows in the wake of the pandemic.
The increase in the gap of self-reported well-being after the onset of the pandemic between "non-college" and "college" educated individuals can be perplexing because non-college educated individuals had the highest wage growth over this period (see the middle panel in figure 2), whereas prior to the COVID-19 pandemic "non-college" individuals' wage growth was generally below the wage growth of other groups.5 However, we also construct inflation experienced by each of the education groups by reweighting CPI categories to reflect education group consumption patterns6 and we find that the "non-college" educated group's 12-month inflation rate reached 3/4 of a percentage point higher than the inflation rate of "college" educated individuals. The gap in inflation experienced between the high- and the low-educated individuals is not unique to the period following the onset of the COVID-19 pandemic, but it does mean that the real-wage gains for each education group (shown in the bottom panel of figure 2) were roughly similar during this period, as the higher inflation for "non-college" educated individuals eroded any of the decrease in real-inequality coming from higher wage growth for that group.
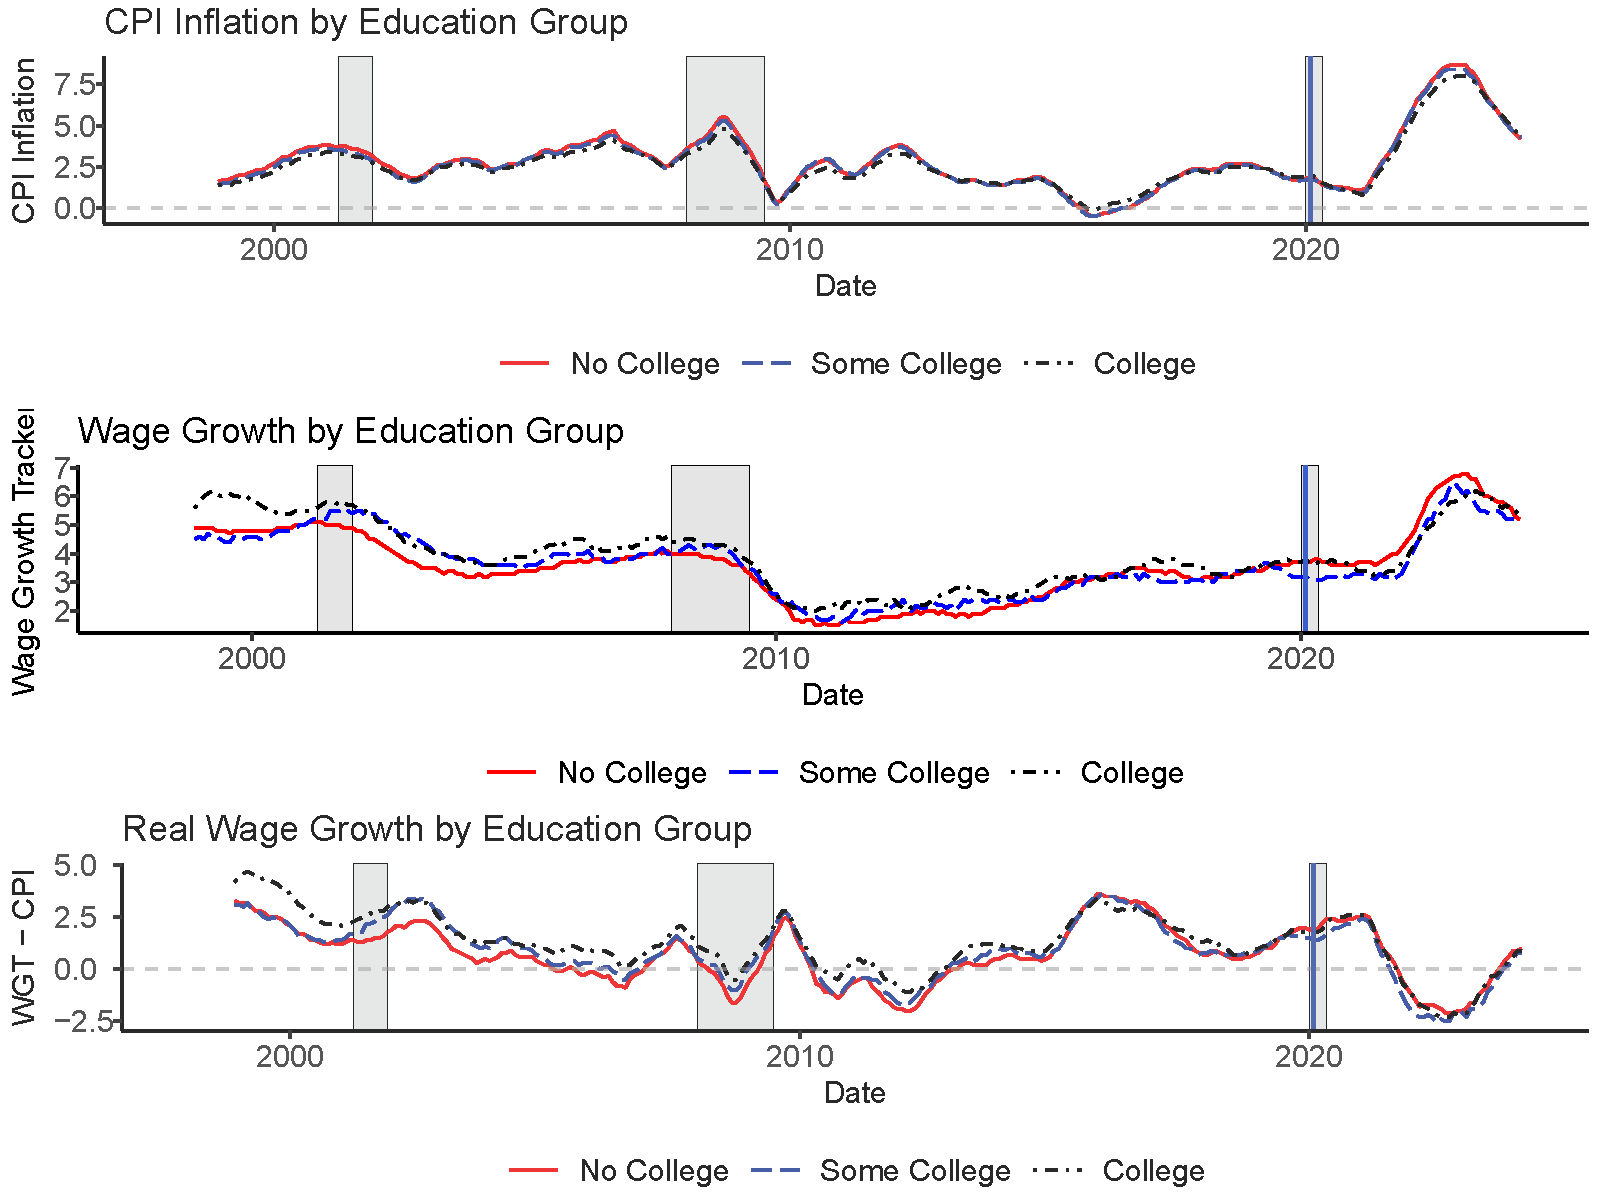
Note: The shaded bars indicate periods of business recession as defined by the National Bureau of Economic Research (NBER): March 2001–November 2001, December 2007–June 2009, and February 2020–April 2020. All panels show 12-month rates of change.
Source: BLS and authors' calculations
2. Relationship between education group relative well- being and relative inflation
Figure 3 shows the difference between "college" and "non-college" educated groups for education group CPI inflation and education group median wage growth. Generally, inflation has been lower for college-educated individuals, as seen by the red line being below zero for much of the time period. This is also true post-2020 as the 12-month inflation rate for non-college-educated consumers reached almost 3/4 of a percentage point more than college-educated consumers. On the other hand, wage growth is higher for college-educated consumers, shown by the green line being above zero for most of the time period, but it has been higher for non-college educated consumers since the pandemic. These two changes work in conjunction to drive up the difference in real wage growth between college and non-college educated consumers prior to the pandemic, and to equalize real wage growth since the pandemic. By plotting the difference between education groups, we "net-out" any trends that may occur across all education groups across time. This "netting-out" of trends across education groups and time is more formally done below using a fixed-effects logistic regression model.
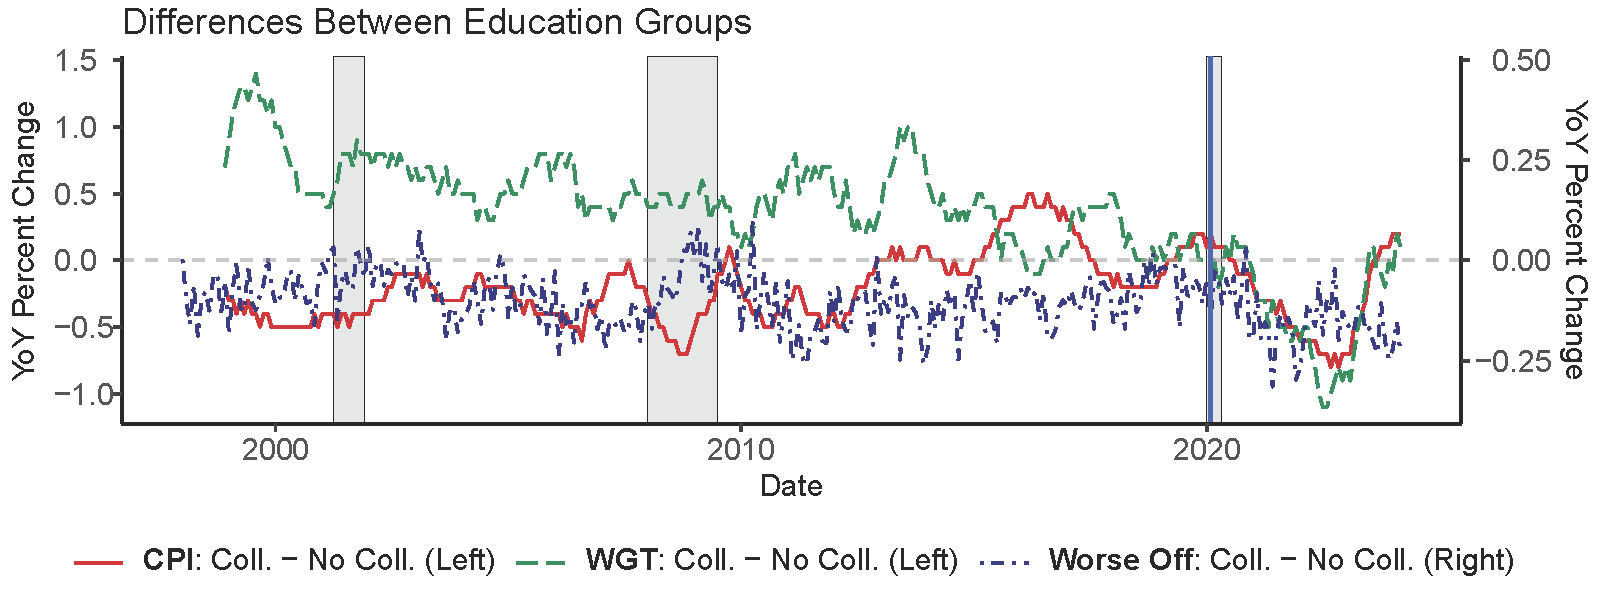
Note: The shaded bars indicate periods of business recession as defined by the National Bureau of Economic Research (NBER): March 2001–November 2001, December 2007–June 2009, and February 2020–April 2020.
Source: BLS and authors' calculations.
Our regression framework allows us to test how differential rates of inflation and wage growth relate to consumers' subjective well-being by "netting-out" aggregate shocks that are common across education groups. We use the data introduced in previous sections, along with some demographic controls, to study the relationship between wages and inflation, and well-being. The worse off well-being variable is measured at the individual level,7 while wage growth and the inflation rate are proxied by assigning to each individual the wage growth and inflation rate of their education group. We include the education group specific unemployment rate to control for labor market conditions particular to the households' education groups. We additionally include an interaction between the growth rate of the S&P500 index8 and the education group as a proxy for changes in household wealth.9 We also include the level of household income. Finally, as mentioned above, we include time and education group fixed-effects, as well as a linear time trend, to control for time-varying factors, factors that vary across education groups, and education group-specific trends across time.
Standard economic theory suggests that consumers have lower utility when they have lower real wages. Thus, we would expect the coefficient on the education group CPI variable to be positive and the coefficient on the education group wage growth tracker variable to be negative as higher inflation should make consumers worse off financially and higher wage growth should make them better off. If consumers care solely about real wage growth, then the absolute size of the coefficients on education group CPI and wage growth should be similar.
Table 1 shows the relationship between a household reporting they are financially worse off than a year prior and their education group's inflation rate and wage growth over that same period. The signs of the coefficients on education group CPI and wage growth are consistent with standard economic theory in the pre-pandemic period, but consumers seem to be more sensitive to wage growth: a 1 percentage point increase in a consumer's education group relative inflation rate is associated with a 1 percentage point increase in the likelihood of reporting that they are financially worse off and a 1 percentage point increase in the education group relative wage growth is associated with a 5 percentage point decrease in the likelihood of reporting that they are financially worse off. In contrast, when we include the entire sample (1999-2024) the magnitude of the inflation coefficient increases by a factor of more than three (to 0.04), while the magnitude of the wage growth measure is halved (to -0.02). This provides suggestive evidence that the average consumer may have placed less weight on nominal wage growth than on inflation in the period following the pandemic compared to the pre-pandemic period, even after controlling for factors that vary across education groups and across time. It is possible that consumers are more sensitive to their education group specific inflation rate when aggregate inflation is high and becomes more salient.
Table 1: Subjective Well-being, and Education-Group Level Inflation and Wage Growth
| Worse Off Micro Data |
||
|---|---|---|
| (1) 1999-2019 | (2) 1999-2024 | |
| Right hand side variables: | ||
| Education Group CPI | 0.011∗∗ | 0.037∗∗∗ |
| (0.004) | (0.003) | |
| Education Group Wage Growth | -0.048∗∗∗ | -0.017∗∗∗ |
| (0.005) | (0.006) | |
| Education Group Unemployment Rate | 0.024∗∗∗ | 0.026∗∗∗ |
| (0.002) | (0.004) | |
| Household Income | -0.097∗∗∗ | -0.093∗∗∗ |
| (0.003) | (0.003) | |
| Education Group FE | Yes | Yes |
| Time FE | Yes | Yes |
| Education Group Time Trend | Yes | Yes |
| ∆ S&P 500 × Education Group | Yes | Yes |
| Household Demographic FE | Yes | Yes |
| Observations | 113,193 | 140,376 |
Notes: FE – Fixed effects. These columns show marginal effects from logit regressions. The unit of observation is the household by month survey response. Household demographic FE include sex, homeownership, and age FE. Standard errors, in parentheses, are clustered at the time level. Significance at the 1, 5, and 10 percent levels indicated by ***,**, and *.
3. Do certain demographic groups care more about inflation?
Next, we test whether the relationship between subjective well-being and the education group relative inflation and wage growth is stronger for various economic and demographic groups. We find that the relationship between a consumer's financial well-being and both their education group's inflation rate and wage growth is more pronounced for homeowners than renters.
We do not find economic or statistically significant results for consumers over the age of 55 compared to other consumers. In Table 2, columns one and two include the full sample data.10
Table 2: Demographic Heterogeneity: Subjective Well-being, inflation, and wage-growth
| Worse-off Micro data 1999-2024 |
||
|---|---|---|
| (1) | (2) | |
| Right hand side variables | ||
| Educ. CPI × Home-owner | 0.016*** | |
| (0.003) | ||
| Educ. CPI × 55+ | 0.004 | |
| (0.003) | ||
| Education Group CPI | 0.025*** | 0.035*** |
| (0.003) | (0.003) | |
| Educ. WGT × Homeowner | 0.025*** | |
| (0.004) | ||
| Educ. WGT × 55+ | 0.001 | |
| (0.004) | ||
| Education Group Wage Growth | 0.002 | -0.017*** |
| (0.007) | (0.006) | |
| Education Group FE | Yes | Yes |
| Time FE | Yes | Yes |
| Education Group Time Trend | Yes | Yes |
| ∆S&P 500 × Education Group | Yes | Yes |
| Household Demographic FE | Yes | Yes |
| Wage Growth, UR, and Income | Yes | Yes |
| Observations | 140,376 | 140,376 |
Notes: FE – Fixed effects. The unit of observation is the household by month survey response. All columns show marginal effects from logit regressions. Household demographic FE include sex, home-ownership, and age FE. All regressions include the levels of the interacted variables. Standard errors, in parentheses, are clustered at the time level. Significance at the 1, 5, and 10 percent levels indicated by ***,**, and *.
Column one shows the additional relationship between well-being and education group CPI and wage growth for homeowners compared to renters. We find that for homeowners, a 1 percentage point increase in consumers' education group relative inflation results in an additional 1.6 percentage points increase in the likelihood to report feeling financially worse off. We also find that homeowners are more sensitive to their education group's wage growth than renters, while the coefficient on the non-interacted wage growth term is close to zero. Comparing this result to Table 1, implies that most of the relationship we found between well-being and wage growth was due to responses by homeowners.
References
Autor, D., Dube, A., and McGrew, A. (2023). The unexpected compression: Competition at work in the low wage labor market.
Guerreiro, J., Hazell, J., Lian, C., and Patterson, C. (2024). Why do workers dislike inflation? wage erosion and conflict costs.
Orchard, J. (2022). Cyclical demand shifts and cost of living inequality. Available at SSRN 4033572.
1. Correspondence: [email protected]. The views expressed in this note are solely those of the author and should not be interpreted as reflecting the views of the Board of Governors of the Federal Reserve System or of anyone else associated with the Federal Reserve System. Return to text
2. Guerreiro et al.(2024) argue that the negotiations with an employer that occur when advocating for higher wages to offset the loss of purchasing power due to inflation is a cost of inflation that is not reflected in real-wage changes. Return to text
3. The Survey of Consumers asks "We are interested in how people are getting along financially these days. Would you say that you (and your family living there) are better off or worse off financially than you were a year ago?" Responses are coded as: "better of", "worse off", and "the same". We show the share in each education group that say they are "worse-off." Return to text
4. We begin the data in the late 1990s as that is when the education level demographic variable is available in the consumer expenditure survey (CEX), which we will use to create inflation measures by educational group. Return to text
5. This reversal in the wage growth relationship was colloquially attributed to less-educated workers performing jobs that were often more exposed to the COVID-19 virus, or deemed "essential" to the functioning of society during the pandemic period and as a result gave them more bargaining power over wages. See Autor et al. (2023). Return to text
6. We use the consumption categories in Orchard (2022) to construct education-group inflation rates. Return to text
7. We also run these regressions using the corresponding better off well-being variable from the Survey of Consumers, and find similar results in the opposite direction for variables of interest. Return to text
8. The S&P 500 Index is a product of S&P Dow Jones Indices LLC and/or its affiliates and has been licensed for use by the Board. Copyright ©201(x) S&P Dow Jones Indices LLC, a subsidiary of the McGraw Hill Financial Inc., and/or its affiliates. All rights reserved. Redistribution, reproduction and/or photocopying in whole or in part are prohibited without written permission of S&P Dow Jones Indices LLC. For more information on any of S&P Dow Jones Indices LLC's indices please visit www.spdji.com. S&P® is a registered trademark of Standard & Poor's Financial Services LLC and Dow Jones® is a registered trademark of Dow Jones Trademark Holdings LLC. Neither S&P Dow Jones Indices LLC, Dow Jones Trademark Holdings LLC, their affiliates nor their third party licensors make any representation or warranty, express or implied, as to the ability of any index to accurately represent the asset class or market sector that it purports to represent and neither S&P Dow Jones Indices LLC, Dow Jones Trademark Holdings LLC, their affiliates nor their third party licensors shall have any liability for any errors, omissions, or interruptions of any index or the data included therein. Return to text
9. This interaction term will control for the typical relationship between changes in the S&P 500 and Subjective well-being for households of that educational group. Return to text
10. The coefficients on interactions between home-ownership and 55+ years of age, and education group CPI do not change by much when also restricting those regressions to more recent data representing the post-2016 period. Return to text
Lewin, Nicolas, Jacob Orchard, and Kabir Dasgupta (2025). "Do People Care More About Inflation or Wage Growth?," FEDS Notes. Washington: Board of Governors of the Federal Reserve System, March 28, 2025, https://doi.org/10.17016/2380-7172.3701.
Disclaimer: FEDS Notes are articles in which Board staff offer their own views and present analysis on a range of topics in economics and finance. These articles are shorter and less technically oriented than FEDS Working Papers and IFDP papers.