FEDS Notes
March 21, 2025
Fragmentation? Revisiting the Ideal Point Distance measure of geopolitical distance1
Florencia S. Airaudo, François de Soyres, Keith Richards, and Ana Maria Santacreu
1. Introduction
In recent years, there has been growing interest in investigating the extent of geoeconomic fragmentation, defined as a policy-driven reversal of global economic integration. While world trade relative to GDP has remained relatively stable, geoeconomic fragmentation may manifest through the reconfiguration of trading patterns (Aiyar et al. (2023), Gopinath et al. (2025)).
A common approach in the literature to identify groups of geopolitically aligned countries is to analyze the similarity of their voting patterns in the United Nations General Assembly (UNGA), which serves as a proxy for bilateral political attitudes. A widely used methodology, developed by Bailey et al. (2017), employs a spatial voting model to estimate each country's "ideal point" on a policy spectrum. The geopolitical distance between two countries, called the Ideal Point Distance (IPD), is calculated as the absolute difference between their ideal points. Smaller values for IPD distance indicate closer geopolitical alignment. Although this approach provides a quantitative framework for assessing geopolitical relationships, its application to analyzing geoeconomic fragmentation requires careful consideration of methodological choices.
This note shows that methodological choices, such as time span and vote selection in IPD estimation, can affect conclusions about geoeconomic fragmentation.
2. Alternative specifications of IPDs and alignment blocs
Bailey et al. (2017) estimate IPD using a spatial voting model applied to historical roll-call votes in the UNGA.2 Their approach assumes that each country has an ideal point representing its geopolitical preferences, which can evolve gradually over time. These ideal points are inferred from historical voting patterns using a Bayesian estimation approach based on observed voting behavior. Since the estimation depends on past votes to determine each country's position, the choice of the training sample is critical, as is the composition of the voting agenda, since shifts in the topics of UNGA resolutions over time may influence the estimated geopolitical distances.
To illustrate the importance of these factors, we revisit the question of whether trade and financial flows are fragmenting along geopolitical lines using different IPD measures. We start with a baseline definition of geopolitical distance that closely follows the metric used in other studies, notably Gopinath et al. (2025), and then consider three alternatives to our baseline measure. The baseline IPD uses UNGA voting data from 1946-2023 in the estimation, incorporating all vote categories, with IPD values measured in 2021.
The first alternative focuses on IPD values from 2023 rather than 2021. This specification offers a key advantage: it allows us to capture recent geopolitical realignments, particularly those following Russia's invasion of Ukraine or escalating U.S.-China tensions, which may not be fully reflected in the 2021 baseline measure.
The second alternative narrows the focus to economic votes while maintaining historical coverage from 1971 onwards.3 This specification provides two distinct advantages over the baseline. First, it allows us to test whether countries' voting patterns on economic issues differ systematically from their overall voting behavior. Second, economic votes may better reflect true geoeconomic alignment since they directly concern international economic cooperation, trade relations, and development issues. This could reveal whether some countries that appear aligned on general issues in the baseline measure diverge specifically on economic matters.
The third alternative shortens the historical window used in the IPD estimation to begin after the Cold War (1990–2023) while maintaining all vote categories. It acknowledges that historical voting patterns from the Cold War era might not be relevant for understanding contemporary geopolitical alignments.
To understand how countries position themselves between the United States and China, we developed a normalized alignment score called seg(s). This score measures how much a country (s) leans toward either U.S. or China based on their geopolitical distances. The formula compares the difference in a country's distance from the US versus the difference from China, divided by their total distance from both countries:
$$$$seg(s) = \frac{IPD(s, China) – IPD(s, U.S.)}{IPD(s, U.S.) + IPD(s, China)}$$$$
The resulting score ranges from -1 to 1: a score of -1 indicates complete alignment with China, while a score of 1 shows perfect alignment with the United States. Countries with scores near zero suggest a more balanced or neutral position between the two countries.
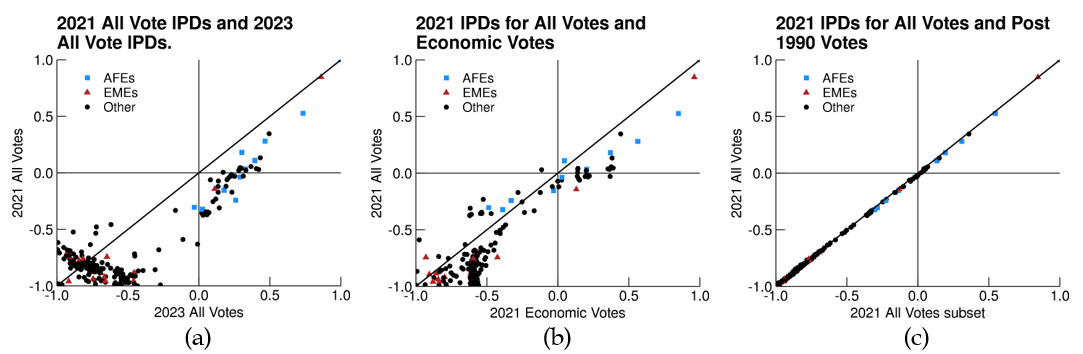
Figure 1 shows how geopolitical alignment as measured by our $$seg$$ metric differs between various IPD definitions. The vertical axis in all subfigures represents geopolitical alignment using the baseline IPD measure. The horizontal axis varies across subfigures: in (a), geopolitical alignment is obtained using the first alternative, the 2023 IPD values; in (b), geopolitical alignment is obtained using economic votes only; and in (c), geopolitical alignment using only post-1990 votes. Each point represents a country. Countries positioned above the 45-degree line show stronger alignment with China in the alternative measure compared to the baseline IPD, while those below the 45-degree line are more aligned with the U.S. in the alternative measure.
Left Chart
Note: IPDs are estimated from all UN Votes 1946-2023.
Source: Bailey et al.(2017) and authors' estimates.
Middle Chart
Note: X-axis estimated with econ. votes from 1971 onward.Y-axis estimated with all votes from all sessions.
Source: Bailey et al.(2017) and authors' estimates.
Right Chart
Note: X-axis estimated with all votes from 1991 onward. Y-axis estimated with all votes from all sessions.
Source: Bailey et al.(2017) and authors' estimates.
Subfigure (a) shows that from 2021 to 2023, countries shifted closer to the U.S., albeit from a strong-China starting point. This trend is especially pronounced for Advanced Foreign Economies (AFEs) (light blue dots).4 This pattern suggests that recent geopolitical developments—such as Russia's invasion of Ukraine and escalating U.S.—China tensions—may have played a key role in reshaping alliances. The fact that the shift is more pronounced among AFEs, which are historically aligned with the U.S., may indicate a tightening of alliances within the Western bloc, particularly in response to economic and security concerns.
In subfigure (b) we focus on economic votes. In this case, if a country falls below the 45-degree line, it is more aligned with the U.S. than when using the full vote sample. The clustering along the 45-degree line suggests that geopolitical alignment is relatively stable across voting subsets. However, we observe a concentration around -0.5 on the x-axis, indicating that some countries appear more neutral when votes on human rights, colonialism, among others, are excluded.
Subfigure (c) shows that the choice of the estimation sample period (i.e., starting in 1946 or 1990) does not introduce substantial differences in geopolitical alignment, suggesting that IPD estimates are relatively robust to the estimation sample window.
3. Fragmentation
In this section we examine whether trade and financial flows are fragmenting along geopolitical lines and whether the findings depend on the IPD specification, following Gopinath et al. (2025)'s methodology. First, we construct three geopolitical alignment blocs, using our different measures of IPDs in the segment dimension: a U.S.-leaning bloc, including countries in the top quartile of political proximity to the United States; a China-leaning bloc, including countries in the top quartile of political proximity to China; and a nonaligned group, comprising all other economies. When comparing bloc classifications under different IPD specifications to the baseline IPD, we find that 48 percent of countries change blocs when using the 2023 IPD, 31 percent change blocs with the economic votes IPD, and only 2 percent change blocs when using data only since the 1990s. The reclassification under the 2023 IPD implies that countries are reacting to immediate political and economic pressures rather than adhering to long-standing alignments. The relative stability of bloc classifications under economic voting and post-1990 data suggests that while political shifts can be abrupt, economic relationships may be more resistant to short-term geopolitical disruptions.
Second, we define three dummy variables. $$BetweenBloc_{sd}$$ is a dummy that takes the value 1 if the two countries in a country pair belong to different blocs, $$WithinBloc_{sd}$$ takes the value 1 if the two countries belong to the same bloc, and $$Nonaligned_{sd}$$ as a dummy that takes the value 1 if at least one of the countries belongs to the nonaligned bloc. These variables may take different values for the same country pair $$sd$$ under the alternative estimation of the IPDs and the country blocs.
We estimate the following gravity equation.
$$$$Y_{sdt} = \beta_{1}BetweenBloc_{sd}\times Post_{t} + \beta_{2} Nonaligned_{sd} \times Post_{t} + \delta_{sd} + \iota_{st} + \phi_{dt} + \epsilon_{sdt}\ (1)$$$$
where $$ Y_{sdt} $$ is the value of total trade of goods between the country $$s$$ and the country $$d$$ or the change in the share of portfolio assets held by the reporting country $$s$$ in the counterpart country $$d$$ between year $$t$$ and $$t−1$$. $$Post$$ is an indicator equal to 1 after Russia's invasion of Ukraine (years 2022-2023). $$ \delta_{sd} $$, $$ \iota_{st} $$, and $$ \phi_{dt} $$ are country-pair, source × time and destination × time fixed effects, included in all the specifications.
For trade, we estimate the gravity model using Poisson pseudo-maximum likelihood (PPML), using annual data for the period 2001-2023, from UN Comtrade. For portfolio holdings, we estimate the gravity model with OLS using semi-annual data for the period 2015s1-2023s2. Financial data contains bilateral data on countries' holdings of cross-border portfolio investment (equity or debt) securities, excluding Foreign Direct Investment (FDI), from the IMF's Coordinated Portfolio Investment Survey (CPIS).5
Table 1 panel I shows the estimation results for trade under alternative IPD specifications.6 The first column presents the results using the baseline IPD measure to construct the blocs, showing evidence of geopolitical fragmentation in trade flows. The estimated coefficient indicates that in the post-invasion period, trade flows between countries in different geopolitical blocs are 11.8 percent lower, on average, compared to trade flows between countries within the same bloc $$(\text{computed as } (e^{-0.125}-1)x100)$$. This result is statistically significant at the 1 percent level. In contrast, trade flows between country pairs where at least one country is nonaligned are not significantly different from trade flows within the same bloc. These findings align with those of Gopinath et al. (2025), despite differences in the underlying trade data.7
Table 1: Regression Results
| Description | (1) Baseline IPD (complete, 2021) | (2) IPD all (complete, 2023) | (3) IPD economic (complete, 2021) | (4) IPD all (subsample, 2021) |
|---|---|---|---|---|
| (I) Trade | ||||
| Between Bloc × Post | -0.125*** | -0.276*** | -0.094** | -0.128*** |
| Std. Error | -0.04 | -0.058 | -0.038 | -0.041 |
| Nonaligned × Post | -0.044 | -0.066 | -0.017 | -0.041 |
| Std. Error | -0.07 | -0.057 | -0.053 | -0.068 |
| Observations | 389,747 | 389,761 | 387,589 | 389,747 |
| (II) Portfolio Holdings | ||||
| Between Bloc × Post | -0.026* | -0.014 | 0 | -0.026* |
| Std. Error | -0.016 | -0.016 | -0.012 | -0.016 |
| Nonaligned × Post Coefficient | -0.021 | -0.016 | -0.023 | -0.021 |
| Std. Error | -0.022 | -0.02 | -0.022 | -0.021 |
| Observations | 231,450 | 231,971 | 231,578 | 231,450 |
Significance thresholds: *** p < 0.01, ** p < 0.05, * p < 0.1
This effect strengthens with the 2023 IPD (-24.1 percent), reflecting recent geopolitical shifts, but weakens with economic votes (-9 percent), suggesting that trade alignment follows broader political ties more than economic cooperation. The post-1990 IPD yields similar results to the baseline (-12 percent), indicating that Cold War-era voting does not significantly affect fragmentation estimates. In all specifications, the coefficient for the interaction term $$Nonaligned × Post$$ remains small and statistically insignificant, reinforcing the idea that trade among nonaligned countries is less affected by geopolitical tensions.
Overall, we find that the specification of IPDs plays a crucial role in shaping conclusions about the degree of trade fragmentation, as the magnitude of the observed effects varies depending on the choice of IPD measure. The 2023 IPD best captures recent geopolitical disruptions, making it ideal for analyzing short-term realignments. The economic votes IPD provides a clearer picture of trade relations driven by economic dependencies rather than broad political alliances. The post-1990 IPD offers a historically consistent view of geopolitical fragmentation, minimizing distortions from Cold War-era dynamics. The findings confirm that trade fragmentation is increasing, but its intensity depends on the chosen IPD measure.
Panel II in Table 1 provides some evidence of financial fragmentation, with portfolio holdings between countries in opposing blocs declining by 0.3 percentage points post-invasion in baseline and post-1990 IPDs. However, results are weaker and less robust across specifications, particularly in 2023 and economic votes IPDs. Meanwhile, the coefficients for nonaligned countries remain small and insignificant across all specifications, reinforcing the idea that financial flows among nonaligned countries were less affected by geopolitical tensions. Overall, while some specifications suggest portfolio fragmentation along geopolitical lines, these effects are highly sensitive to the choice of IPD measure, contrasting with the more robust and consistent fragmentation observed in trade flows.
Alternative specification of gravity equations
In this section, we explore an alternative specification of gravity equation. While our previous analysis used normalized alignment measures (seg(s)) to classify countries into distinct blocs, here we employ bilateral IPD measures directly to assess fragmentation without imposing explicit bloc boundaries. We use lagged IPD to mitigate simultaneity concerns, assuming geopolitical alignment evolves gradually and is predetermined relative to trade and financial flows. The interaction term with Post, captures whether trade flows are affected by changes in geopolitical distance in the post-invasion period. Fixed effects are the same as in 1.
$$$$Y_{sdt} = \beta\ IPD_{sdt-1} \times Post_{t} + \delta_{sd} + \iota_{st} + \phi_{dt} + \epsilon_{sdt}\ (2)$$$$
Table 2 presents the estimation results of equation 2, using baseline IPD measures and those restricted to economic votes. We omit the results for IPD estimated since the 1990s, as they are nearly identical to the baseline specification. Columns 1 and 2 report the coefficients for the interaction term $$IPD × Post$$, while columns 3 and 4 include the direct effect of geopolitical distance $$IPD$$ without interaction with the post-invasion period.8
Table 2: Regression Results with IPD
| Description | (1) Baseline IPD | (2) Economic IPD | (3) Baseline IPD | (4) Economic IPD |
|---|---|---|---|---|
| IDP × Post | IDP | |||
| (I) Trade | ||||
| $$\beta$$ Coefficient | -0.087*** | -0.080*** | -0.068** | 0.021* |
| Std. Error | -0.023 | -0.024 | -0.027 | -0.012 |
| Observations | 374,365 | 371,609 | 374,365 | 371,609 |
| (II) Portfolio holdings | ||||
| $$\beta$$ Coefficient | -0.075** | -0.058* | 0.051 | 0.068 |
| Std. Error | -0.038 | -0.037 | -0.076 | -0.062 |
| Observations | 115,142 | 114,129 | 115,142 | 114,129 |
Significance thresholds: *** p < 0.01, ** p < 0.05, * p < 0.1
Part (I) of Table 2 presents the estimation results for total bilateral trade. In columns 1 and 2, we find strong evidence of trade fragmentation along geopolitical lines in the post- invasion period. A one-unit increase in geopolitical distance is associated with an approximately 8 percent decline in trade flows, on average. These results are statistically significant at the 1 percent level and remain consistent across the baseline and economic IPD specifications.
Columns 3 and 4 assess the direct effect of geopolitical distance on trade flows, independent of the post-invasion period. The estimated coefficient remains statistically significant under the baseline IPD measure, with a 7 percent decline in trade flows. However, the economic IPD (column 4) yields a smaller but positive coefficient (2.1 percent), suggesting that trade relationships based on economic alignment may be more resilient to geopolitical fragmentation, particularly in periods prior to 2022. The contrasting coefficients between $$IPD × Post$$ (column 2) and direct IDP effects (column 4) reveal an important temporal pattern in how economic voting alignment relates to trade flows. While countries with different economic voting patterns show reduced trade after 2022 (negative $$IPD × Post$$ coefficient), they actually maintained stronger trade relationships in the pre-invasion period (positive IDP coefficient). This suggests that economic voting differences did not disrupt trade until recent geopolitical tensions transformed how such alignment matters for economic relationships.
Part (II) of Table 2 provides evidence of financial fragmentation, though the effects vary across specifications. In columns 1 and 2, the interaction term $$IPD × Post$$ is negative and statistically significant (-0.075 and -0.058, respectively), indicating that in the post- invasion period, greater geopolitical distance led to a reduction in portfolio holdings between country pairs. However, in columns 3 and 4, where we estimate the direct effect of IPD independently of the post-invasion period, the coefficients are statistically insignificant. This suggests that while geopolitical distance has played a greater role in shaping portfolio allocations in recent years, its influence was more limited before 2022. Unlike trade, where fragmentation effects appear more persistent, portfolio holdings seem more reactive to recent geopolitical shocks rather than long-standing geopolitical alignments.
4. Conclusion
Methodological choices in measuring geopolitical alignment shape our understanding of global fragmentation. Our analysis reveals a contrast between trade and financial flows: trade relationships display consistent fragmentation along geopolitical lines, suggesting that economic ties actively realign with political blocs, while portfolio holdings show more resilience to geopolitical pressures, maintaining connections even across political divides. This asymmetry suggests that while governments and firms might redirect their trade routes in response to geopolitical tensions, financial investors remain guided primarily by market fundamentals and diversification motives. For capturing these dynamics, the 2023 IPD proves most powerful for measuring contemporary trade realignments, as it reflects immediate geopolitical shocks. For long-term structural analysis, the post-1990 IPD offers more stable estimates by filtering out Cold War distortions, while economic-votes IPD better captures persistent commercial relationships by focusing on countries' revealed preferences in economic policy.
References
Aiyar, M. S., Chen, M. J., Ebeke, C., Ebeke, M. C. H., Garcia-Saltos, M. R., Gudmundsson, T., Ilyina, M. A., Kangur, M. A., Kunaratskul, T., Rodriguez, M. S. L., et al. (2023). Geo-economic fragmentation and the future of multilateralism. International Monetary Fund.
Bailey, M. A., Strezhnev, A., and Voeten, E. (2017). Estimating dynamic state preferences from united nations voting data. Journal of Conflict Resolution, 61(2):430–456.
Catalan, M. M., Fendoglu, M. S., and Tsuruga, T. (2024). A gravity model of geopolitics and financial fragmentation. International Monetary Fund.
Gopinath, G., Gourinchas, P.-O., Presbitero, A. F., and Topalova, P. (2025). Changing global linkages: A new cold war? Journal of International Economics, 153:104042.
1. Florencia S. Airaudo ([email protected]), François de Soyres ([email protected]) and Keith Richards ([email protected]) are with the Board of Governors of the Federal Reserve System. Ana Maria Santacreu ([email protected]) is with the Federal Reserve Bank of Saint Louis. The views expressed in this note are our own, and do not represent the views of the Board of Governors of the Federal Reserve, the Federal Reserve Bank of Saint Louis, nor any other person associated with the Federal Reserve System. Return to text
2. The baseline IPD data are available at: https://dataverse.harvard.edu/dataverse/Voeten. Return to text
3. The categorization of votes by topic is not available prior to 1971. Return to text
4. AFE countries are Canada, Japan, U.K., U.S., France, Germany, Italy, Spain, Switzerland, Australia, and Sweden. EME countries are China, India, Singapore, South Korea, Malaysia, Indonesia, Philippines, Thailand, Mexico, Vietnam, Argentina, Brazil, Chile, Colombia, Israel, Russia, and Saudi Arabia. Return to text
5. International financial centers can blur the geopolitical distances between recipient and ultimate investor countries. In our portfolio holdings analysis, we do not include well-known financial centers, such as Bermuda, the British Virgin Islands, the Cayman Islands, and Hong Kong SAR, as source countries. In a robustness check, we further exclude other countries frequently identified as international financial centers, including Ireland, Luxembourg, the Netherlands, and Singapore, and find that the overall pattern of results remains consistent, with only minor changes in magnitude and significance. This suggests that financial centers play a role in channeling investments across geopolitical blocs, but their exclusion does not fundamentally alter the observed fragmentation trends. Return to text
6. Trade is the CIF value of total goods traded between Country A and B in millions of USD. Estimation for portfolio holdings equation use the lag of the country-pair portfolio share as an additional regressor. Return to text
7. We use annual goods trade data from UN Comtrade for the period 2001–2023. Gopinath et al. (2025) use quarterly total bilateral trade data from Trade Data Monitor, a private provider, for 2017:Q1–2024:Q1. Return to text
8. In this note, we present the results using the IPD measures lagged one period to mitigate potential endogeneity concerns, as in Catalan et al. (2024). Lagging IPDs helps reduce potential reverse causality, as geopolitical alignment may both influence and be influenced by trade and financial flows. Return to text
Airaudo, Florencia S., François de Soyres, Keith Richards, and Ana Maria Santacreu (2025). "Fragmentation? Revisiting the Ideal Point Distance measure of geopolitical distance," FEDS Notes. Washington: Board of Governors of the Federal Reserve System, March 21, 2025, https://doi.org/10.17016/2380-7172.3749.
Disclaimer: FEDS Notes are articles in which Board staff offer their own views and present analysis on a range of topics in economics and finance. These articles are shorter and less technically oriented than FEDS Working Papers and IFDP papers.