FEDS Notes
January 14, 2025
From Plans to Starts: Examining Recent Trends in Manufacturing Plant Construction
Eirik Eylands Brandsaas, Robert Kurtzman, and Joseph Nichols*
1. Introduction
Manufacturing structures investment is the largest component by value of U.S. nonresidential structure investment and has been growing quickly in the post-pandemic period. Figure 1 documents the significant extent to which the construction of manufacturing plants has contributed to growth in overall nonresidential construction. The surge in investment in manufacturing construction has occurred despite the higher interest rate environment, driven by government incentives associated with the Inflation Reduction Act (IRA) and the CHIPS and Science Act (CHIPS), and market forces such as increased demand for semiconductors and batteries and the re-shoring of supply chains.1 However, there have also been reports of delays and changes in the scope of these planned projects.2 This note uses micro-level data on manufacturing plans and starts to analyze recent patterns in such activity for manufacturing plants.
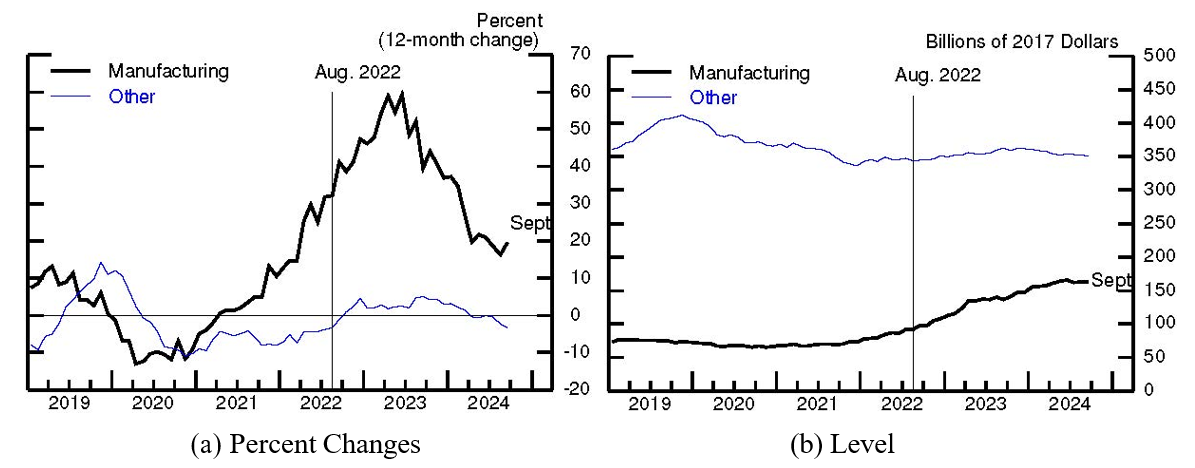
Note: The measures presented in these figures are in real terms; we compute them by taking nominal CPIP deflated by BEA prices for the respective sector through Q3. Other has all other categories of nonresidential construction except drilling and mining. The dotted dropline at August 2022 is the month when the CHIPS and IRA were signed into law.
Source: Authors' calculations using data from Dodge Data & Analytics.
Plans are particularly useful signals about future investment. Manufacturing structures investment— as with most of the other categories of nonresidential structures investment—is measured using a survey of started projects to capture the value of all construction completed in a given period on all ongoing projects, many of which may take multiple years to complete, and often require significant planning time (Millar et al., 2016; Glancy et al., 2024). As a result, the measure of the value of current investment is to a large extent reflective of past economic conditions and expectations, with swings in the value of projects put in place lagging broader swings in the economy. Focusing on swings in the planning pipeline for these projects provides more timely information about demand for nonresidential investment, which accounts for 3 percent of GDP and 19 percent of private fixed investment as of 2024Q3. That said, planning activity does not always result in projects moving to construction; Glancy et al. (2024) document that nonresidential structures construction projects are far more likely to be canceled in the planning stage than once construction has been started. Plans for new projects are more sensitive to current economic conditions than construction that has already been started. Nonetheless, construction plans naturally provide information regarding future investment, and tracking when plans are changed or canceled can also provide insight into current economic conditions.
The planning and starts data used in our analysis come from Dodge Data & Analytics (Dodge); our sample starts in 2019 and contains over 20,000 projects.3 A planning start is typically associated with a company hiring an architect to create plans. After some time, the project may progress to a construction start, defined as the commencement of physical work or the expectation of such work within the next few months. Projects may be labeled as abandoned at any stage, but only after the project owner verifies that the project is no longer viable. Projects can also be marked as deferred at any stage, though as with abandons, this mostly happens at the planning stage (Glancy et al., 2024). To measure nominal private nonresidential construction, the Census surveys a stratified sample of construction projects obtained from Dodge project level data, and project managers then report on the value of work done each month from project start to completion. The survey results, along with a set of adjustments, are then used by the Census to construct their measure of Construction Put in Place, which feeds into nonresidential structures investment and thus GDP (Brandsaas et al., 2023).
In the remainder of this note, we use the data from Dodge to analyze planning and construction start activity. We first document the significant rise in planning activity that preceded the rise in construction starts and investment we observed in the post-pandemic period. We then develop measures of how long it usually takes for plans to transition into actual starts, their propensity to be either abandoned or have their scope change, and the resulting distribution of both the stock of outstanding plans and project starts by vintage.
2. Analysis of Manufacturing Construction Plans and Starts
We begin our analysis by showing aggregated time series of planning and construction starts beginning in 2019.4 We define a planning start as the first instance a plan enters our data. Because some projects that started pre-2019 are not included in our analysis, some projects at the beginning are likely incorrectly labeled as a plan start; we are unable to correct for this, so initial plans (which are low) can be viewed as an upper bound for actual activity at the beginning of our sample.
The left panel of Figure 2 plots 3-month backward moving averages of planning starts for new manufacturing projects. As discussed earlier, there was little investment in new manufacturing structures before the pandemic. This pattern is also evident in planning starts, which were very low in 2019 and 2020. In 2021, planning starts surged, well before the passage of CHIPS and the IRA. Planning starts peaked around the time the CHIPS and IRA were signed into law and have since gradually moved down, before recovering in the last few months. The series is volatile, driven by the presence of some very large projects that dwarf many smaller ones.
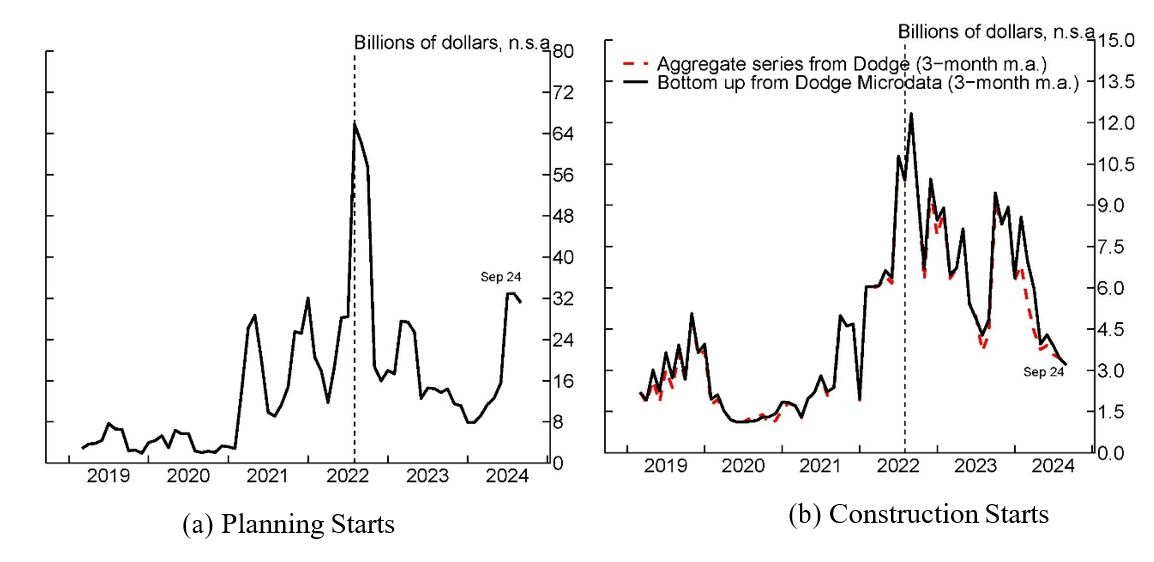
Note: Plan starts and construction starts are 3-month backward-looking moving averages and are in nominal terms. The dotted dropline is at August 2022, the month when the CHIPS and IRA were signed into law. The aggregate series is sent from Dodge directly as an aggregate, while the bottom-up series is constructed from our microdata.
Source: Authors' calculations using data from Dodge Data & Analytics.
The right panel plots 3-month backward moving averages of construction starts for new manufacturing projects calculated from the microdata. As a validation exercise, we compare our measure to the aggregate manufacturing starts data released by Dodge and find that the two measures closely overlap.5 The lull in starts in 2020 and the first half of 2021 likely reflects the low level of planning starts in 2019 and 2020. In late 2021, we see that the level of construction starts picks up, with a peak around the announcement of the CHIPS/IRA acts in 2022. This peak in construction starts was driven by projects that entered planning prior to the passage of the IRA or CHIPS. The further jump in planning starts in late 2022 and first half of 2023 occurred after the legislation passed.
With our detailed microdata, we can also study what happens to plans over time, the stock of plans, and the age of projects when they enter construction. We first illustrate the time-to-start by plotting the share of starts that began construction 1, 2, . . . , months after the plan was recorded in the left panel of Figure 3. We weight the starts by the value at the time of construction to account for the longer planning times for large projects. We see that about 75% of construction starts had planning lengths of less than a year. Only 10% of starts had planning lengths over 1-to-2 years and virtually no starts had longer planning stages than three years.
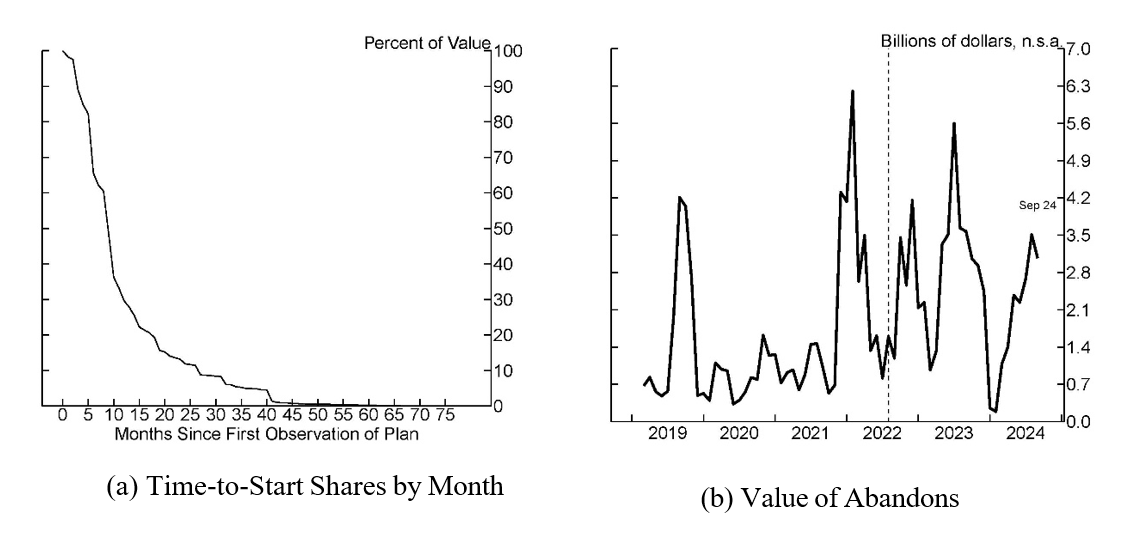
Note: Abandons are 3-month backward-looking moving averages and are in nominal terms. The dotted dropline is at August 2022, the month when the CHIPS and IRA were signed into law.
Source: Authors' calculations using data from Dodge Data & Analytics.
Projects in planning are useful leading indicators of construction starts, but they may also be delayed or abandoned.6 Project abandonments should be more responsive to changes in economic conditions than actual project starts (Glancy et al., 2024). We plot the value of abandoned projects over time in the right panel of Figure 3. There is substantial volatility in the value of abandoned projects, with a sharp jump around the beginning of the rate tightening cycle in early 2022, and several peaks and troughs leading up to and after the passage of CHIPS and the IRA.
Taking into account abandoned projects, changes in project scope, new planning starts, and actual ground breaking of new projects, the left panel of Figure 4 shows the significant growth in the stock of projects in planning over our sample period, starting prior to but accelerating after the passage of CHIPS and the IRA.7 However, the share of projects in the planning stage less than 1 year has declined since mid-2023, reflecting the slowdown in new projects entering planning. Given our earlier analysis of the distribution of the time in planning for actual project starts, it is unclear whether the increasing share of older plans is a positive or negative signal for future activity. On the negative side, many of these older projects may end up being abandoned. Projects may be experiencing longer spells in planning for various reasons, such as uncertainty about future economic conditions, shifting business outlooks, or projects being mothballed rather than canceled. On the positive side, there remains a large stock of projects in planning that, if they result in actual starts, would support the current high level of manufacturing construction over the next several years.
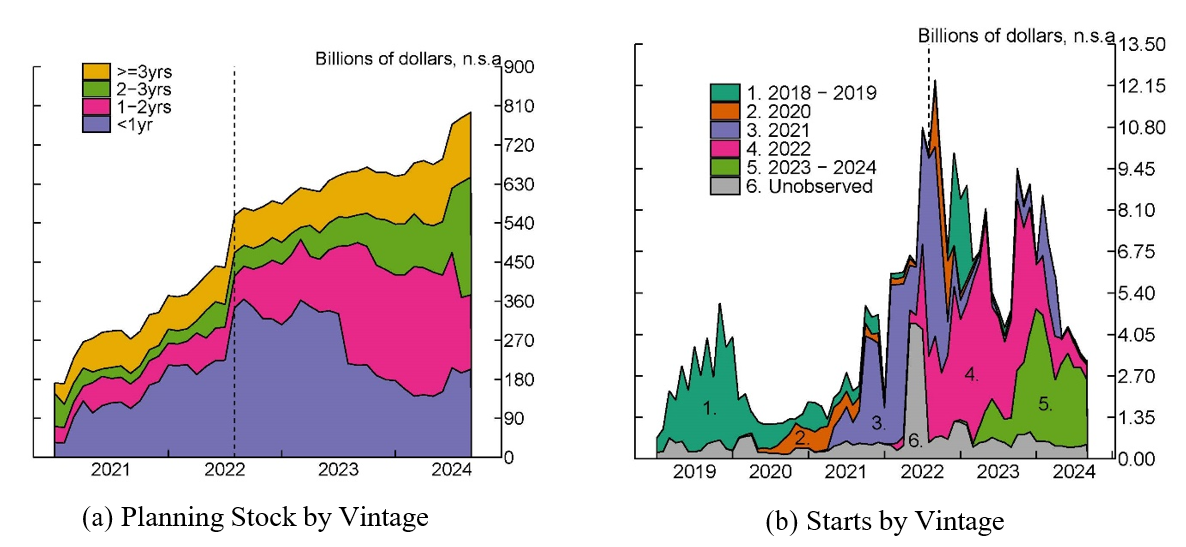
Note: The key for panel (a) identifies the vintages on the chart in order from top to bottom. The dotted dropline is at August 2022, the month when the CHIPS and IRA were signed into law.
Source: Authors' calculations using data from Dodge Data & Analytics.
3. Conclusion
New manufacturing construction plans have significantly increased in the post-pandemic period; these plans have translated into a substantial increase in manufacturing construction starts, while a large number of projects remain in planning. That said, plans do not always turn into starts, and new planning activity has been volatile this year. These recent patterns suggest the need for further monitoring of this leading indicator of nonresidential structures investment.
References
Brandsaas, E., D. Garcia, J. Nichols, and K. Sadovi (2023): "Nonresidential construction spending is likely not as weak as it seems," FEDS Notes.
Glancy, D., R. J. Kurtzman, and L. Loewenstein (2024): "On Commercial Construction Activity's Long and Variable Lags," FEDS Working Paper 2024-016.
Millar, J. N., S. D. Oliner, and D. E. Sichel (2016): "Time-to-plan lags for commercial construction projects," Regional Science and Urban Economics, 59, 75–89.
* The views expressed in this paper are solely those of the authors and do not necessarily reflect the opinions of the Federal Reserve Board or anyone in the Federal Reserve System. Thanks to Paul Lengermann, Daniel Garcia Molina and Andrew Paciorek for their helpful comments, and to Samara Beach, who provided key support in drafting this note.
Eirik Eylands Brandsaas
Senior Economist, Division of Research & Statistics, Federal Reserve Board, [email protected].
Robert Kurtzman
Principal Economist, Division of Research & Statistics, Federal Reserve Board, [email protected].
Joseph Nichols
Principal Economist, Division of Research & Statistics, Federal Reserve Board, [email protected]. Return to text
1. CHIPS passed Congress in July 2022 and the IRA in August 2022. Both were signed into law in August 2022. Return to text
2. "Has Joe Biden spurred an American manufacturing renaissance?", Financial Times, August 16, 2024. Return to text
3. While the Dodge contracts has a longer history, the microdata that we were able to obtain for this project begins in 2019. Return to text
4. This analysis uses projects identified as manufacturing by Dodge and includes some types of projects that Census classifies differently, such as LNG terminals which would be in the Census Power category. Return to text
5. The measures do not precisely overlap for a few reasons: (1) both series revise but we receive them at different frequencies, and (2) it is possible our calculation of start dates for the transactions are misaligned or that we cleaned the microdata differently for this calculation. Return to text
6. In addition to abandoned projects, we also observe changes in estimated project value over the planning period that can reflect either corrections to the estimated value or actual changes in the scope of the project. Return to text
7. Since we only have planning data starting from 2019, there are naturally no older plans in the earliest observations. Note that we use the latest project value. For instance, a project might initially enter planning with a value of $10 billion but later be revised to $5 billion. From that point on, the plan is recorded at the updated value of $5 billion. Return to text
Brandsaas, Eirik Eylands, Robert Kurtzman, and Joseph Nichols (2024). "From Plans to Starts: Examining Recent Trends in Manufacturing Plant Construction," FEDS Notes. Washington: Board of Governors of the Federal Reserve System, January 14, 2025, https://doi.org/10.17016/2380-7172.3667.
Disclaimer: FEDS Notes are articles in which Board staff offer their own views and present analysis on a range of topics in economics and finance. These articles are shorter and less technically oriented than FEDS Working Papers and IFDP papers.