FEDS Notes
April 12, 2024
Global trade patterns in the wake of the 2018-2019 U.S.-China tariff hikes
Flora Haberkorn, Trang Hoang, Gordon Lewis, Carter Mix, and Dylan Moore
In 2018, the U.S. government announced bilateral tariff increases on a number of Chinese goods. Thus began a tit-for-tat exchange of increasing bilateral tariffs between the U.S. and China until, by the end of 2019, most of the goods traded between the U.S. and China were subject to additional tariffs. In this note, we use Census and UN Comtrade data to study the effects of the 2018-19 U.S.-China tariff hikes on global trade patterns.
We find that the increased tariffs have led to a shift in U.S. imports from China to U.S. imports from other trading partners. But we also find that the trading partners that the U.S. had shifted to are importing more from China precisely those goods that the U.S. is importing less of from China. Thus, indirect reliance on China may have fallen less than direct reliance as measured by trade flows.
These results are consistent with the following economic mechanism at work: The increased U.S. tariffs represent a negative demand shock for Chinese goods, which decreases prices and wages in China, in turn increasing demand for Chinese goods from other countries. Thus, bilateral tariffs, even from a big trading partner, may not decrease global reliance on China.
Moreover, to understand how U.S. imports across trading partners evolve over time, we compute an elasticity of substitution from China to other countries and find that this elasticity increases meaningfully only in three to four years. The inability to substitute away from Chinese imports in the short run implies larger welfare losses up front, as consumers continue to buy high-tariff goods for a time before switching.
The decline in China's share of U.S. goods imports
As Figure 1 shows, China was only a small U.S. trading partner at the start of the 1990s, accounting for around 5 percent of total U.S. goods imports. After China's accession to the World Trade Organization in September 2001, its market share grew rapidly for almost two decades, peaking at 22 percent in 2017, making China the biggest foreign supplier of the U.S. This upward trend reversed after the U.S. government imposed several waves of tariffs on about two-thirds of U.S. goods imports from China starting in July 2018. China's share of U.S. goods imports has been declining since, except for the pandemic period from 2020-21, when U.S. demand rose exceptionally for goods that it typically imports a lot from China, such as laptops and furniture. As of December 2023, China accounted for about 14 percent of U.S. goods imports, bringing its market share back to its level in the mid-2000s.1
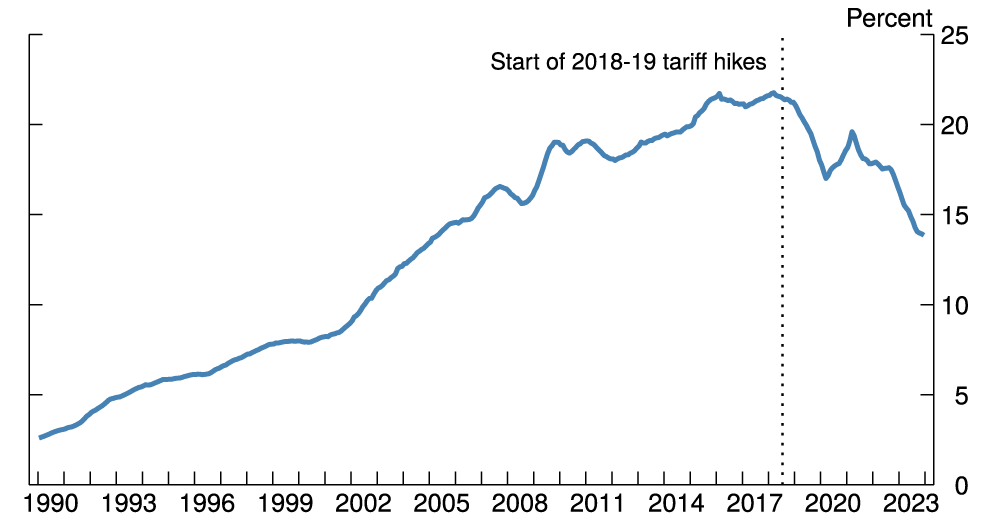
Note: Share is measured over a 12-month rolling window. The data extend through December 2023.
Source: U.S. Bureau of Economic Analysis.
It has been widely documented that the decline during 2017-2022 was concentrated in goods subject to the tariff hikes (Bown, 2022; Freund et al., 2023; Pierce and Yu, 2023). As shown in Figure 2, the growth of U.S. imports of tariffed goods from China has lagged behind that of U.S. imports of the same goods coming from the rest of the world (ROW), whereas U.S. imports of non-tariffed goods from China and from ROW have grown in similar proportions through 2022. Non-tariffed goods accounted for a noticeable portion of China's decline since then, suggesting that other factors, such as a rebalancing of U.S. demand from goods to services, have also played a role more recently.
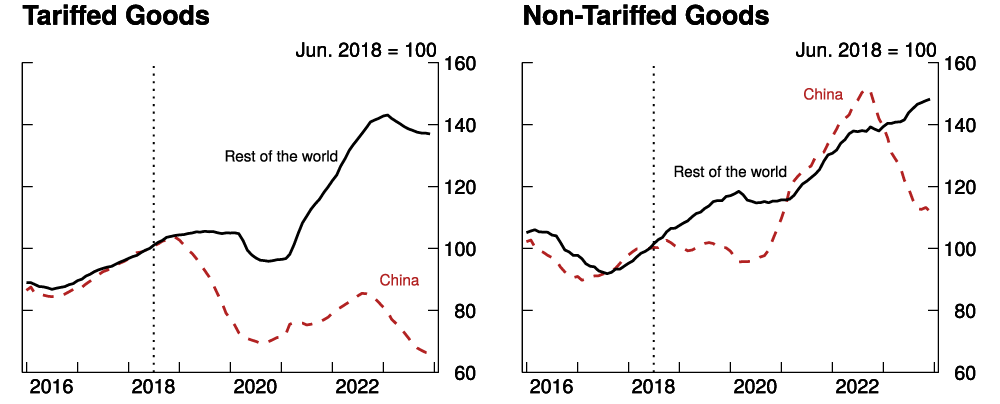
Note: The data extend through December 2023. Vertical line signifies the start of the 2018-19 tariff hikes.
Source: United Nations Comtrade database; FRB staff calculations.
We find that this diverging pattern holds even when comparing goods similar in nature but subject to different trade policies. Figure 3 shows changes in China's share between 2017 and 2023 for U.S. imports of tariffed and non-tariffed goods within the same two-digit Harmonized System (HS) sectors. Though China's shares of U.S. imports of both tariffed and non-tariffed goods have been on a decline, the vast majority of sectors lie below the 45-degree line, implying that China's share of tariffed goods declined faster than that of non-tariffed goods within the same category.2
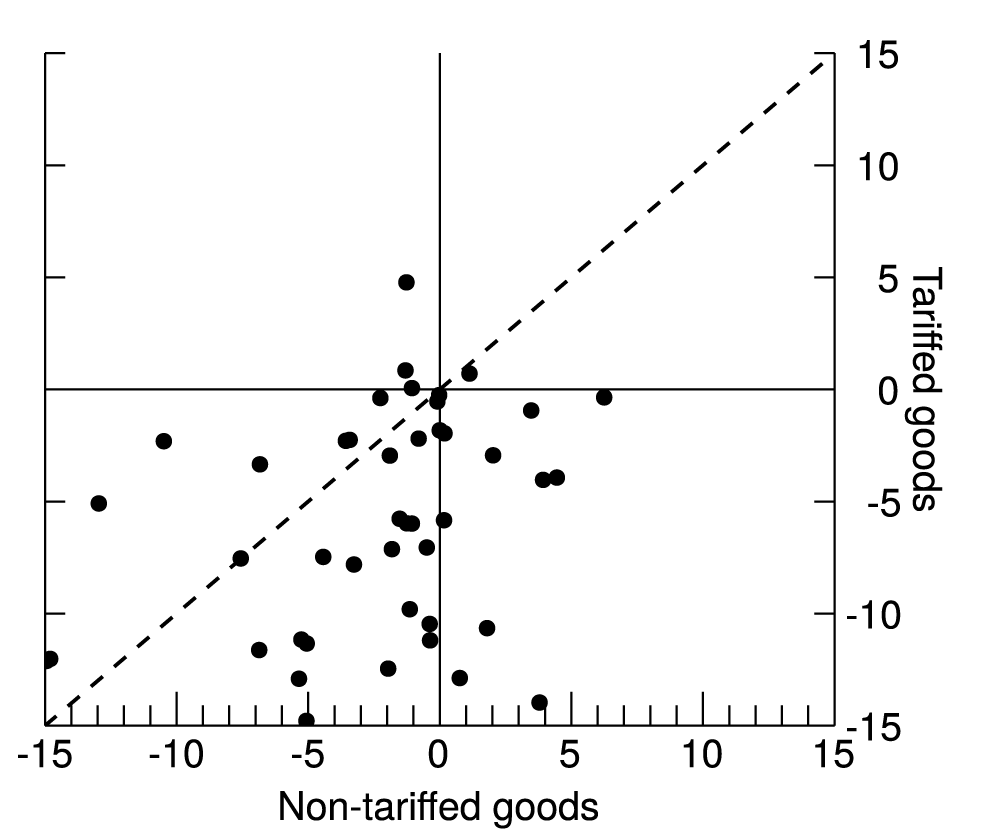
Note: Tariffed status is determined at the HS 2-digit level. The data shows 2017 through 2023.
Source: U.S. Census Bureau.
Finally, Figure 4 decomposes the change in China's share of overall U.S. goods imports since 2017 into the contributions of tariffed and non-tariffed goods. We find that tariffed goods account for essentially all the decline through 2022. Even for 2023, when U.S. non-tariffed goods imports from China started to fall behind imports from the rest of the world, tariffed goods still made a significant contribution to the overall decline in China's share of U.S. goods imports. This pattern is consistent with the notion that the recent decline in China's share of U.S. goods imports was primarily driven by the U.S.-China tariff hikes.
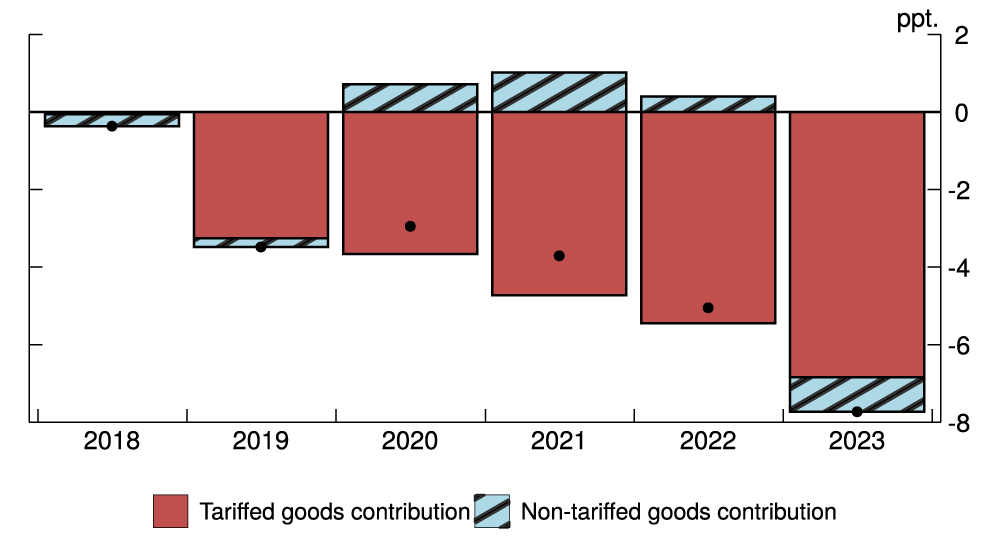
Note: The data extend through December 2023. Black dots present changes in aggregate imports.
Source: U.S. Census Bureau; FRB staff calculations.
Trade diversion of Chinese exports
While the U.S. has reduced its imports from China compared to imports from ROW, imports of Chinese goods by other major U.S. trading partners have increased. Figure 5 shows that the U.S. neighbors, Canada, and Mexico, stepped up their shares of goods imports from China by 1 and 2 percentage points, respectively. The EU, a traditional ally of the U.S., has also increased its share of imports from China. ASEAN3, which collectively accounted for 10 percent of U.S. imports in 2022, also increased their reliance on Chinese goods.
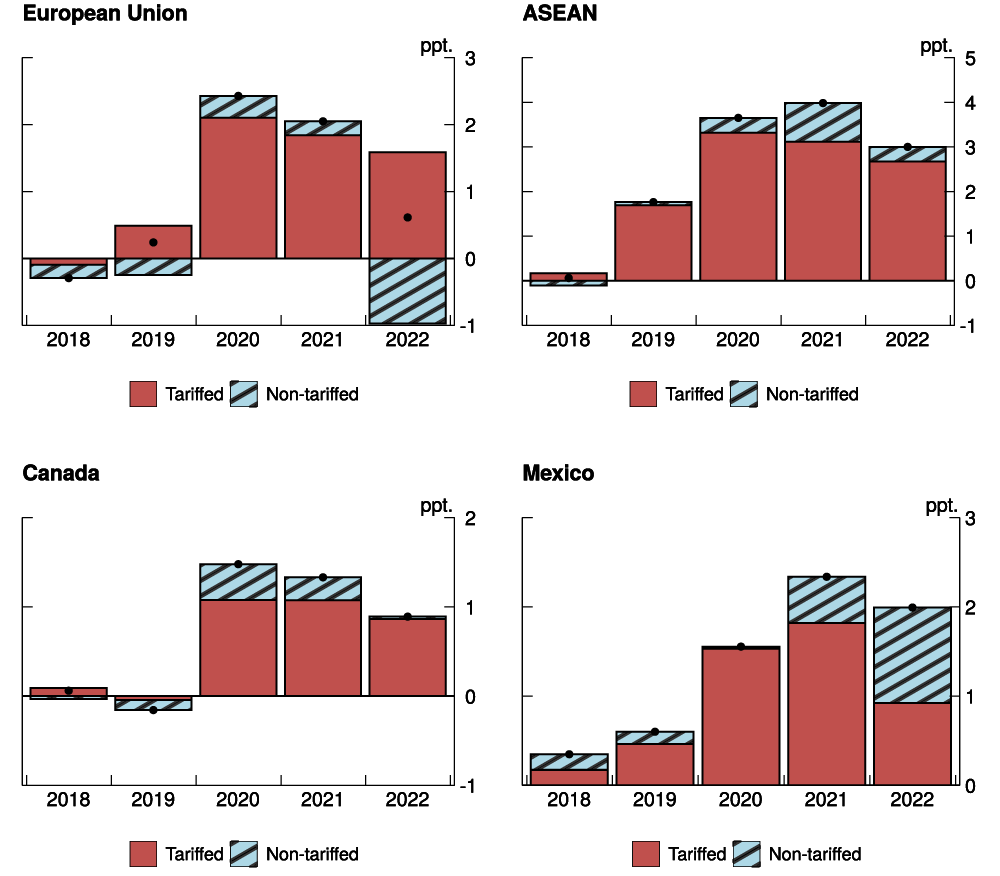
Note: Black dots present changes in aggregate imports.
Source: United Nations Comtrade database; FRB staff calculations.
China's increased shares in these countries appear to be driven by goods subject to the 2018-19 U.S. tariffs (whose contribution to the share is shown by the red bars). Tariffed goods more than accounted for the increase in China's share of EU goods imports and contributed to most of the increase in the ASEAN import share of Chinese goods between 2017-22.4
The diversion of China's exports of tariffed goods to other countries is consistent with standard general equilibrium models in international trade. When the U.S. adds tariffs to imports from China, the effect is primarily a demand shock for the Chinese economy, which reduces Chinese wages and makes Chinese goods more attractive to other countries (Hoang and Mix, 2024; Anderson and Van Wincoop, 2000).
The shift in trade patterns arising since the U.S. imposed additional tariffs provide two key takeaways: First, global decoupling cannot be achieved with bilateral tariffs. While most advanced economies have seen rising geopolitical tension with China in the past six years, many of these regions, such as Canada and the EU, have actually increased their reliance on Chinese imports.
Second, the shift suggests that the change in bilateral imports from China likely overstates how much the U.S. has reduced its reliance on China. With Mexico and ASEAN now importing more from China, for example, it's likely that the additional U.S. imports from those countries have a higher Chinese value-added content than in the pre-2018 period.5
Gradual adjustment to tariffs
In this section, we further quantify the effect of the tariffs on U.S. goods imports from China by estimating the elasticity of substitution across U.S. trade partners over different time horizons. Our results show that the elasticities are larger in the long run than in the short run, suggesting a gradual transition from Chinese goods to goods from other countries. The gradual adjustment would imply large welfare costs as U.S. consumers are stuck buying high-tariff goods in the short run.
We employ what is known as an "odds-ratio" approach to estimate a product-specific gravity equation based on standard models of international trade (Head and Ries, 2010). This approach controls for U.S. demand factors by comparing U.S. imports from China to U.S. imports from a reference exporter. It also controls for supply factors by comparing U.S. imports from China to a reference importer's imports from China.6
Formally, let $$M_{p,i,j,\underline{t},\bar{t}}$$ denote the sum of imports of product $$p$$ by country $$i$$ from country $$j$$ from month $$\underline{t}$$ to month $$\bar{t}$$. A difference-in-difference comparison of this value for the U.S., China, a reference exporter, and a reference importer gives us the odds ratio. In particular, we have
$$$$ M^{DD}_{p,\underline{t},\bar{t}} = \frac{M_{USA,CHN,p,\underline{t},\bar{t}}/M_{USA,RX,p,\underline{t},\bar{t}}}{M_{RM,CHN,p,\underline{t},\bar{t}}/M_{RM,RX,p,\underline{t},\bar{t}}} $$$$
where $$RX$$ is the reference exporter and $$RM$$ is the reference importer.7
Now, let $$\Delta_h \ln M^{DD}_{p,\underline{t},\bar{t}} \equiv \ln M^{DD}_{p,\underline{t} + h*12,\bar{t} + h*12} - \ln M^{DD}_{\underline{t},\bar{t}}$$ denote the change in the the log of the odds ratio over $$h$$ years, with $$h =1,2,3,4$$ in our setting. Furthermore, let $$\tau_{p,\underline{t},\bar{t}}$$ be the average U.S. tariff imposed on product $$p$$ from China between $$\underline{t}$$ and $$\bar{t}$$. Our estimating equation is
$$$$ \Delta_h \ln M^{DD}_{p, t_p-12, t_p-1} = \gamma_h\Delta_h \ln \tau_{p, t_p-12, t_p-1} + \epsilon_{p,h}, $$$$
where $$\epsilon_{p,h}$$ is an error term assumed to be normally distributed with mean zero. We define $$t_p$$ as the first month in which some sub-product within that 6-digit category (for which U.S. imports in 2017 were positive) became subject to an additional tariff from China.8 The coefficient $$\gamma_h$$, our key parameter, captures the average trade elasticity across products with respect to tariffs over time horizon $$h$$.
Figure 6 shows the estimated trade elasticities from Equation (1) over the first 4 years since the trade war began in 2017. In the first year, the tariffs induce relatively little adjustment away from Chinese goods, with a trade elasticity of about 1. This elasticity implies that with an additional tariff of about 13 percent points (the average increase across goods), U.S. imports from China fall 13 percent relative to U.S. imports from other countries. Greater substitution happens over time, and by 2022, four years after the trade war began, the trade elasticity is 4, nearly four times larger than the one-year elasticity.9
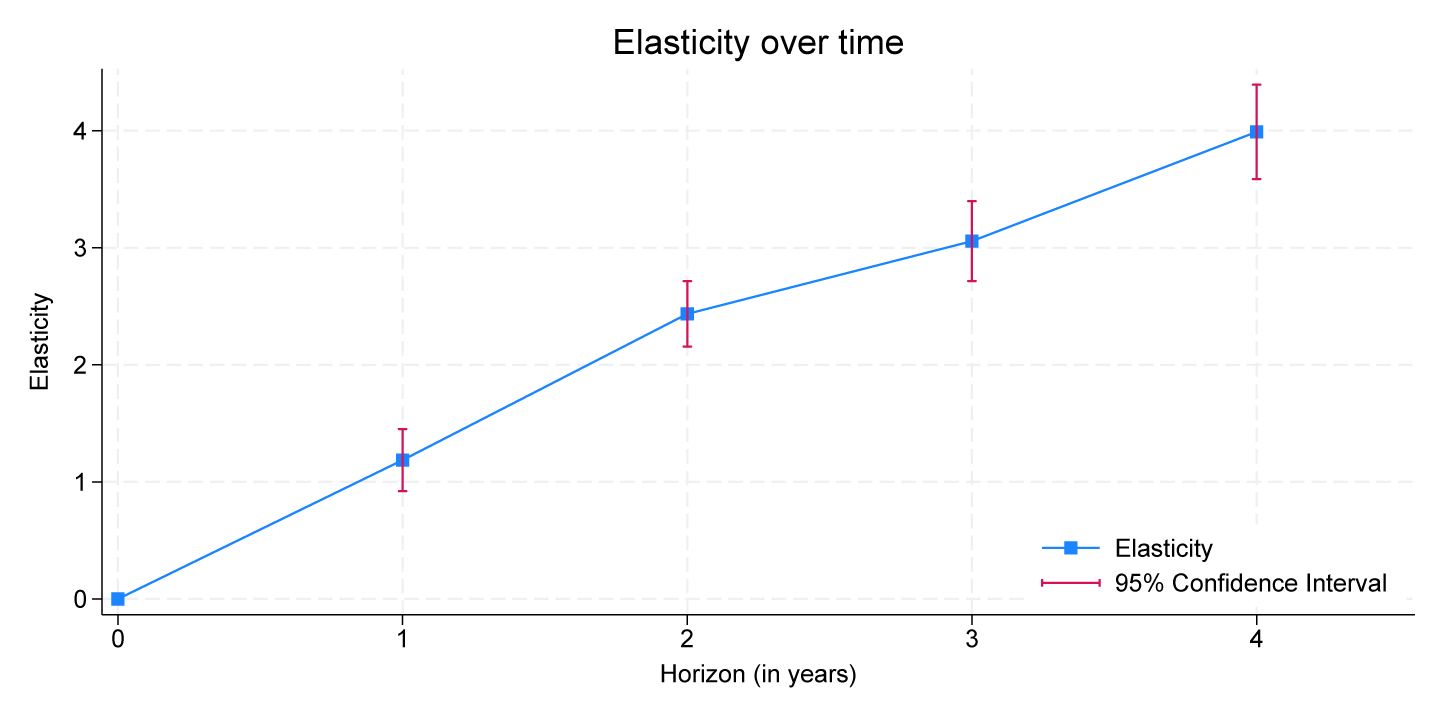
The gradual increase in substitution away from Chinese goods is consistent with the trade literature, which shows that trade values respond slowly to changes in policy or other costs. Baier and Bergstrand (2007) show that trade can take up to 15 years to fully adjust in the wake of a free trade agreement. While some of this slow response is related to the tendency for tariffs to be phased out over time, Jung (2012) shows that even controlling for phase outs, trade takes 5 to 10 years to fully adjust to past tariff changes.
Given the tariff hikes were implemented roughly 5 years ago, one might think we are nearing the end of the transition, but this period is also marked by sustained uncertainty about the future of tariffs. When the first set of tariffs was implemented in 2018, it was unclear whether these tariffs would be permanent or would be overturned by future administrations. As such, some firms likely kept importing from China to maintain important supplier relationships, even if it was more expensive in the short run. In the event, we have not seen these tariffs go away; in fact, there have been additional restraints imposed on U.S. trade with China in specific industries. Accordingly, firms likely now expect these tariffs to be more permanent, which may explain the relatively large jump in the trade elasticity from year 3 to year 4. As such, it is difficult to determine at this point whether the adjustment to the additional tariffs is complete or whether we should expect more bilateral decoupling in the future. Of course, if more widespread restrictions are implemented, we would expect further bilateral decoupling either way.
References
Alfaro, Laura and Chor, Davin, Global Supply Chains: The Looming "Great Reallocation" (September 2023). NBER Working Paper No. w31661.
Anderson, James E., and Eric Van Wincoop. "Gravity with gravitas: A solution to the border puzzle." American Economic Review 93, no. 1 (2003): 170-192.
Baier, S.L., Bergstrand, J., 2007. Do free trade agreements actually increase members international trade? J. Int. Econ. 71 (1), 72–95.
Besedes, T., Kohl, T., Lake, J., 2020. Phase out tariffs, phase in trade? J. Int. Econ. 127.
Bown, C (2022), "Four years into the trade war, are the U.S. and China decoupling?", Peterson Institute for International Economics.
Clark, Hunter L., and Anna Wong (2021). "Did the U.S. Bilateral Goods Deficit With China Increase or Decrease During the U.S.-China Trade Conflict?," FEDS Notes. Washington: Board of Governors of the Federal Reserve System, June 21, 2021, https://doi.org/10.17016/2380- 7172.2927.
Flaaen, Aaron, and Justin Pierce (2019). "Disentangling the Effects of the 2018-2019 Tariffs on a Globally Connected U.S. Manufacturing Sector," Finance and Economics Discussion Series 2019-086. Washington: Board of Governors of the Federal Reserve System, https://doi.org/10.17016/FEDS.2019.086.
Freund, C, A Mattoo, A Mulabdic and M Ruta (2023), "Is US Trade Policy Reshaping Global Supply Chains", Working paper.
Head, K., Ries, J., Mayer, T. (2010), "The erosion of colonial trade linkages after independence", J. Int. Econ. 81 (1), 1–14.
Hoang, Trang, and Carter Mix (2024). "Trade Wars and Rumors of Trade Wars: The Dynamic Effects of the U.S.-China Tariff Hikes", Working paper.
Jung, B., 2012. Gradualism and dynamic trade adjustment: revisiting the pro-trade effect of free trade agreements. Econ. Lett. 115, 63–66.
Khan, S. Y., Khederlarian, A. (2021). How does trade respond to anticipated tariff changes? Evidence from NAFTA. Journal of International Economics, 133, 103538.
Pierce, Justin R., and David Yu (2023). "Assessing the Extent of Trade Fragmentation," FEDS Notes. Washington: Board of Governors of the Federal Reserve System, November 03, 2023, https://doi.org/10.17016/2380-7172.3387.
1. Hunter and Wong (2021) argue that U.S. import data might be less reliable after tariffs were imposed. Correcting for reporting issues, the authors find that the decline in China's share might have been smaller than indicated by U.S. data. Return to text
2. Furthermore, as shown in Figure 2, the decline in China's share of U.S. imports of non-tariffed goods was concentrated in 2023, whereas between 2017 and 2022, China's share of many non-tariffed categories actually increased. Return to text
3. Association of Southeast Asian Nations. Return to text
4. We classify a HS6 code as tariffed goods if more than half of U.S. import values of the same code from China are tariffed. The results are robust to different cutoff points. Return to text
5. Alfaro and Chor (2023) document that while the U.S. has increased its imports from Vietnam and Mexico, these two countries have also stepped up their imports from China and received more FDI from China. Freund et al. (2023) find that for electronics, an industry that contains many strategic products, countries that increased exports to the U.S. also increased imports from China. Return to text
6. Given policy rhetoric at the time, firms might have anticipated upcoming tariffs and stocked up imports in advance, especially for goods subject to later waves of tariffs. Khan and Khederlarian (2021) show that when firms anticipate policy changes, trade elasticity estimates using trade flows data are biased upward because of inventory behavior. We follow Khan and Khederlarian (2021) and construct a measure of "consumed imports" using inventory-sales ratios for our analysis. Return to text
7. We follow Khan and Khederlarian (2021) in choosing as our reference importer an aggregate of 9 countries in the European Union. Our reference exporter is the set of countries which have never had a trade agreement with either the U.S. or the set of EU countries in our reference importer. Return to text
8. Since tariffs are implemented at more disaggregate levels than the 6-digit trade flows for which we have data, we calculate tariffs for each 6-digit product as the 2017 import-weighted average across sub-product tariffs. We get tariff data (both initial and during the trade war) from Bown (2022) and Flaaen and Pierce (2019). Return to text
9. Holding all other bilateral trade flows constant, our estimate translates into a roughly 9 percentage point decline in China's share of U.S. goods imports 4 years after implementation of a 13 percent tariff, similar to what we observe in the data. Return to text
Haberkorn, Flora, Trang Hoang, Gordon Lewis, Carter Mix, and Dylan Moore (2024). "Global trade patterns in the wake of the 2018-2019 U.S.-China tariff hikes," FEDS Notes. Washington: Board of Governors of the Federal Reserve System, April 12, 2024, https://doi.org/10.17016/2380-7172.3464.
Disclaimer: FEDS Notes are articles in which Board staff offer their own views and present analysis on a range of topics in economics and finance. These articles are shorter and less technically oriented than FEDS Working Papers and IFDP papers.