FEDS Notes
June 21, 2018
High-frequency Spending Responses to the Earned Income Tax Credit
Aditya Aladangady, Shifrah Aron-Dine, David Cashin, Wendy Dunn, Laura Feiveson, Paul Lengermann, Katherine Richard, and Claudia Sahm
Many households face large, high-frequency changes in income and have limited financial buffers to smooth their consumption through this income volatility (Murdoch and Schneider, 2017; Board of Governors, 2018). However, few studies have quantified spending responses to such timing shifts in income due to a lack of high-frequency spending data. We use a new dataset of anonymized daily, state-level spending to study a two-week delay in federal tax refunds with an earned income tax credit (EITC) in 2017. Using time-series and cross-state variation in refund receipt, we estimate that, on average, EITC recipients spend about 15 cents out of each dollar of their total refunds at retail stores and restaurants within two weeks of receipt. Thus the two-week delay in 2017 of over $40 billion in refunds--while short lived--led to a noticeable change in the timing of spending in February. Moreover, while previous studies, such as Barrow and McGranahan (2000) and Goodman-Bacon and McGranahan (2008), emphasize the link between the EITC and durable goods purchases, we find that EITC receipt also affects spending on nondurable necessities, such as groceries. Altogether, these findings suggest many households have limited access to liquidity, such that even a short-lived delay in income leads to notable changes in spending.
Background on Tax Refunds to EITC Claimants
The EITC is a refundable tax credit claimed by a large share of low- to moderate-income households. In 2017 (tax year 2016), 27 million households claimed the EITC--18 percent of all tax returns processed.1 Moreover, those claiming the EITC tend to be among the earliest tax filers each year, and federal income tax refunds often represent a substantial portion of their annual incomes. Maag et al. (2016) find that of all EITC claimants, 56 percent filed prior to February 15 in 2015 and 2016, receiving an average refund of $4,479--an amount equal to roughly two months of pay for a typical EITC claimant.
At the time a tax return is filed, tax filers learn the expected amount of their refund, but they do not receive the refund until after the tax return has been processed by the IRS. Prior to 2017, the length of time between the filing date and the date the IRS issued a refund was less than three weeks.2 But starting in 2017, legislation that was part of the Protecting Americans from Tax Hikes Act (PATH) prohibited the Internal Revenue Service (IRS) from issuing any federal tax refunds claiming the EITC before February 15.3 As a result, EITC claimants waited longer to receive their tax refunds in 2017 than in prior years.4 The left panel in Figure 1 shows weekly values of federal tax refund dollars issued during the 2014 to 2017 filing seasons that included an EITC.5 Refund issuance in early February 2017 was well below the levels observed in prior years, peaking about two weeks later than usual. However, the issuance of refunds without an EITC was similar to prior years (Figure 1, right panel). By adding exogenous variation to the timing of household income receipt, this legislated refund delay allows us to estimate the extent to which low- and moderate- income households smooth their spending through a large, but short-lived disruption to income.6
Refunds (billion dollars)
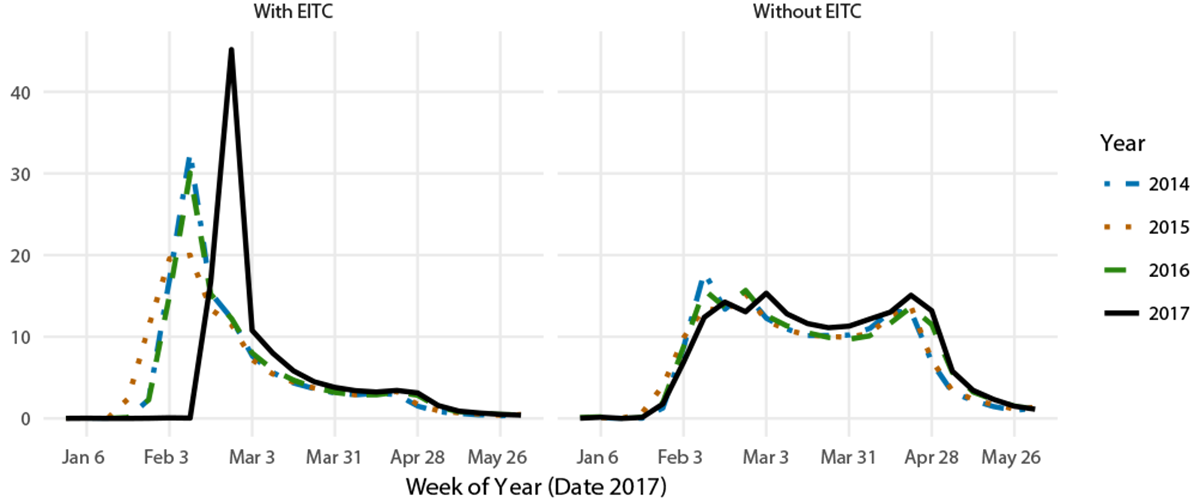
Note: Peak issuance occurred in the week of Friday, February 23rd in 2017, two weeks later than the peak in earlier years.
Source: Internal Revenue Service: Research, Applied Analytics, & Statistics.
Survey evidence from Maag et al. (2016) suggests that at least some of the early EITC claimants would have difficulty smoothing spending through the PATH Act's temporary delay in refund issuance. One-third of survey respondents said that even a one-week delay in their refund would "somewhat negatively" affect their household finances. Using tax filing data and a survey of early EITC filers, Maag et al. (2016) also document that the median family with children affected by the delay reported only $400 in liquid assets and $2,000 in credit card debt at the time of tax filing. Of course, from a prospective survey, it is hard to know how many EITC claimants were surprised in February 2017 by the delay. The rise in refund anticipation loans (RALs) suggests that those households using tax preparation services may have been told about the delay when they filed.7 However, news reports in early February suggest that many filers were caught by surprise.
In addition to variation in the timing of refund receipt across tax years, our analysis takes into account the considerable variation across the United States in EITC receipt each year. Figure 2 shows the fraction of federal tax returns in each state receiving the EITC in 2016, which ranges from over 30 percent of all returns in Mississippi to less than 15 percent in North Dakota.
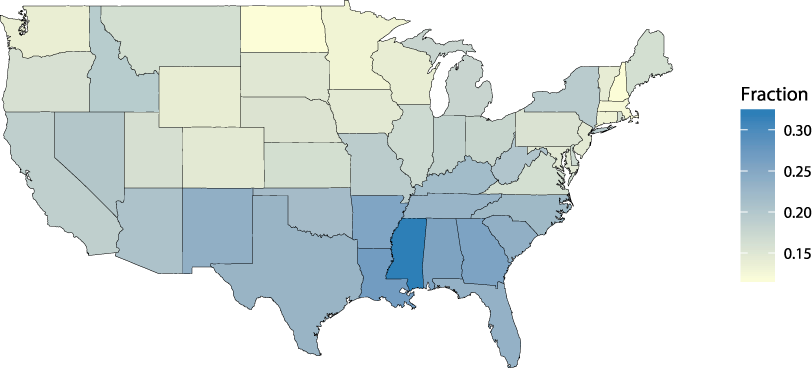
Source: Internal Revenue Service.
Description of the New Spending Data and Summary Statistics
Central to our study of the two-week EITC delay are new daily, state-level indexes of spending, as introduced in Aladangady et al. (2016). These indexes were constructed using aggregated and anonymized credit, debit, and electronic transactions from First Data, a large payment processing company.8 Spending is categorized by the type of merchant where the payment transaction occurred (for example, at a restaurant or a department store) and by the location of the merchant. Our analysis here focuses on spending at retail stores and restaurants.9 This sub-aggregate covers consumer spending on most durable goods (excluding autos), most nondurable goods (excluding gasoline), and food services, accounting for one-third of total personal consumption expenditures in the National Income and Product Accounts. Given that a large fraction of retail purchases are made via card transactions, this spending is well measured with our data set and is comparable to the Census Bureau's Retail Trade Survey.
To roughly illustrate how the timing of EITC refunds affects consumer behavior, Figure 3 plots daily, national spending in recent years. We use a trailing seven-day moving average to smooth out the large, regular day-of-the-week variation in spending. The index of daily spending for each year is expressed relative to spending in the middle week of January. To the extent that EITC households were unable to smooth spending through the PATH Act's refund delay in 2017, we would expect to observe lower retail spending between late January and late February than in previous years; conversely, spending should be higher at the end of February into early March after the delayed refunds were issued. Indeed, we broadly observe this pattern at the national level: whereas retail sales in 2014 to 2016 peaked in early-to-mid-February--in conjunction with refund issuance (vertical lines)--sales during that period in 2017 were well below the previous years' levels. Similarly, retail sales in 2017 peaked soon after refund issuance and remained somewhat higher than the levels observed in 2015 and 2016 (though not 2014) through mid-March.
Index, Seven-Day Trailing Average
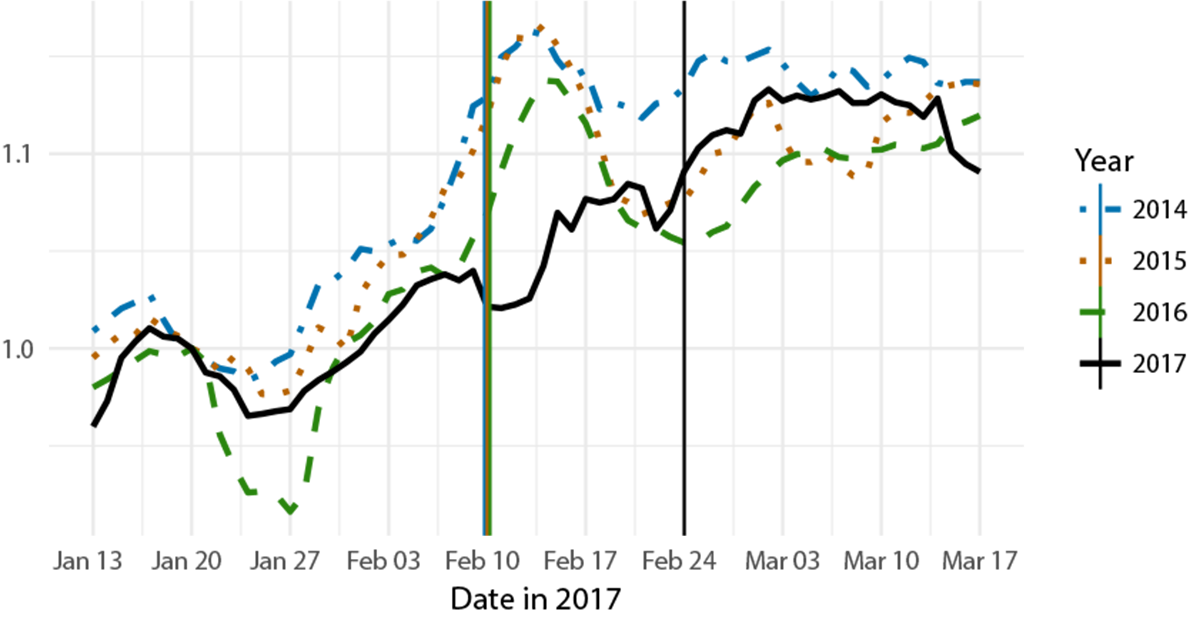
Note: Spending is a trailing, seven-day moving average, indexed to the second week of January in each year. Vertical lines correspond to week of peak refund issuance. The peak is the same in 2014, 2015, and 2016.
Source: First Data Merchant Services.
Unlike prior years, spending in 2017 did not exhibit a pronounced hump-shaped pattern around the peak week of refund issuance to EITC recipients. Of course, other factors beyond refund issuance likely affected spending around this period. For example, severe winter weather often disrupts spending early in the year, muddling such summary statistics.
Regression Estimates of the Spending Response to the EITC Refund Delay
To quantify the high-frequency spending response to the EITC refund delay, we estimate the following model of retail spending per capita in state s on day t:
We include a broad set of variables that control for the regular variation in spending across states and over time: ω for week of year, δ for day of week, Ω for year, and Ψ for holidays such as Easter and Valentine's Day. The identification of the EITC spending response relies on the policy-driven, two-week delay in issuance in 2017. Our regressor of interest is a state's per capita weekly federal income tax refund issuance to EITC recipients. In addition to contemporaneous refund issuance, we include one- and two-week leads and lags to capture possible anticipatory spending effects along with any trailing spending effects. Summing over the βj coefficients yields an estimate of the cumulative increase in spending per dollar of EITC refund in the five weeks surrounding issuance. We exclude states that were strongly affected by harsh winter storms.10
As shown in Figure 4, we find that EITC recipients spend 14 cents of every refund dollar within two weeks of receipt at retail stores and restaurants. The largest increase in spending (8 cents per refund dollar) is in the week of issuance, with successively smaller increases in the two weeks following issuance. We find no evidence of anticipatory spending effects in the weeks prior to issuance, suggesting that EITC households had limited ability to smooth spending through this short-lived income disruption by either drawing down liquid assets, such as checking accounts, or accessing short-term credit.
Fraction of refund spent at retail stores and restaurants
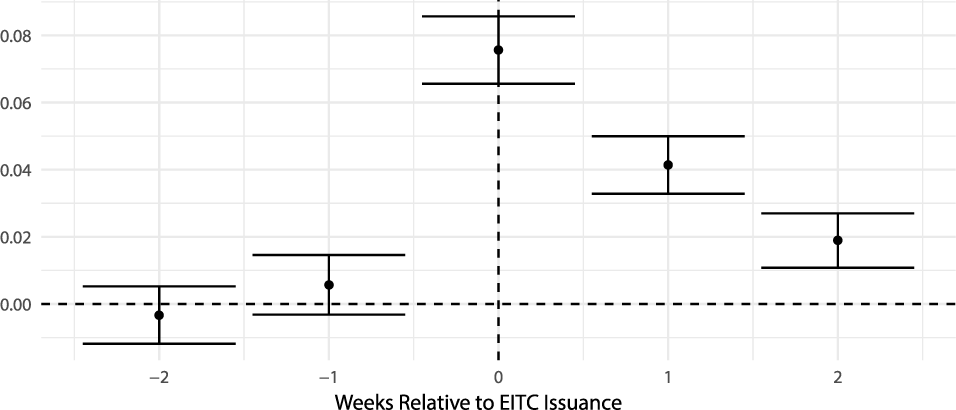
Note: Regression coefficients are denoted by circles. The vertical brackets show the 95-percent confidence intervals for each coefficient, constructed from Newey-West standard errors. Sample includes 2014 to 2017.
To interpret the magnitude of this spending increase and make comparisons to other spending propensities in the literature, we need to highlight a few unique aspects of our study. First, we study the response of low- and moderate- income consumers to a relatively limited (two-week) shift in income. As such, we focus on spending within a narrow window of only five weeks around income receipt. Second, we only examine the response in a subset of consumption categories that comprise about one-third of aggregate consumption. Thus, our estimate likely misses a sizeable portion of the spending out of refunds to EITC recipients. If we were to scale up our results to total spending, this would imply that EITC recipients spent a little less than half of their refund within two weeks. Such a response would be quite sizeable for an annual payment.11
Using weekly spending in the Nielsen Consumer Panel (NCP), Broda and Parker (2014) find that during the four weeks starting with the week of the 2008 economic stimulus payment receipt, spending on NCP-measured goods rose by 3.5 to 5.5 percent of the magnitude of the payment.12 The NCP captures a narrower subset of goods--only about 10 percent of aggregate consumer expenditures--than our spending indexes. Increasing the estimates from Broda and Parker by a factor of three, to roughly match our coverage of spending, we find a comparably large spending response to EITC refunds as to the economic stimulus payments. While EITC targets lower-income households than the 2008 stimulus payments, the EITC is also a more regular, predictable source of income.13 The sizeable, immediate spending response could reflect the low liquidity, on average, among EITC claimants and many stimulus recipients. In fact, in a separate study of the Nielsen data Parker (2017) finds that households with persistently low levels of liquidity (possibly due to impatience or poor planning skills) spend more out of the additional income.
Finally, in Figure 5 we separate the spending response into finer subcomponents: groceries, restaurants, electronics, general merchandise, and other retail stores. While previous studies have found that EITC refund spending is concentrated in vehicle purchases and repair, transportation, household durables, and electronics (Barrow and McGranahan, 2000; Goodman-Bacon and McGranahan, 2008), one striking aspect of this figure is that we find a non-trivial spending response at grocery stores and restaurants. Our estimates may, in fact, understate the response in grocery spending because general merchandise stores are often both a department and grocery store. Whereas durable purchases such as electronics can often be delayed without significantly reducing households' well-being, that is generally not the case for nondurable necessities purchased at grocery stores. As such, our results further suggest that EITC households' well-being may have been negatively affected by the disruption to income resulting from the refund delay.
Fraction of refund spent at each type of store
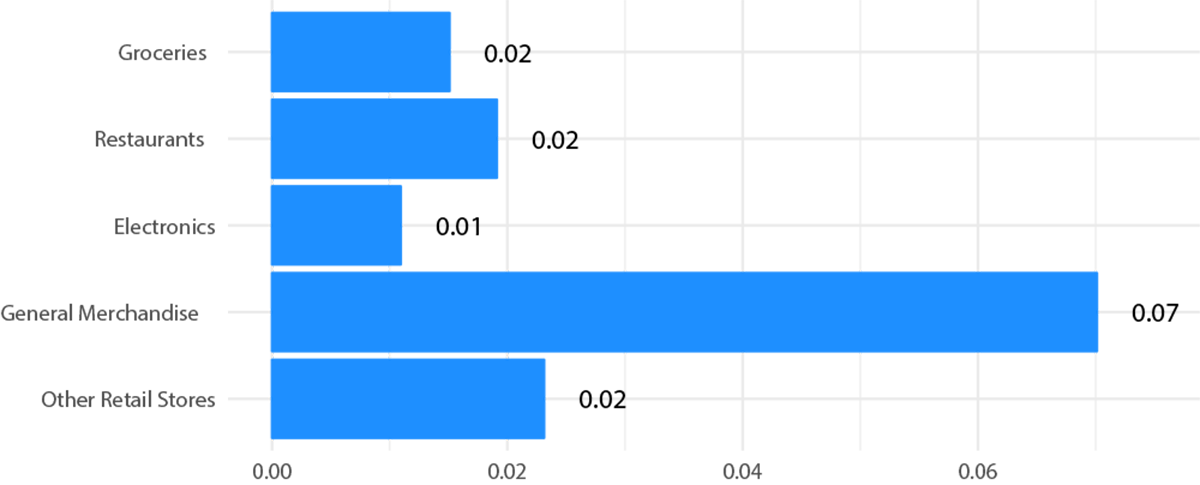
Note: The above estimates are from regressions using the same specification as equation (1), where the spending totals are within each category. Each of the estimates is statistically different from zero at the one-percent level using Newey-West standard errors. The estimate for "Other Retail Stores" is the residual of the total spending estimate.
Taken as a whole, our results suggest limited access to liquidity for low- to moderate-income households, such that even a short-lived delay in income of a few weeks can lead to notable changes in spending with potentially negative effects on these households' well-being.
References
Aladangady, Aditya, Shifrah Aron-Dine, Wendy Dunn, Laura Feiveson, Paul Lengermann, and Claudia Sahm. (December 2016). The Effect of Sales-Tax Holidays on Consumer Spending. FEDS Notes. Retrieved from: https://www.federalreserve.gov/econresdata/notes/feds-notes/2016/effect-of-hurricane-matthew-on-consumer-spending-20161202.html
Baker, Scott and Yannelis, Constantine (January 2017). Income changes and consumption: Evidence from the 2013 federal government shutdown. Review of Economic Dynamics. Retrieved from: http://ac.els-cdn.com/S1094202516300308/1-s2.0-S1094202516300308-main.pdf?_tid=f8dcde3c-82ad-11e7-b6c5-00000aab0f6b&acdnat=1502907117_16d7af51c9a41e8780efcad56dfecc06
Baugh, Brian, Itzhak Ben-David, Hoonsuk Park, Jonathan A. Parker (May 2018). A Test of Consumption Smoothing and Liquidity Constraints: Spending Responses to Paying Taxes and Receiving Refunds. Working Paper. Retrieved from: https://www.dropbox.com/s/as7wl1wzqv0xfrc/20180517%20Tax%20Refunds.pdf?dl=1
Board of Governors of the Federal Reserve System, Report on the Economic Well-Being of U.S. Households in 2017 (Washington: Board of Governors, May 2018) Retrieved from: https://www.federalreserve.gov/publications/files/2017-report-economic-well-being-us-households-201805.pdf
Bracha, Anat and Daniel Cooper. (September 2014). Asymmetric responses to income changes: The payroll tax increase versus tax refund in 2013. Economics Letters. Retrieved from: http://ac.els-cdn.com/S0165176514002857/1-s2.0-S0165176514002857-main.pdf?_tid=0fc8056a-81cb-11e7-89c5-00000aab0f6c&acdnat=1502809660_73bf68230f6de59134c7e2640f7e3570
Broda, Christian and Jonathan A. Parker. (December 2014). The Economic Stimulus Payments of 2008 and the Aggregate Demand for Consumption. Journal of Monetary Economics. . Retrieved from: https://www.sciencedirect.com/science/article/pii/S0304393214001366
Cowley, Stacy. (January 2017) "Tax Refund Loans Are Revamped and Resurrected." The New York Times. January, 15, 2017. Retrieved from: https://www.nytimes.com/2017/01/15/business/tax-refund-loans-are-revamped-and-resurrected.html
Hoynes, Hillary and Jesse Rothstein. (March 2016). Tax Policy Toward Low-Income Families. Retrieved from: https://gspp.berkeley.edu/assets/uploads/research/pdf/HoynesRothstein_formatted.pdf
Goodman-Bacon, Andrew and Leslie McGranahan. (2008). How do EITC Recipients Spend their Refunds? Economic Perspectives. Retrieved from: https://www.chicagofed.org/publications/economic-perspectives/2008/2qtr2008-part2-goodman-etal
Jappelli, Tullio and Luigi Pistaferri (October 2014). Fiscal Policy and MPC Heterogeneity. American Economic Journal: Macroeconomics. Retrieved from: https://www.aeaweb.org/articles?id=10.1257/mac.6.4.107
Johnson, David S., Jonathan A. Parker, and Nicholas S. Souleles. (December 2006) Household Expenditure and the Income Tax Rebates of 2001. American Economic Review. Retrieved from: http://pubs.aeaweb.org/doi/pdfplus/10.1257/aer.96.5.1589
Kueng, Lorenz. (forthcoming) "Excess Sensitivity of High-Income Consumers." Quarterly Journal of Economics. Retrieved from: https://economics.harvard.edu/files/economics/files/ms26188.pdf
Maag, Elaine, Stephen Roll, Jane Oliphant. (December 2016). Delaying Tax Refunds for Earned Income Tax Credit and Additional Child Tax Credit Claimants. Tax Policy Center. Retrieved from: http://www.urban.org/sites/default/files/publication/86336/2001018-delaying-tax-refunds-for-earned-income-tax-credit-and-additional-child-tax-credit-claimants_0.pdf
Morduch, Jonathan and Rachel Schneider. (2017) The Financial Diaries: How American Families Cope in a World of Uncertainty. Princeton University Press.
Parker, Jonathan A. (2017). "Why Don't Households Smooth Consumption? Evidence from a $25 million experiment." American Economic Journal: Macroeconomics Retrieved from: https://www.aeaweb.org/articles?id=10.1257/mac.20150331
1. Source: Internal Revenue Service (January 2018). Statistics for Tax Returns with EITC. Retrieved from: https://www.eitc.irs.gov/eitc-central/statistics-for-tax-returns-with-eitc/statistics-for-tax-returns-with-eitc. See also Hoynes and Rothstein (2016) and references therein for more discussion of the EITC. Return to text
2. A majority of individuals receive their refunds as a direct deposit within a few days of IRS issuance. The time between issuance and receipt is slightly longer for those who receive their refunds in other forms. Return to text
3. The new IRS provisions were included in the PATH Act, which passed in December 2015. The required waiting period before refund issuance, intended to provide the IRS with additional time to detect tax fraud, applies to all tax returns that claim either the EITC or an additional child tax credit (ACTC). The entire refund to the tax filer must be held for processing, even that portion not related to the EITC/ACTC. The analysis and the refund data used in this note also includes refunds with an ACTC, but we abstract from the ACTC in the text. Many, but not all filers, who receive an ACTC also receive an EITC. Return to text
4. Source: Internal Revenue Service, Refund Timing for Earned Income Tax Credit and Additional Child Tax Credit Filers. Retrieved from: https://www.irs.gov/individuals/refund-timing Return to text
5. Weekly "issuance" refers to the week in which the Treasury made a withdrawal from its operating cash balance in order to send out a refund. It does not necessarily imply that the refund appeared in a household's bank account during the same week. Return to text
6. Survey evidence from 2016 also suggests that EITC claimants were largely unaware of the delay in refund issuance due to the PATH Act. Despite the fact that PATH was enacted in December 2015, Maag et al. (2016) document that 91 percent of the 981 respondents to the 2016 Household Financial Survey (HFS) who claimed the EITC (or ACTC) said that they had not heard about the refund delay. Return to text
7. The number of RALs jumped from 470,000 returns in 2016 to 1.7 million returns in 2017. The total in 2017 covers 1.6 percent of returns with a refund. In states such as Mississippi, Arkansas, and West Virginia, more than 5 percent of filers with a refund used a RAL (Source: Internal Revenue Service: Research, Applied Analytics, & Statistics). See Cowley (2017) for news coverage on the expansion of these loans in 2017. Return to text
8. These spending indexes are the outcome of an ongoing collaboration between the Federal Reserve Board, Palantir Technologies, and First Data Merchant Services, LLC (First Data). Return to text
9. Specifically, we focus on all spending at retail stores and restaurants other than sales at motor vehicle dealers, building material stores, and gasoline stations. These establishments are the ones in the Census retail sales data that the BEA uses to construct its estimate of personal consumer expenditures in GDP. While we exclude gasoline stations from this analysis, First Data has good coverage of gasoline stations and some other service industries. Return to text
10. We exclude Alaska, Connecticut, Maine, Massachusetts, New Hampshire, New Jersey, New York, North Dakota, Rhode Island, Vermont, and the District of Columbia from the regression. Adding these states to the analysis and roughly controlling for the winter storms has a minimal effect on our results. We also exclude Hawaii due to data quality issues. Return to text
11. From their survey, Maag et al (2016) find that almost 70 percent of early EITC filers with children said that they spent at least some of their refund within one month. Another common response was using the refund to immediately pay down debt. Return to text
12. The marginal propensity to consume (MPC) from other studies are hard to compare due to differences in the time window for the spending response, the types of spending covered, and the representativeness of the sample. Bracha and Cooper (2014) find an MPC of 0.6 per additional dollar of tax refund, but examine a larger subset of spending and over a longer time period. Jappelli and Pistaferri (2014) find an average MPC of 0.48 out of an unexpected, transitory income shock, which varies by wealth of household. Baker and Yannelis (2016) find that the government shutdown in 2013 and its temporary delay of paychecks to some federal government employees reduced spending in the week of the shutdown by 30 to 40 percent among the affected households. But this study and Baugh et al (2018), which finds an MPC of 0.3 within one month of tax refund receipt, both rely on data from online apps whose users have a higher income than the population as whole. Finally, Johnson, Parker and Souleles (2006) find an MPC of 0.2 to 0.4 out of income tax rebates, but focus specifically on nondurable spending over a three-month period surrounding rebate receipt. Return to text
13. Kueng (forthcoming) also examines the spending response out of a regular, predictable source of income. Specifically, the author examines the spending response to annual Alaska Permanent Fund payments. However, the differences in the frequency and scope of the spending data, as well as the population affected, complicate comparisons to this study. Return to text
Aladangady, Aditya, Shifrah Aron-Dine, David Cashin, Wendy Dunn, Laura Feiveson, Paul Lengermann, Katherine Richard, and Claudia Sahm (2018). "High-frequency Spending Responses to the Earned Income Tax Credit," FEDS Notes. Washington: Board of Governors of the Federal Reserve System, June 21, 2018, https://doi.org/10.17016/2380-7172.2199.
Disclaimer: FEDS Notes are articles in which Board staff offer their own views and present analysis on a range of topics in economics and finance. These articles are shorter and less technically oriented than FEDS Working Papers and IFDP papers.