FEDS Notes
January 19, 2024
Inflation Perceptions During the Covid Pandemic and Recovery
David Lebow and Ekaterina Peneva
Since 2016, the Michigan Surveys of Consumers (MSC) have included questions on inflation perceptions—what people believe inflation to have been—that are worded symmetrically with their long-standing questions on inflation expectations. The questions on inflation perceptions are currently posed four times a year—in February, May, August, and November. Using available data at the time, Axelrod, Lebow, and Peneva (2018) concluded that inflation expectations and perceptions are very similar and that if perceptions were to change, expectations were likely to change as well.1
In this note, we focus on the behavior of inflation perceptions and expectations since the Covid pandemic began, based on data through November 2023. Our main findings are:
- The central tendency of inflation perceptions suggests that households recognized, with surprising accuracy, the timing and the magnitude of the initial run up in in inflation.
- However, perceptions of 12-month inflation continued to increase past the peak of actual inflation. Inflation perceptions have been coming down, but more slowly and from a higher level than actual inflation.
- Inflation expectations, especially over the longer-term, have remained well below perceived inflation; that is, households expect the high inflation observed over the last few years to be transitory.
- Median inflation perceptions have differed notably for people with different self-identified political party affiliations, while differences across demographic groups have been relatively small.
- A strong negative correlation between inflation (both actual and perceptions) and consumer sentiment re-emerged during the pandemic recovery.
I. Time series results for inflation perceptions and inflation expectations
The Covid-19 crisis and its aftermath, including the policy responses, led to enormous changes in inflation. Prices for many items—especially gasoline, clothing, transportations services, and accommodations—fell during the sharp economic downturn in March and April of 2020, while prices of some other items—especially food at grocery stores—posted unusually large increases at that time. On net, the dominant pressure on inflation was clearly downward at the beginning of the pandemic. In the spring of 2021, however, prices for some items turned up sharply, and by the fall of 2021 the price increases had become widespread. By 2022, inflation had risen to levels not seen in 40 years. Inflation then began to recede and declined throughout 2023.
Before the pandemic, the MSC median household perceptions of 12-month inflation were about in line with published CPI inflation (Figure 1).2 At the start of the pandemic in the spring of 2020, the median 12-month perceptions ticked down but did not fall as much as actual inflation did. However, as inflation started trending up in 2021, households were quick to update their perceptions, and they did so remarkably accurately and quickly (judging by the median response) through early 2022.3 And as with actual inflation, 12-month inflation perceptions declined through 2023, though with a lag: Median inflation perceptions moved somewhat higher than CPI inflation, reaching 10 percent in late 2022, and perceptions have remained above published inflation since then even as they have been coming down. In the latest reading, for November 2023, the median respondent perceived inflation to have been 6.4 percent over the past year, well above the 3.1 percent change in the headline CPI over the twelve months ending in November.4
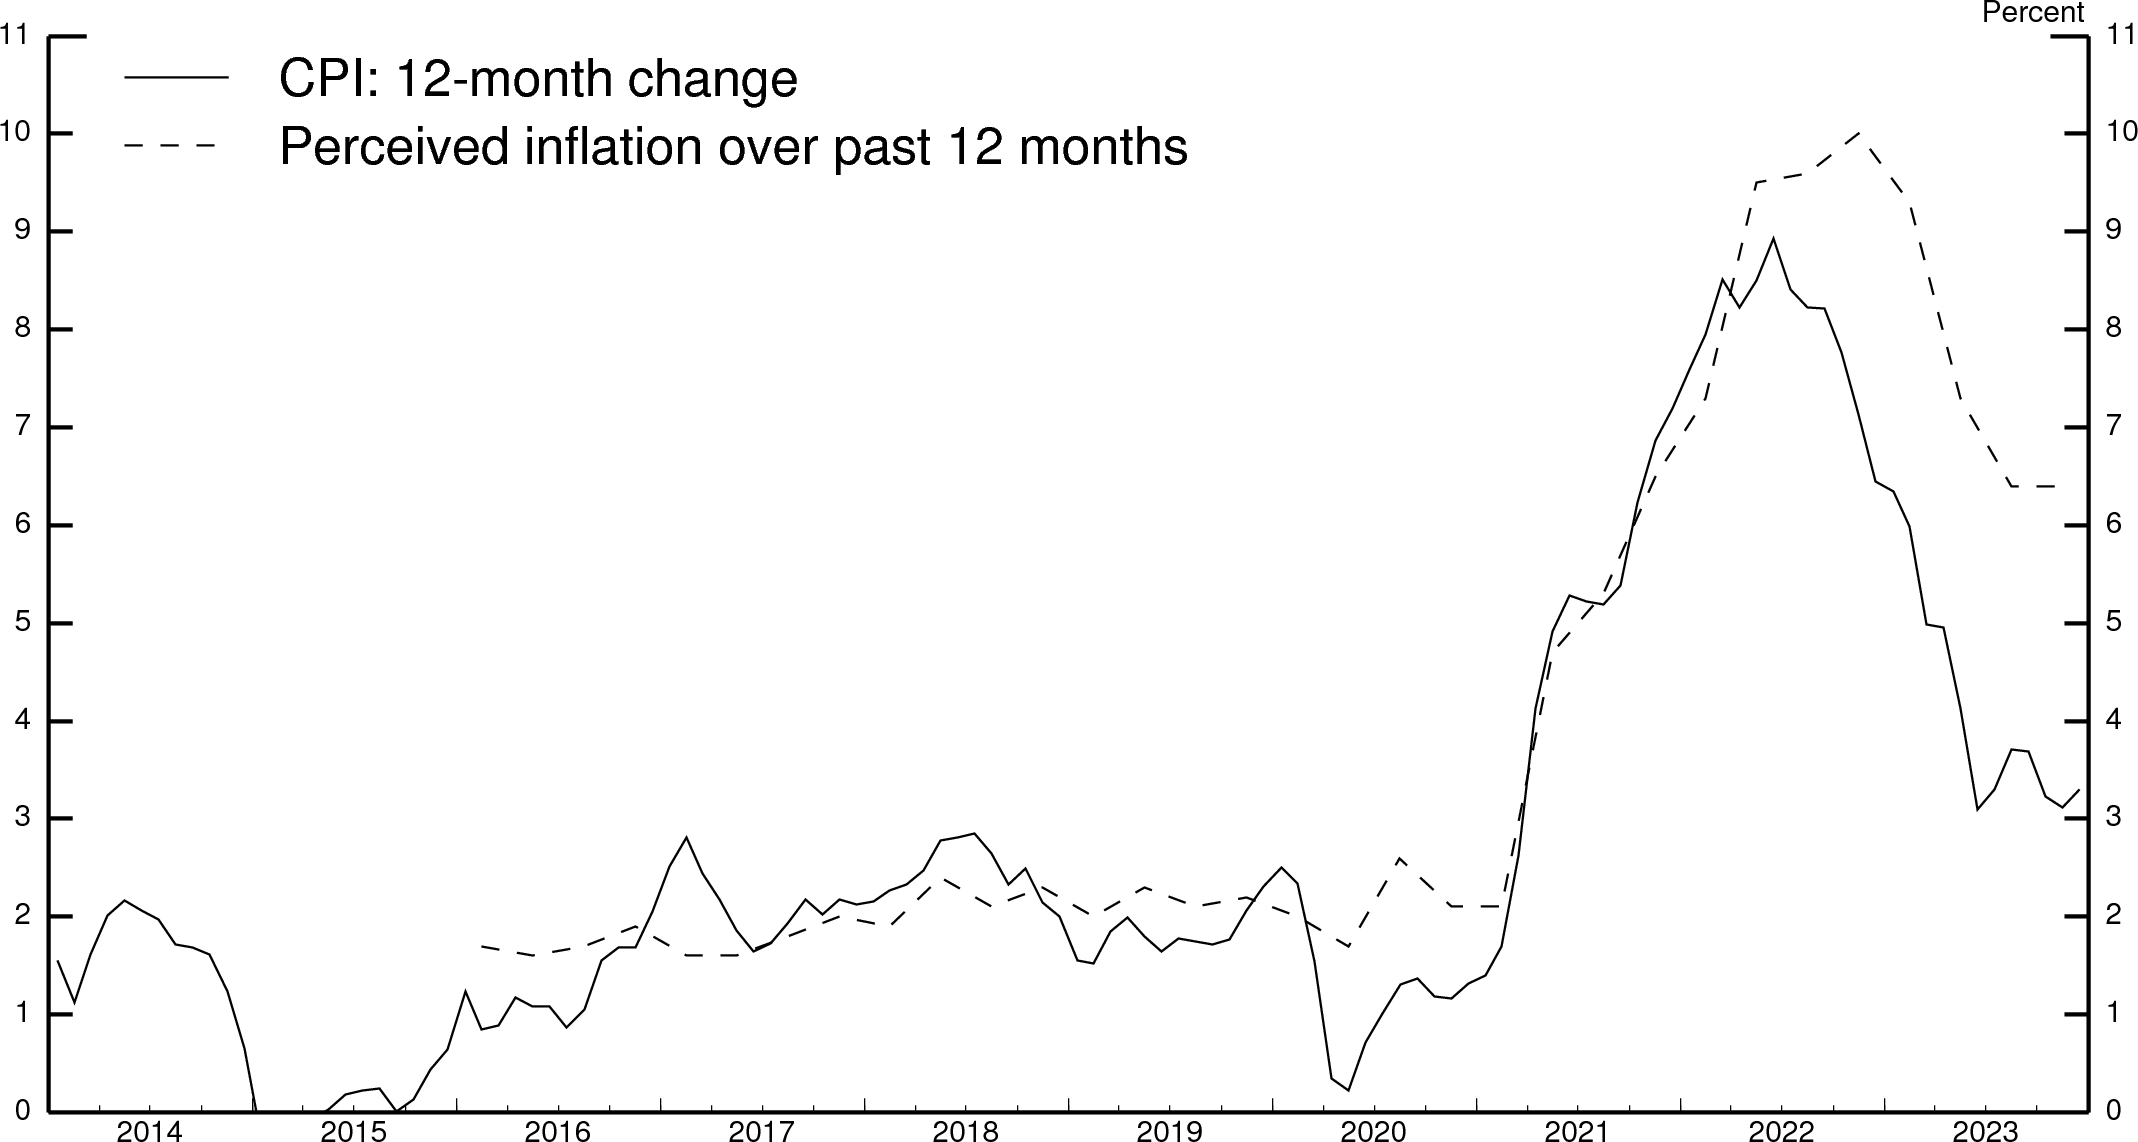
Source: University of Michigan Surveys of Consumers, Bureau of Labor Statistics.
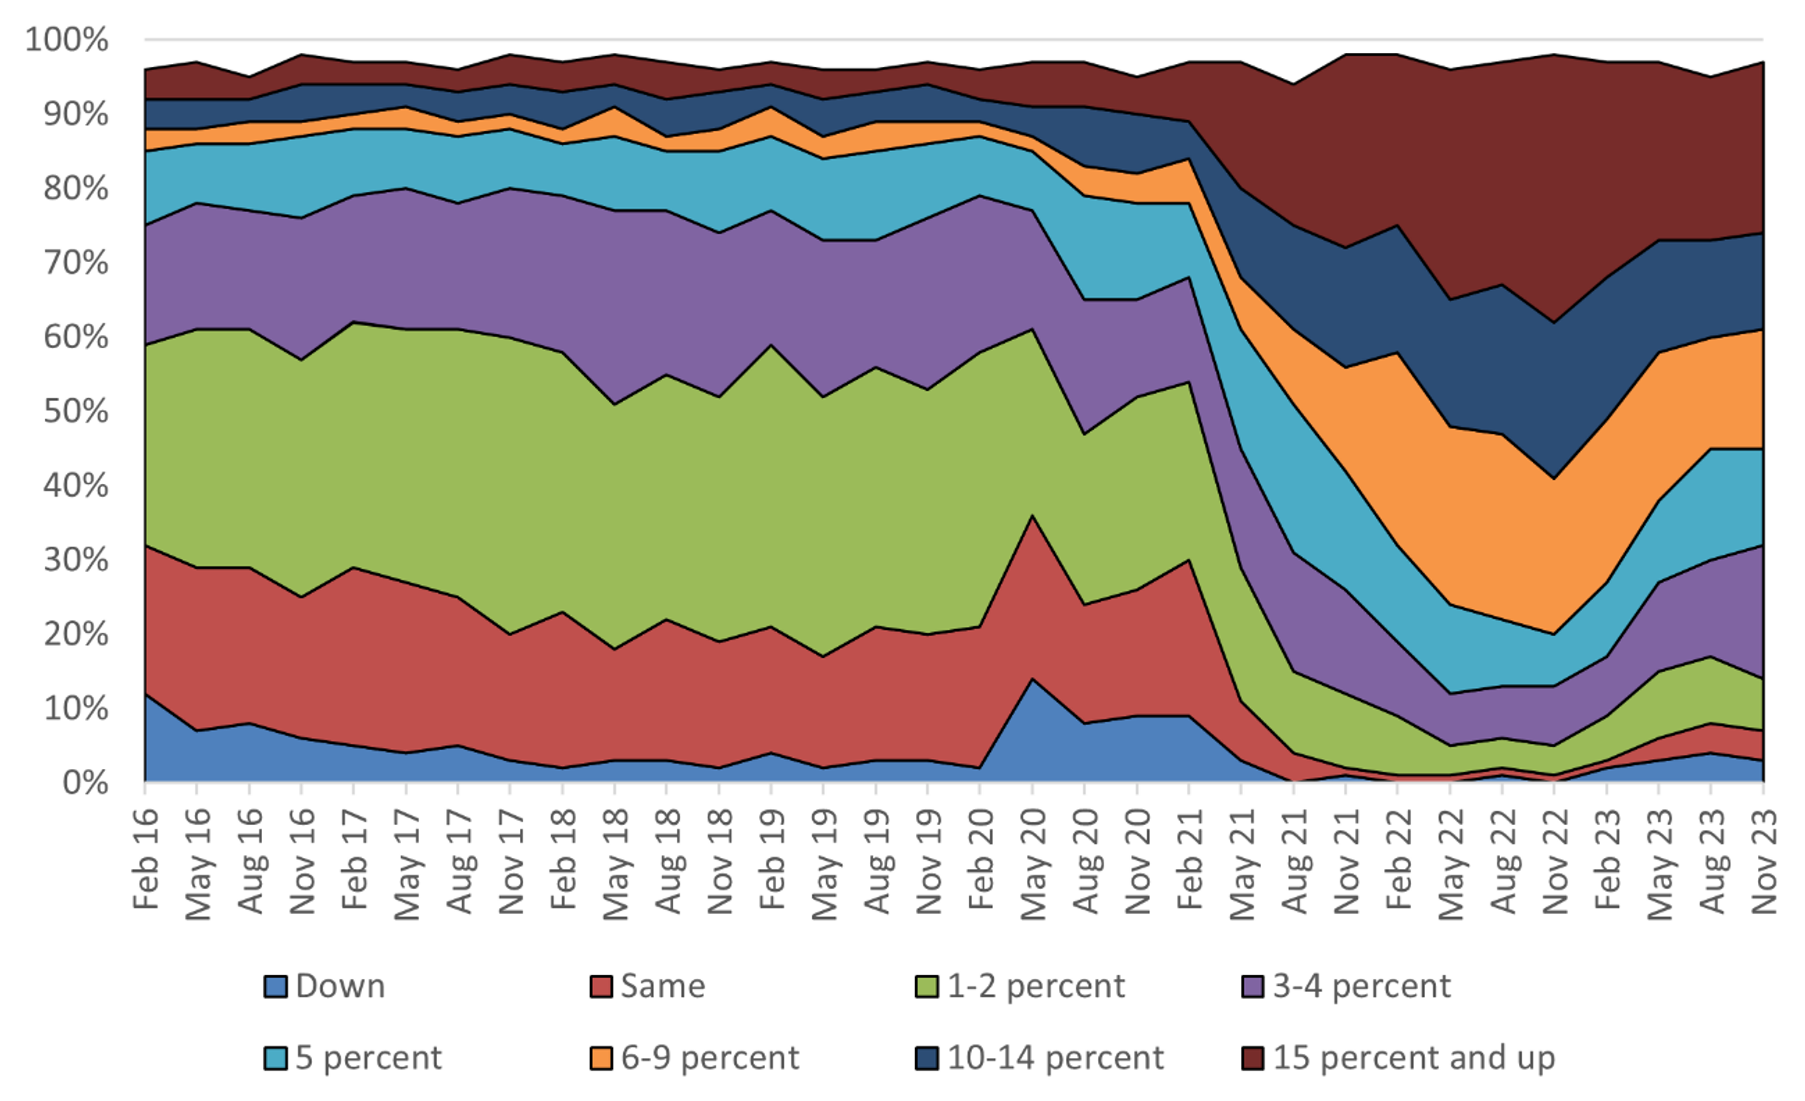
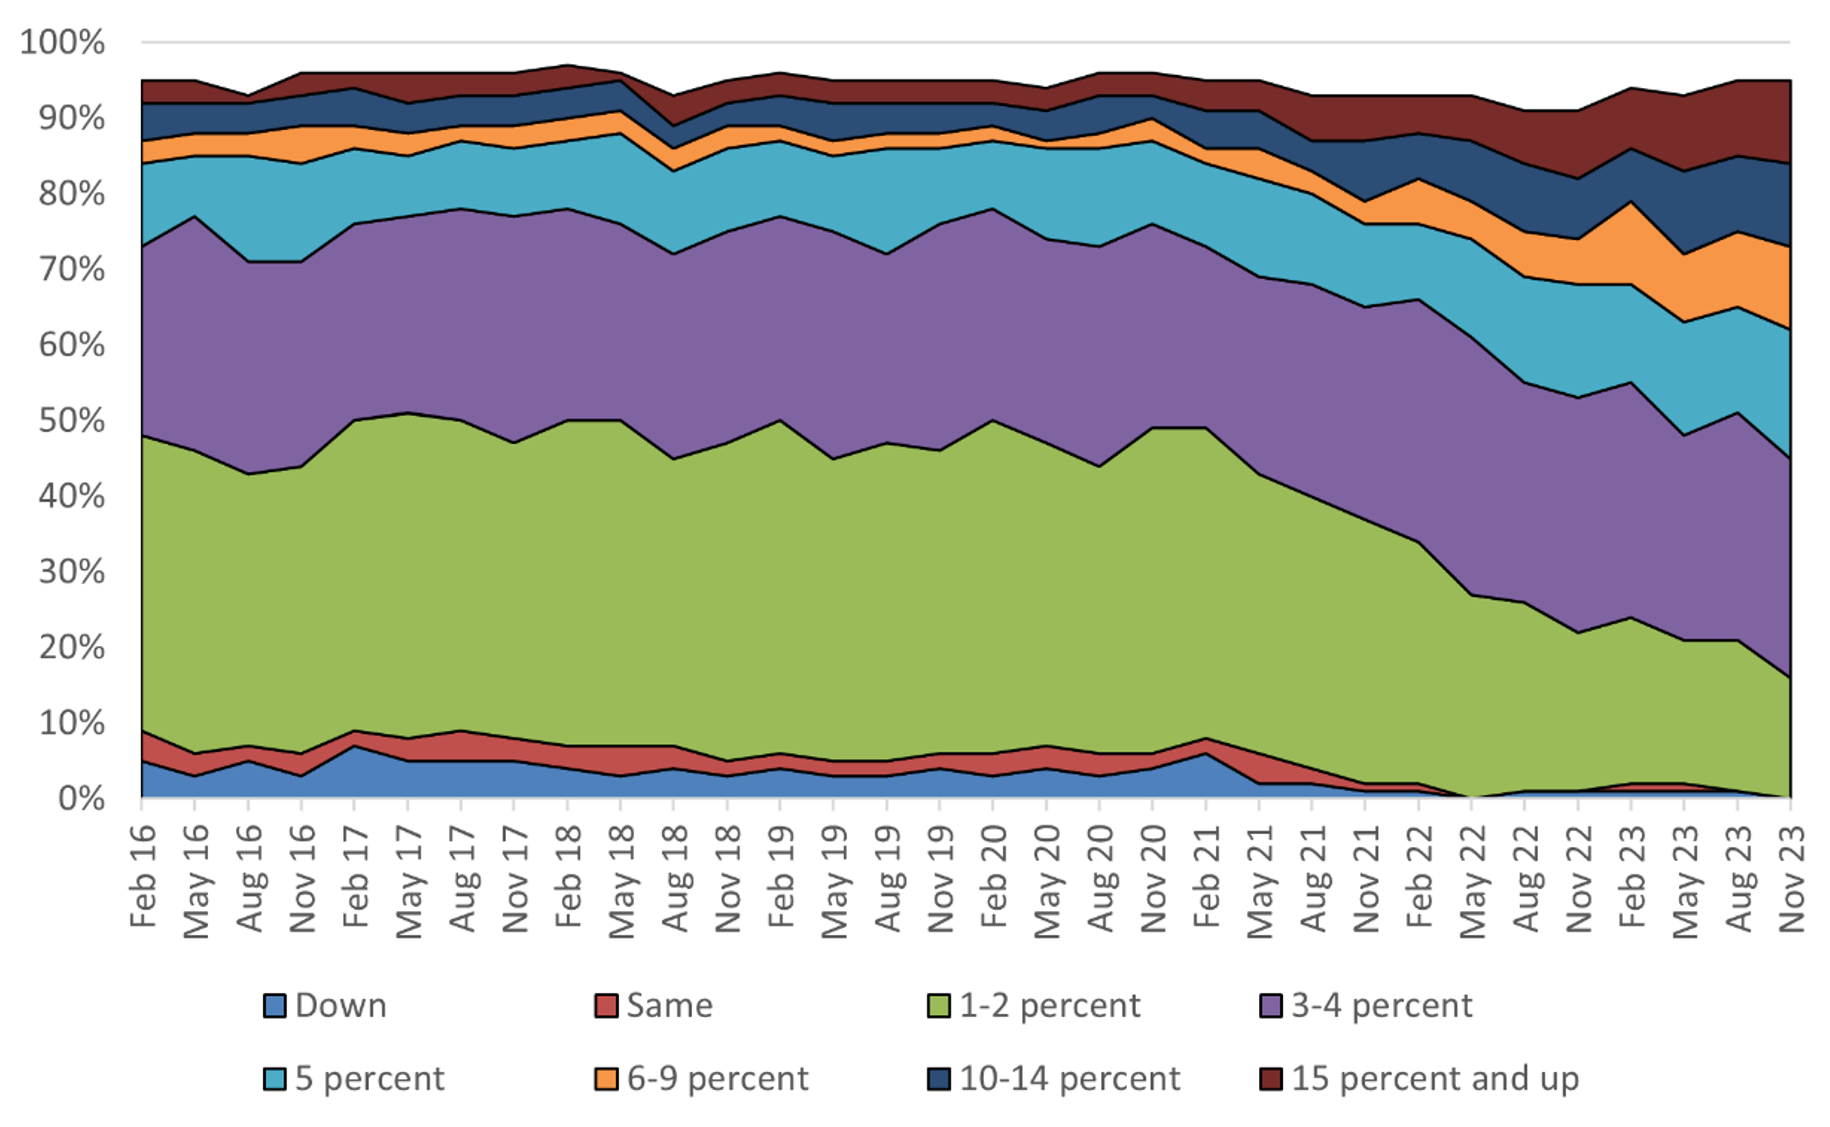
Some findings from the recent literature on inflation perceptions and expectations may be relevant for understanding why inflation perceptions increased in line with actual inflation but are falling more slowly. For example, when people base their responses on their personal experiences, they both are more likely to focus on extreme price changes and tend to recall price increases more readily than price decreases (e.g., Bruine de Bruin et al., 2011, 2012, Jungermann, 2007). More recently, for example, D'Acunto et al. (2021) argue that grocery shopping explains the finding that women tend to have persistently higher inflation expectations than men. The authors argue that because grocery prices are volatile and positive price changes are especially memorable, women (who traditionally do most of the grocery shopping) end up having higher inflation expectations. During the covid pandemic and recovery, the size and especially the frequency of positive price changes increased (see Montag and Villar, 2023), inflation became widespread and was intensively covered by the media. In other words, all consumers were exposed to broad-based positive price changes, which likely explains why we do not see notable differences between the median perceptions of the various demographic groups. The broad media coverage of the bad inflation news likely also contributed to the accurate increase in the median perception. At the same time, since media coverage tends to follow negative economic conditions more closely than positive conditions (Goidel and Langley, 1995), it may be contributing to the sluggish decline in perceptions. Indeed, over the past year, with falling inflation, fewer households mention bad news about prices in the MSC but even in the most recent surveys, consumers mention bad news about prices more than good news (Figure 2).5 The ongoing prevalence of unfavorable news heard about prices might also reflect the fact that while the rate of inflation has come down, people are not seeing and hearing about declines in the level of prices.
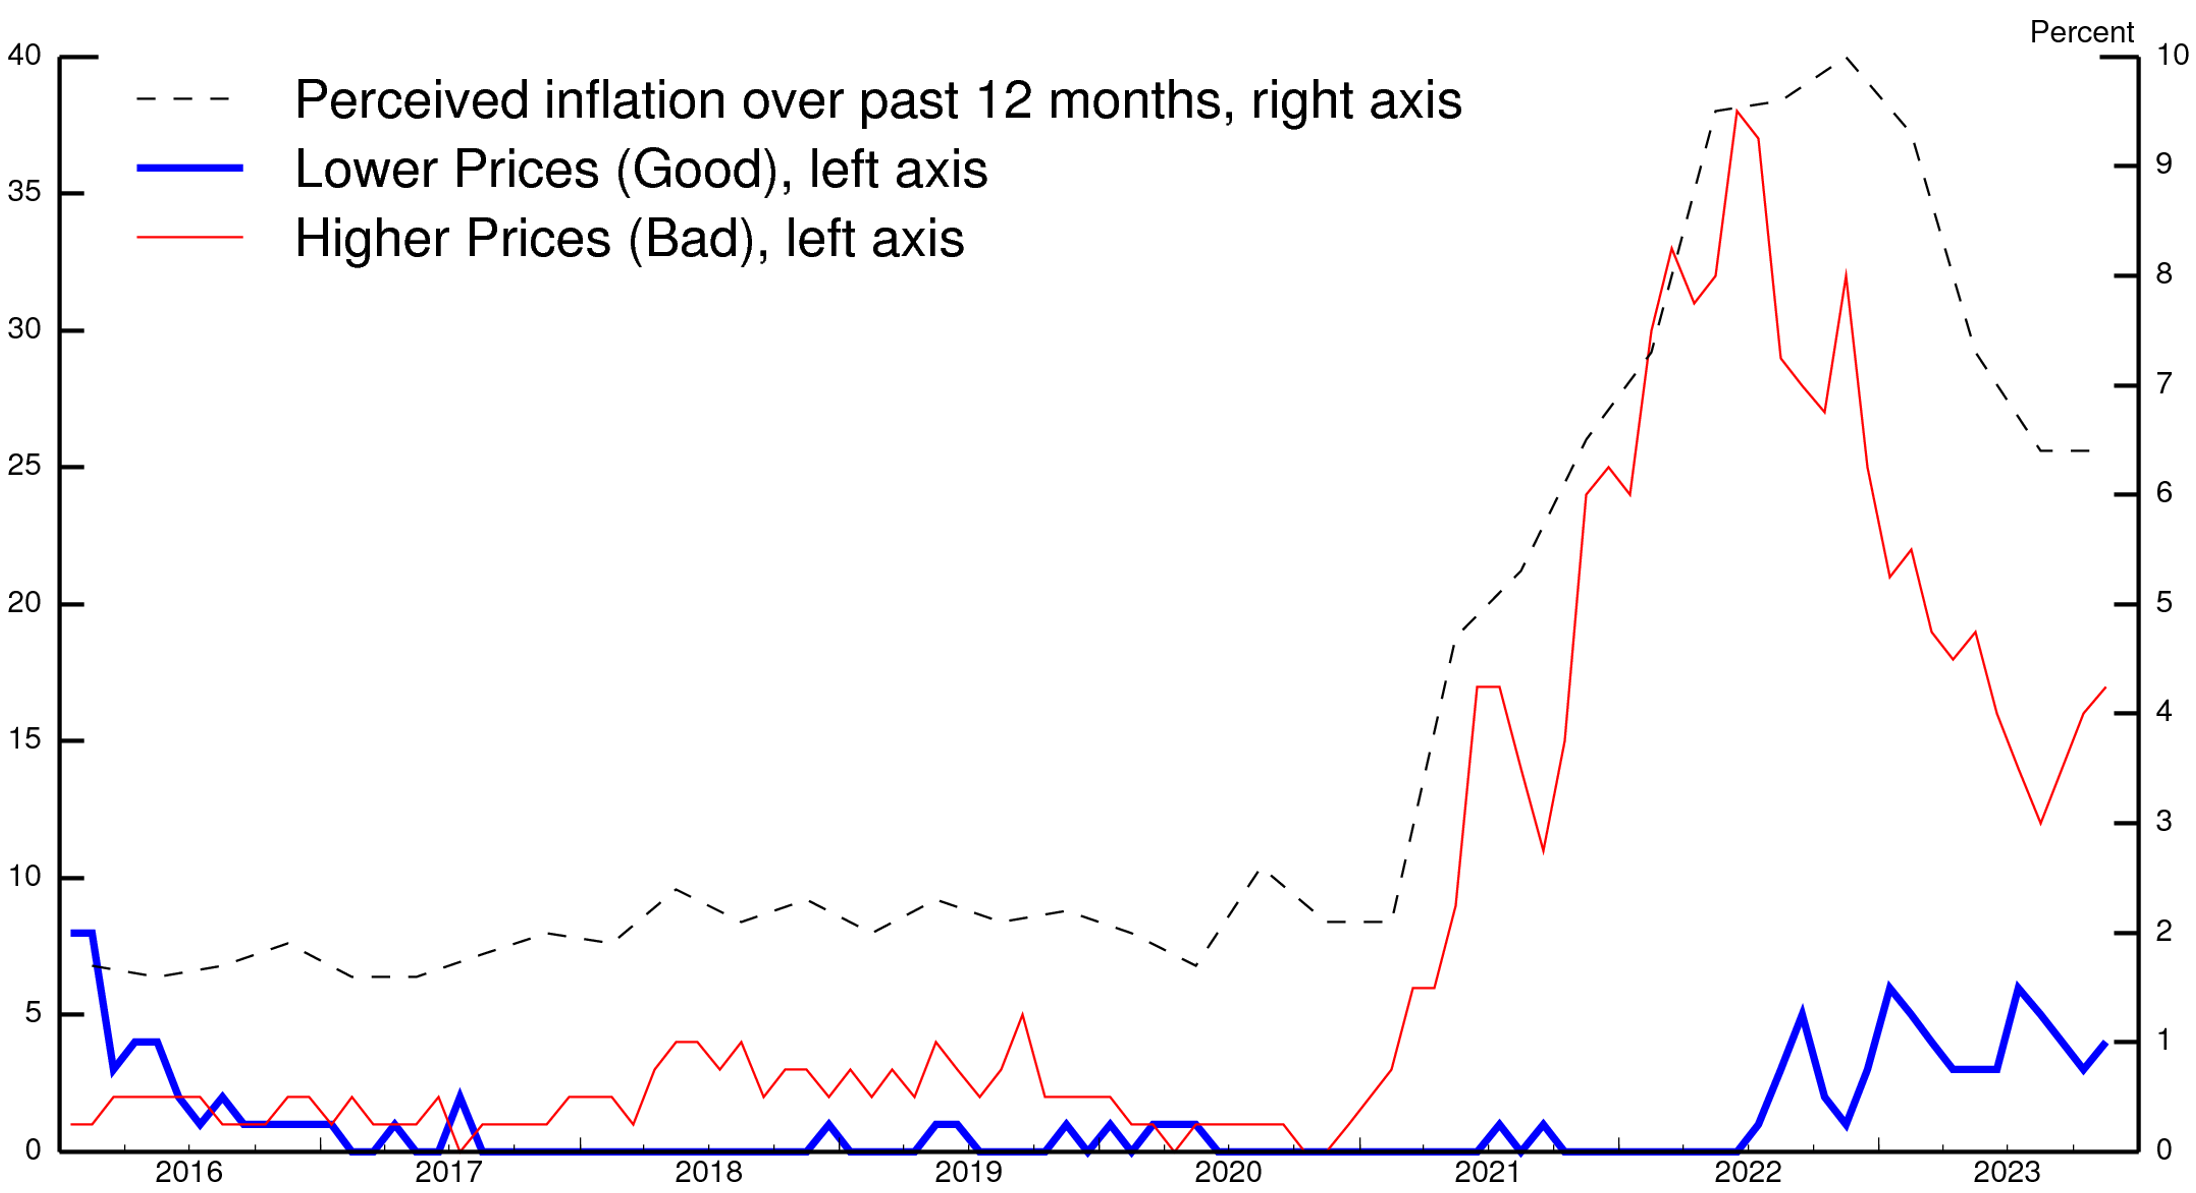
Source: University of Michigan Surveys of Consumers.
As with inflation perceptions, median short-term inflation expectations turned up in 2021 and moved lower on net over 2022-23 (Figure 3). However, since early 2021, 12-month perceptions have been much higher than 12-month expectations, indicating that households were viewing the elevated inflation during and after the pandemic as transitorily high and did not expect such high inflation readings to be repeated.6 Meanwhile, long-term inflation expectations have remained well below short-term expectations, further indicating that the high inflation was expected to be transitory. Median inflation expectations over the next 5 to 10 years only edged up during the covid recovery, and while they remain slightly elevated relative to their level in 2016-19 they have remained within the range seen in the 2000s, when inflation was running around 2 percent.
Figure 3. Median Inflation Perceptions and Expectations
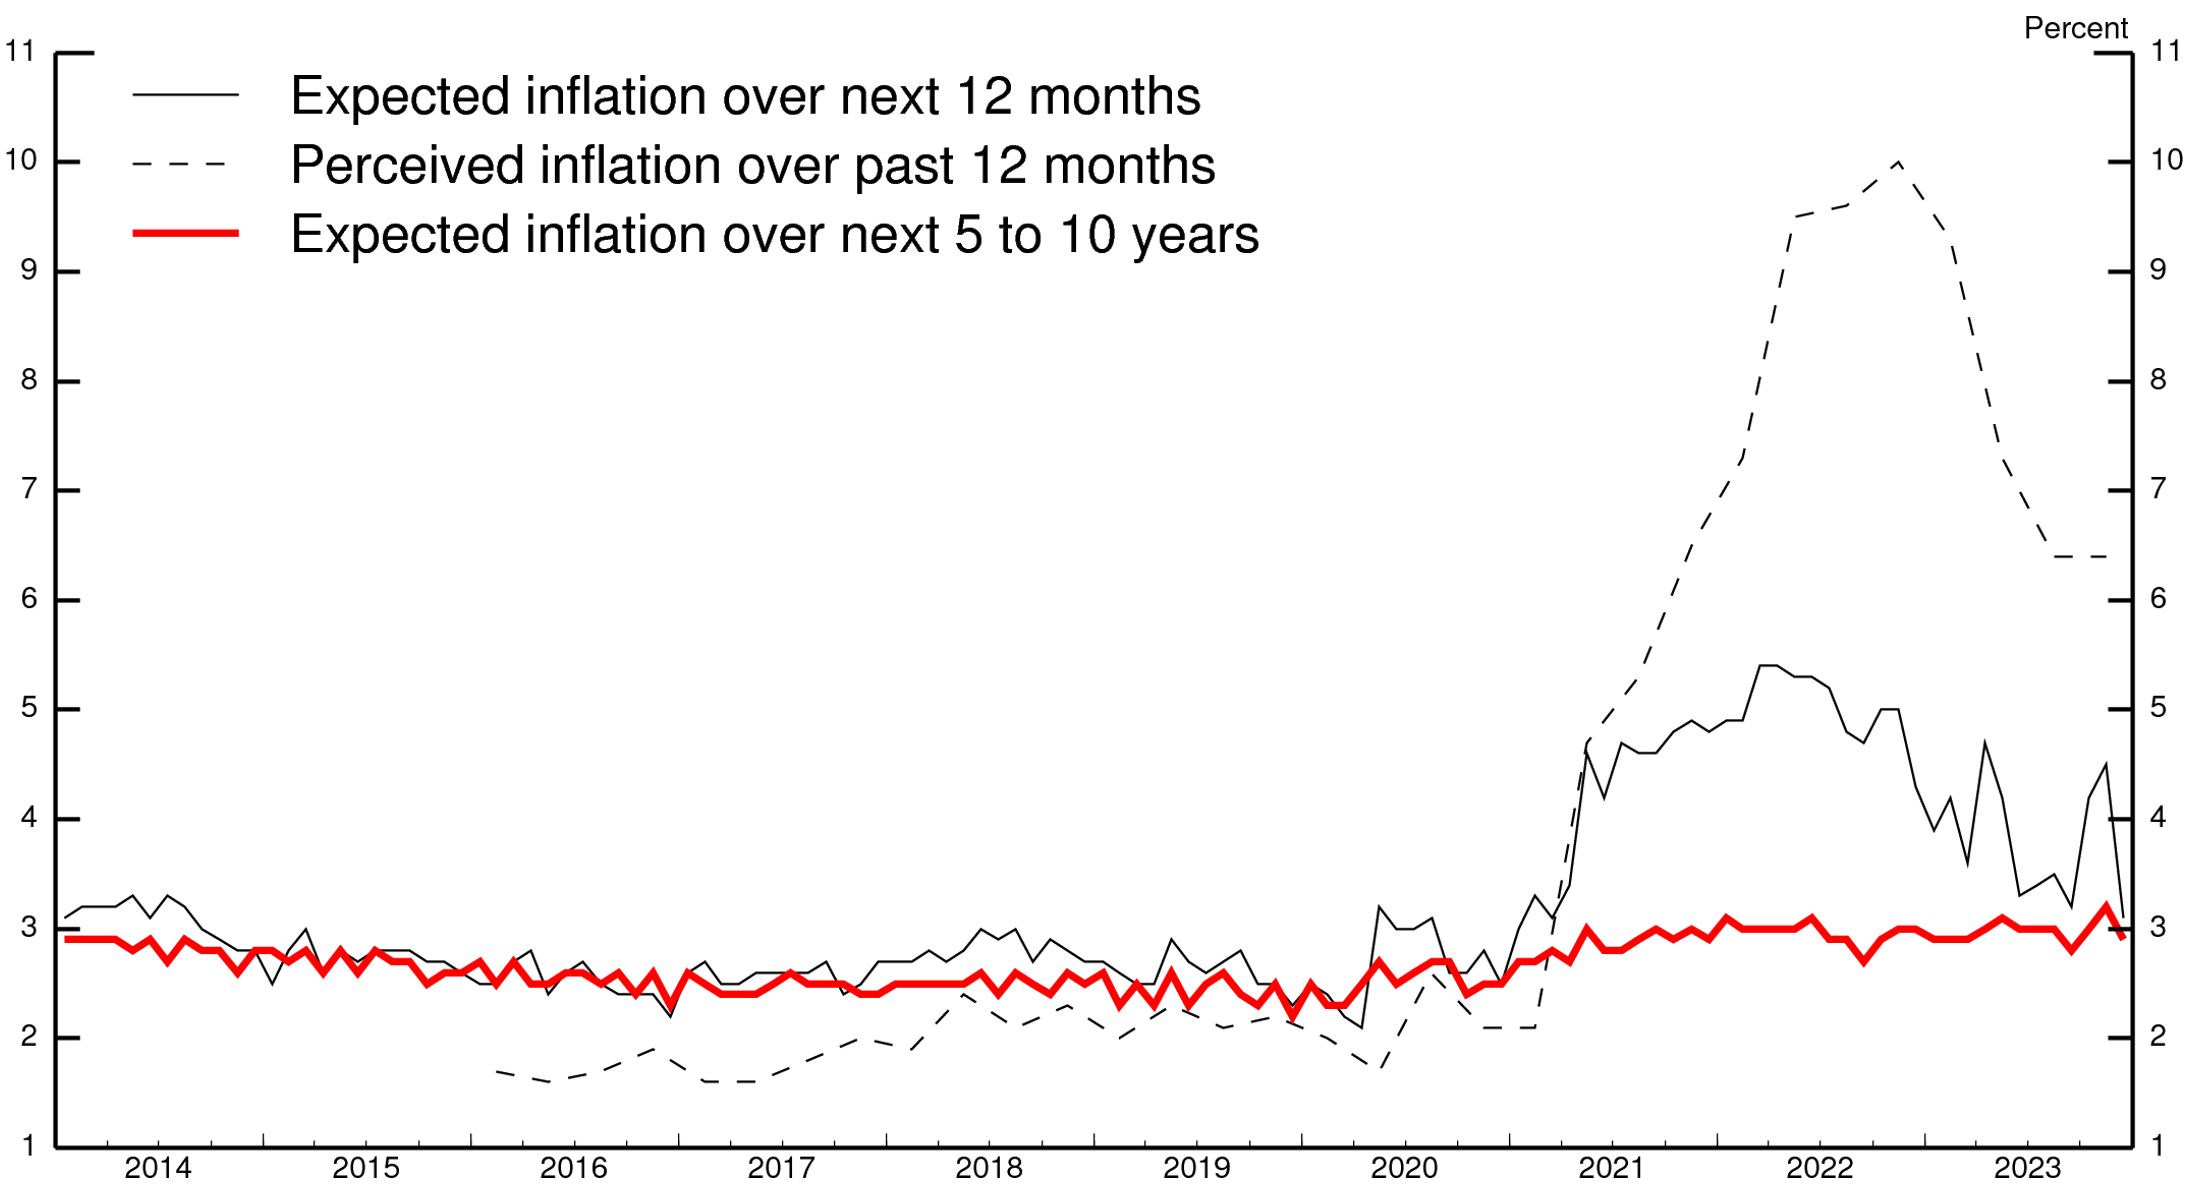
Note: The end observation for perceived inflation is November 2023. The end observation for expected inflation is from the December 2023 survey.
Source: University of Michigan Surveys of Consumers.
While the median short-term perception was running a little below the median long-term perception prior to the pandemic (Figure 4), it is has been running much higher than the median long-term perception for the last few years, indicating that households clearly realize that inflation over the past few years has been unusually high by recent historical standards.7
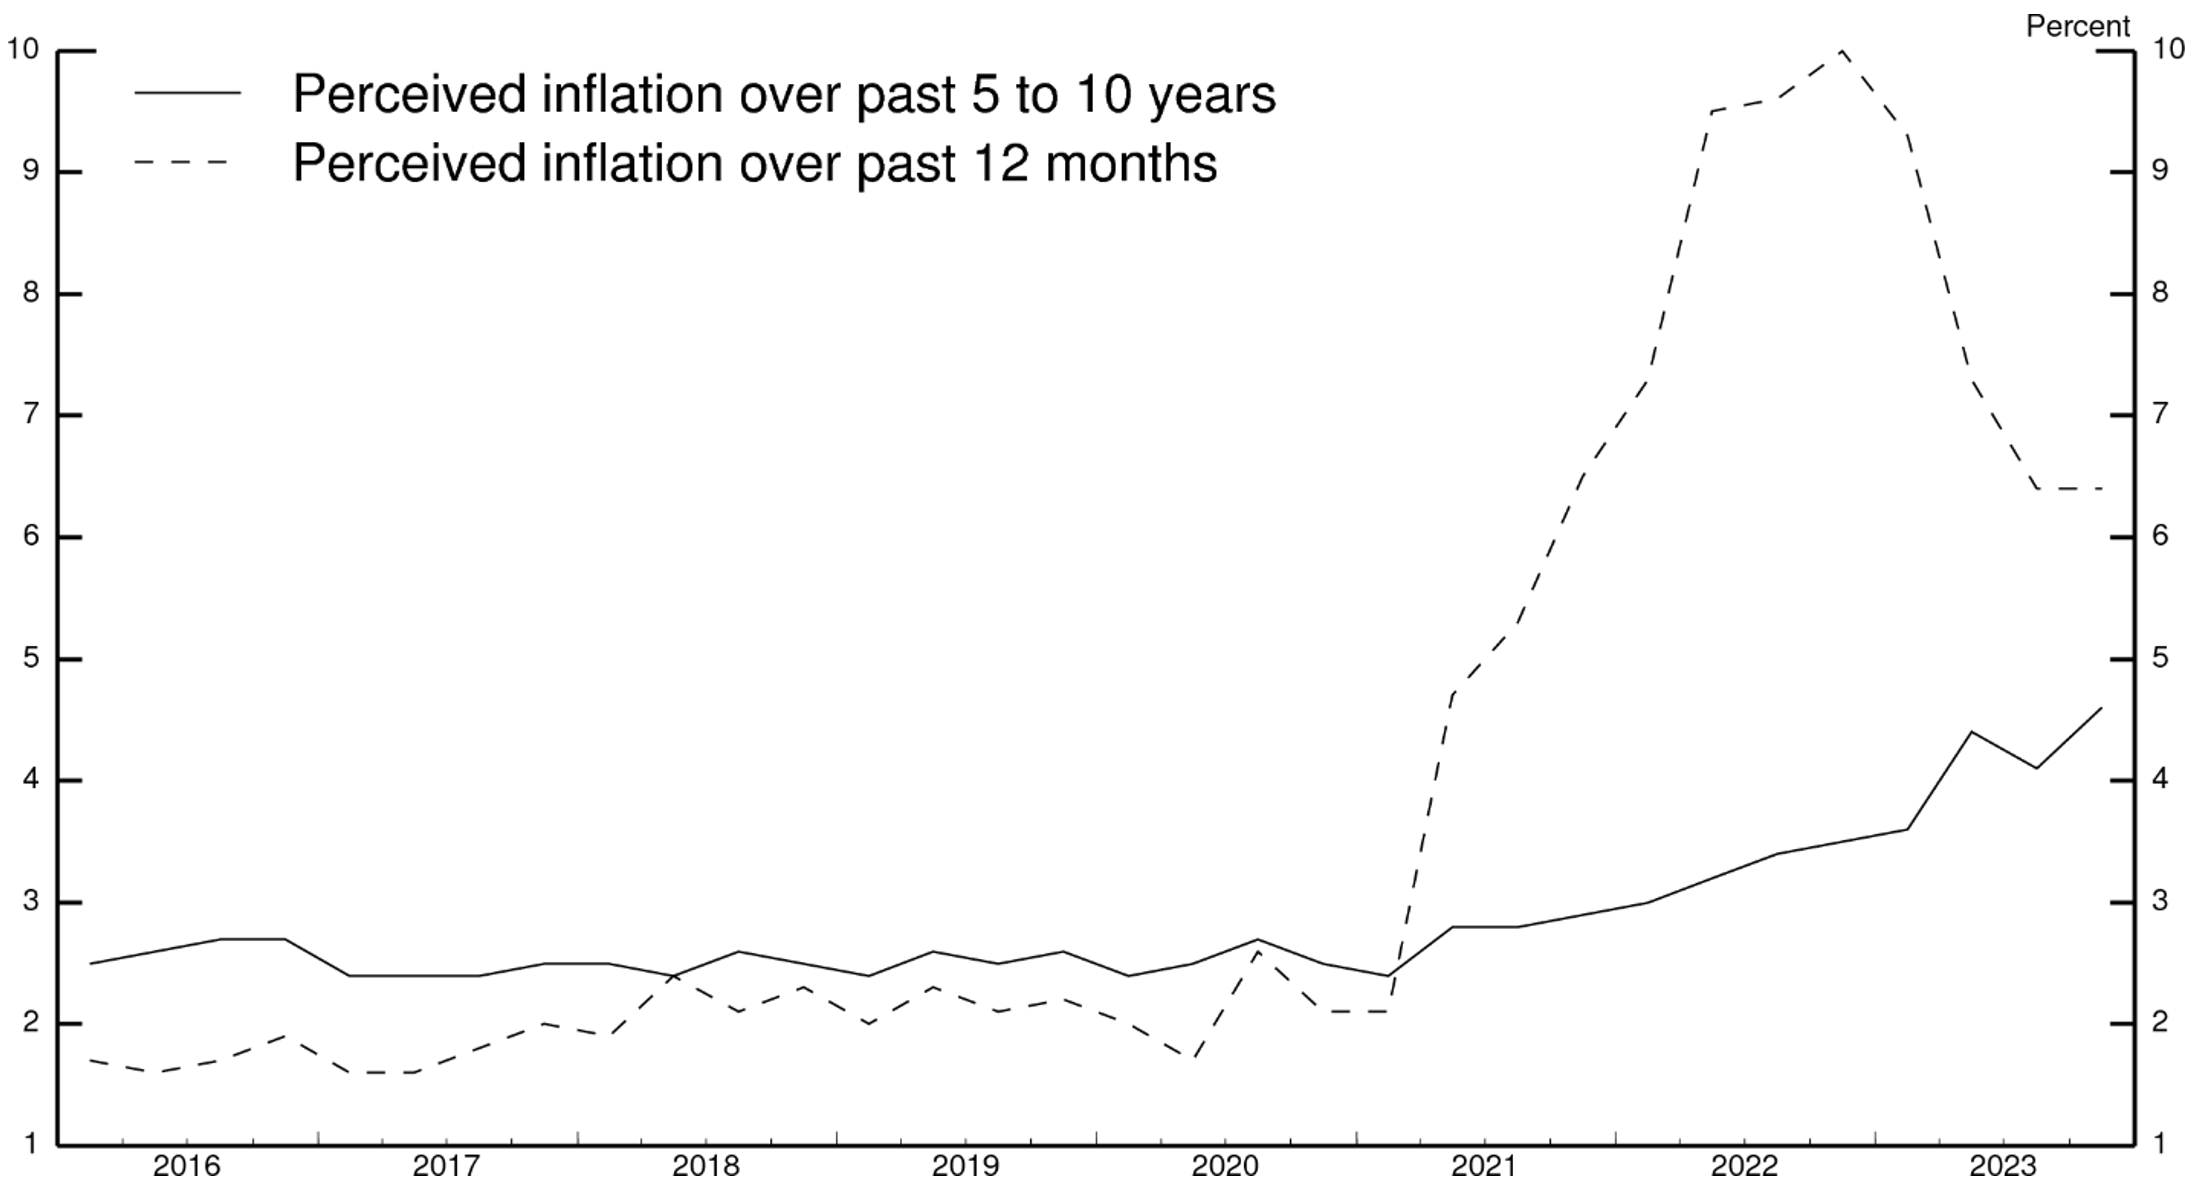
Source: University of Michigan Surveys of Consumers.
II. Inflation perceptions across demographic groups
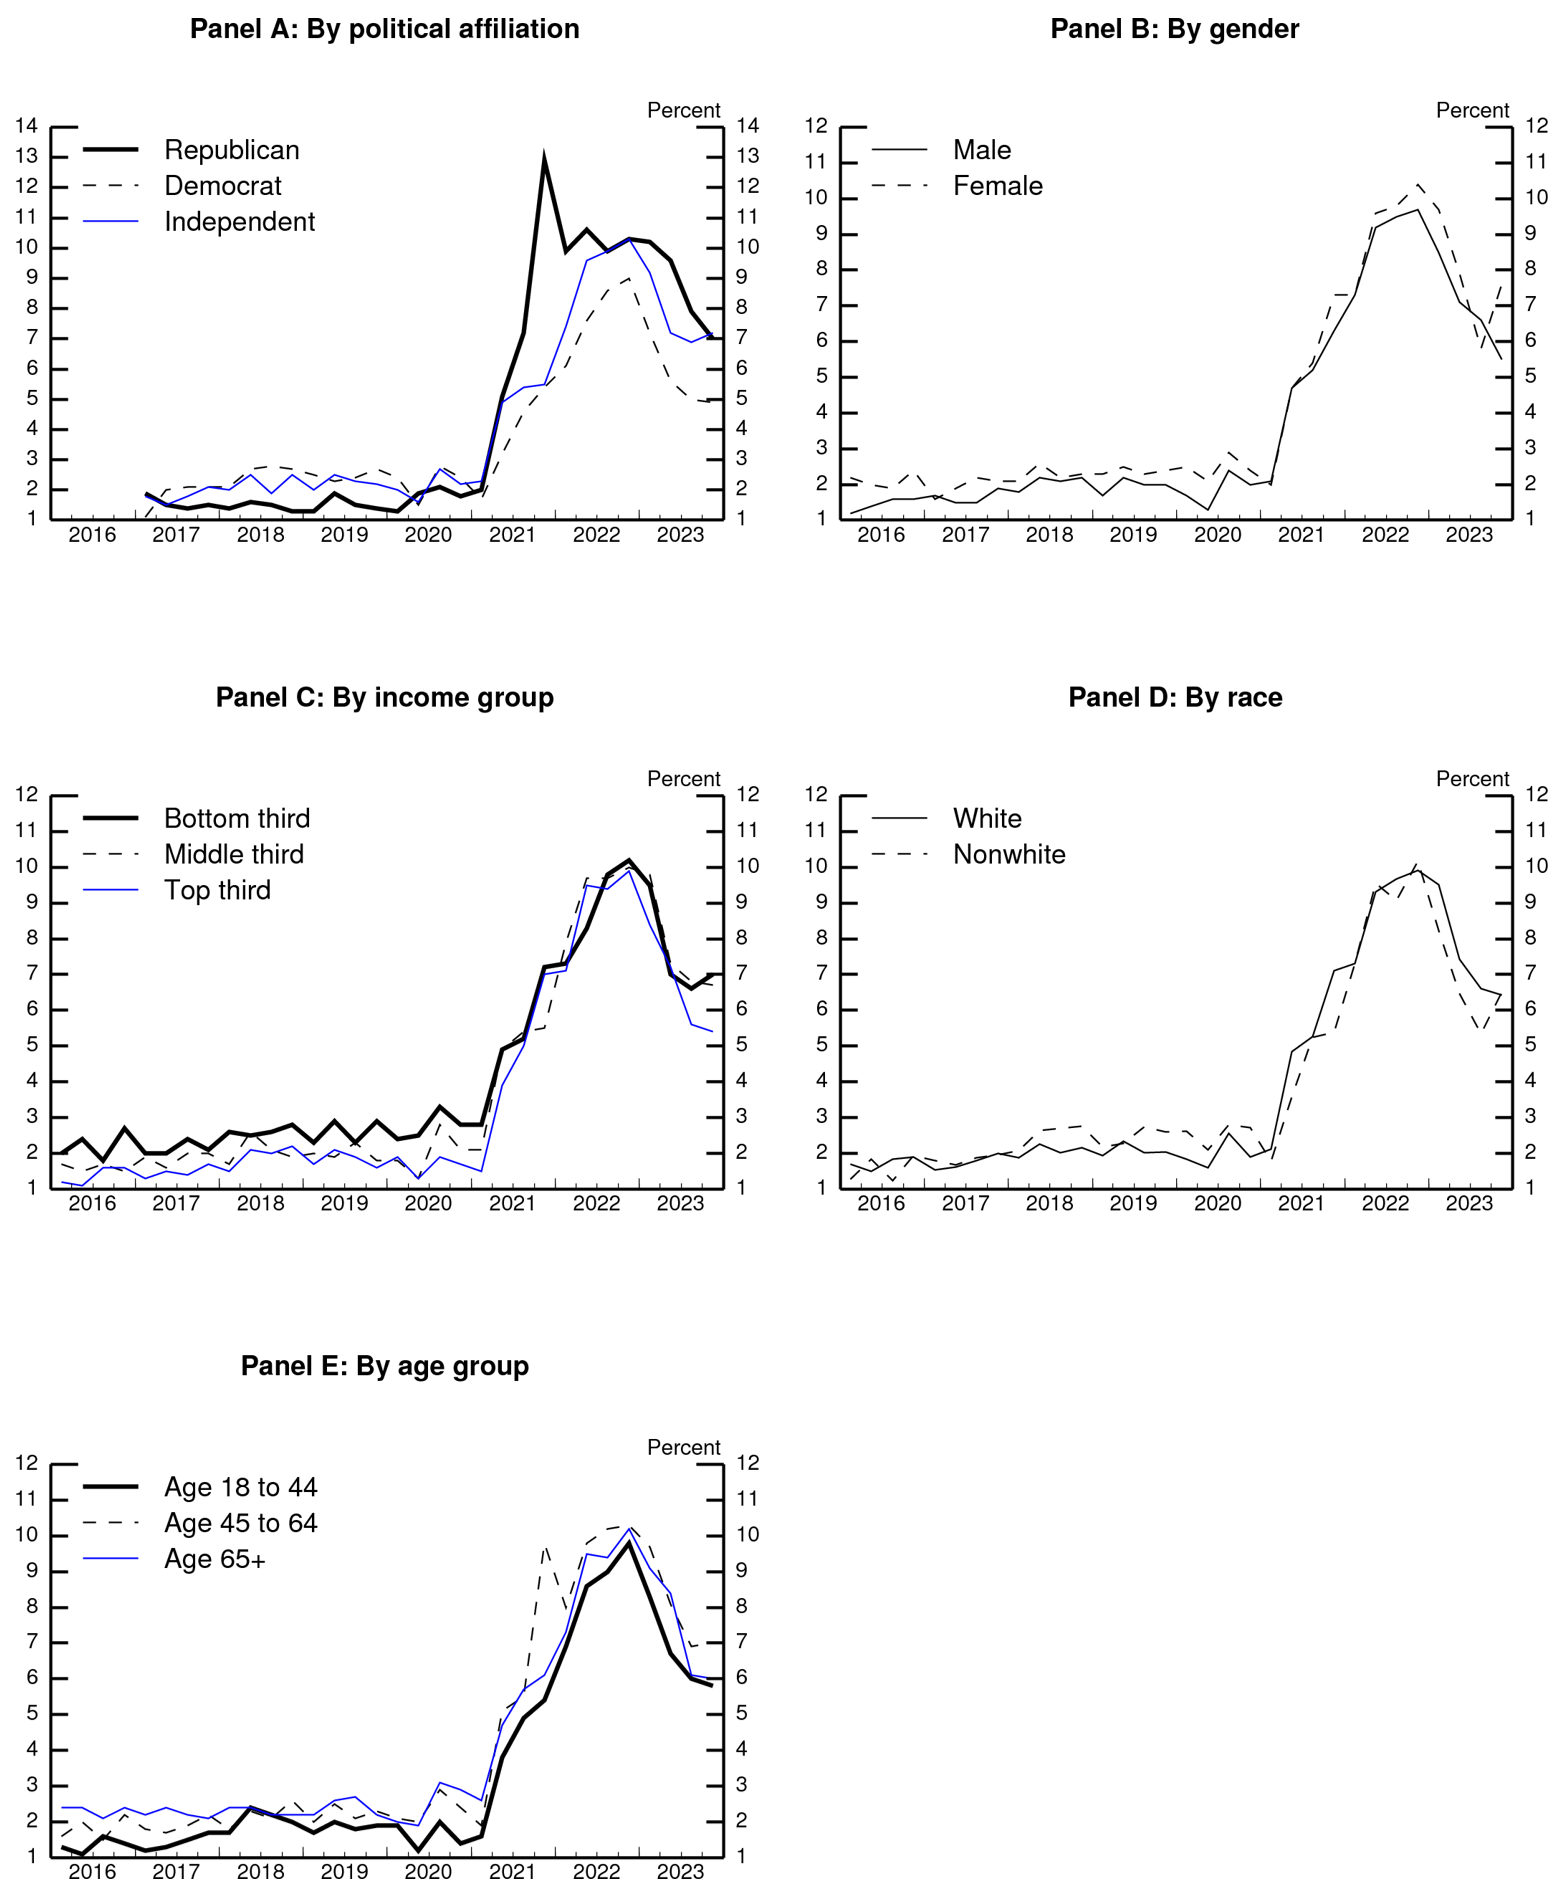
Figure 5 shows median 12-month inflation perceptions separately for various demographic subgroups. By far the largest differences in perceptions have been across people with different self-described political affiliations. From 2017-20, when the President was a Republican, Republicans perceived inflation to be lower than Democrats did. But since inflation rose in 2021, when the President was a Democrat, Democrats perceived inflation to be notably lower than Republicans did, with Independents in the middle (but closer to Republicans most recently). This finding appears consistent with recent results of wide partisan differences in consumer expectations depending on the party of the President (Curtin, 2022).
For other demographic splits, the differences in inflation perceptions appear more modest. Until recently, inflation perceptions rose and declined about equally for different income groups; in the latest readings, however, perceptions have come down somewhat more for households in the top third of the income distribution than for other households. (Before the pandemic, perceptions of high-income households were also lower than for other households.) Differences by gender, race, and age all appear small.
Source: University of Michigan Surveys of Consumers. Authors' calculations.
III. Relationship between inflation / inflation perceptions and consumer sentiment
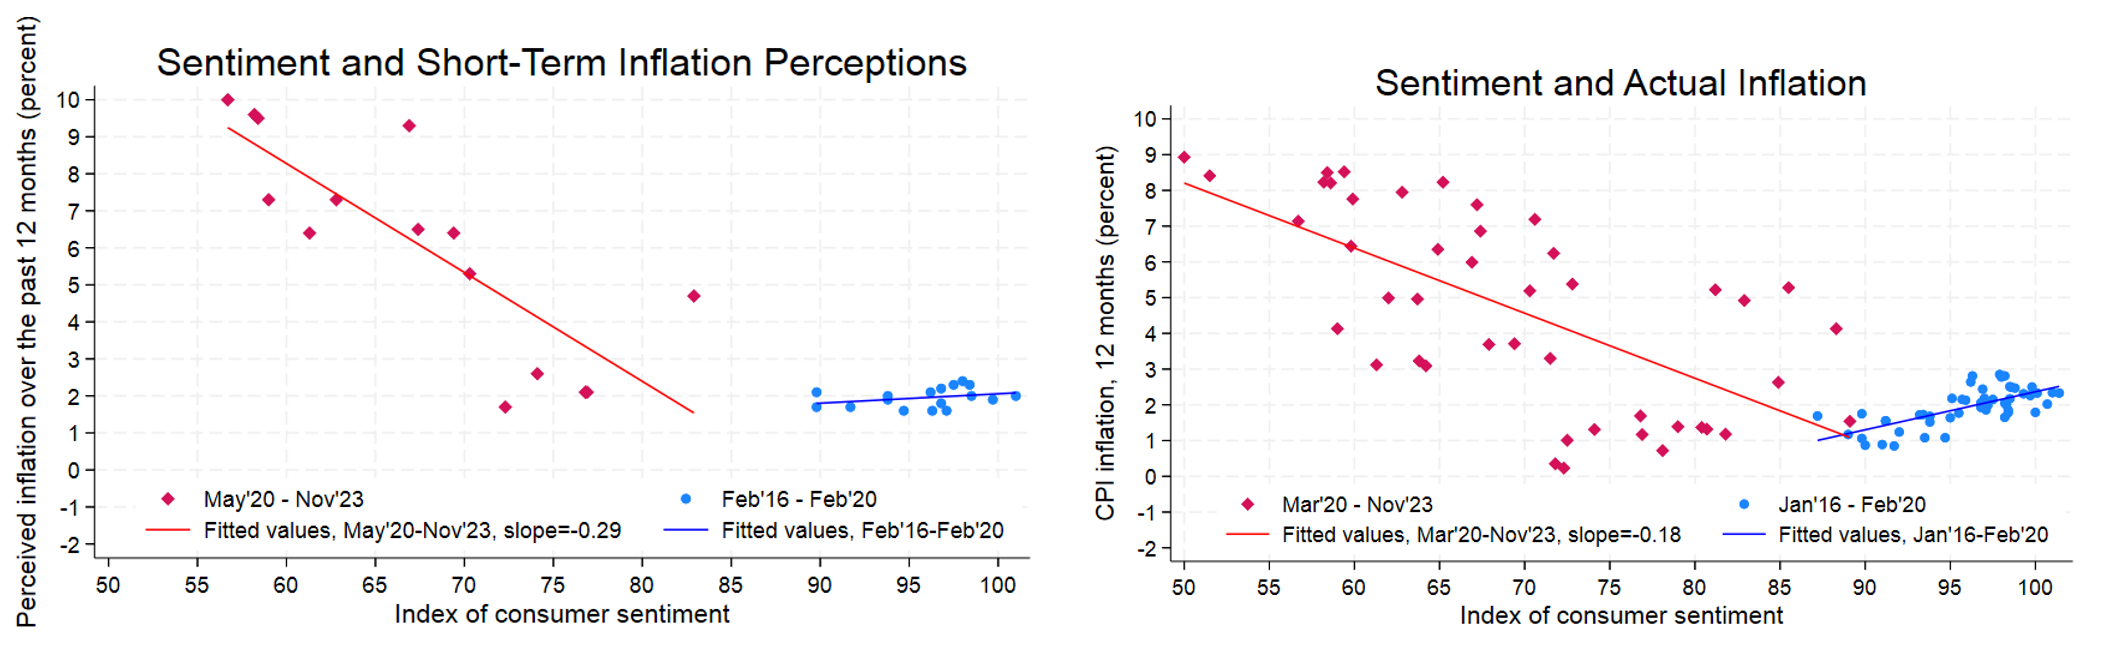
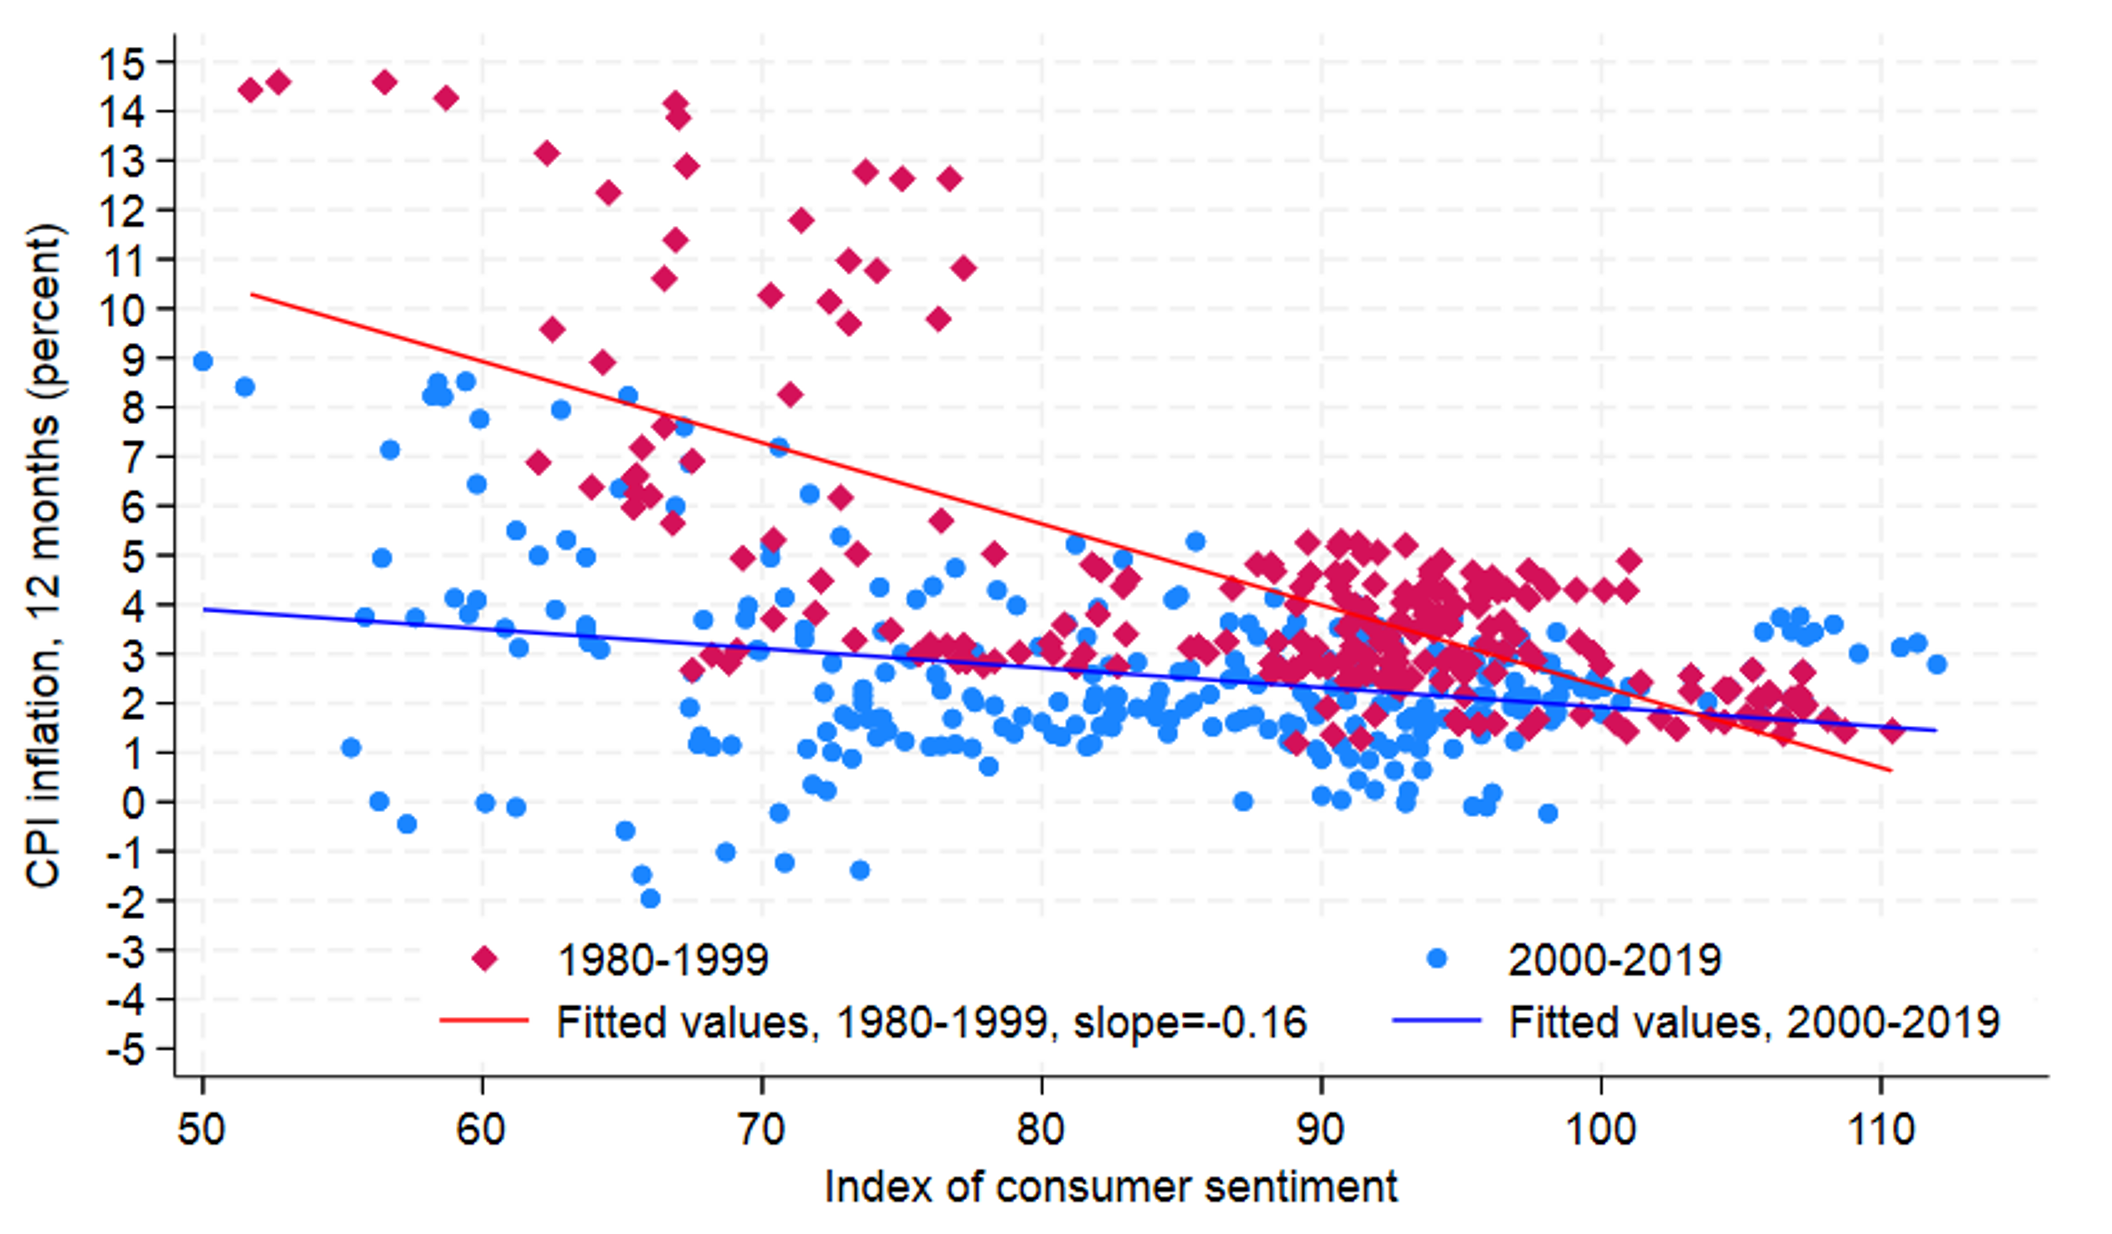
Consumer sentiment in the MSC has remained persistently lower than pre-covid levels despite strong growth and a tight labor market, prompting researchers to look for explanations (e.g. Herbstman and Brave, 2023, Sahm, 2023). In this section we illustrate the simple contemporaneous correlation between inflation perceptions or actual inflation and consumer sentiment (without attempting to control for other influences on sentiment or the autocorrelation in sentiment). Likely reflecting the relative stability of inflation over the few years prior to the pandemic, there was not strong relationship between inflation perceptions and sentiment (the blue line in the left panel in Figure 6). However, during the recent high inflation period, a strong negative relationship between inflation perceptions and consumer sentiment emerged (red line in the left panel in Figure 6). The right panel in Figure 6 does the same exercise but with actual CPI inflation and gives a similar picture. The strong contemporaneous relationship between inflation/inflation perceptions and sentiment since early 2020 is similar to the relationship observed during the two decades between 1980 and 2000 (red line in Figure 7). This simple relationship suggests that sentiment is likely to improve as perceptions of inflation decline. However, if perceptions are lagging actual inflation on the way down, it might take longer for sentiment to recover.
Source: University of Michigan Surveys of Consumers, Bureau of Labor Statistics.
Source: University of Michigan Surveys of Consumers, Bureau of Labor Statistics.
IV. Conclusion
In sum, we find that inflation perceptions rose remarkably closely with actual inflation in 2021 and early 2022. In 2023, however, while inflation perceptions have moved down, they have declined noticeably less than actual inflation. These broad patterns also hold across different demographic groups, though inflation perceptions differ significantly across respondents' political affiliations. Importantly, inflation expectations, particularly longer-term expectations, did not increase as much as inflation perceptions over the pandemic, indicating that households have viewed pandemic inflation as mostly transitory. Even so, given the relationship between perceptions and expectations, inflation perceptions persistently above actual inflation could hold up inflation expectations and affect future actual inflation.
Appendix
Note: Key identifies in order from left to right, bottom to top.
Source: University of Michigan Surveys of Consumers.
Note: Key identifies in order from left to right, bottom to top.
Source: University of Michigan Surveys of Consumers.
References
Armantier, Olivier, Giorgio Topa, Wilbert van der Klaauw, and Basit Zafar, "How Do People Revise Their Inflation Expectations?," (2016). Federal Reserve Bank of New York Liberty Street Economics (blog), http://libertystreeteconomics.newyorkfed.org/2016/08/how-do-people-revise-their-inflation-expectations.html.
Arioli, Rodolfo, Colm Bates, Heinz Dieden, Ioana Duca, Roberta Friz, Christian Gayer, Geoff Kenny, Aidan Meyler, and Iskra Pavlova (2017). "EU consumers' quantitative inflation perceptions and expectations: an evaluation," ECB Occasional Paper Series, No 186, April.
Axelrod, Sandor, David Lebow, and Ekaterina Peneva (2018). "Perceptions and Expectations of Inflation by U.S. Households," Finance and Economics Discussion Series 2018-073. Washington: Board of Governors of the Federal Reserve System, https://doi.org/10.17016/FEDS.2018.073.
Binder, Carola (2018). "Inflation Expectations and the price at the pump," Journal of Macroeconomics 58, 1-18. https://doi.org/10.1016/j.jmacro.2018.08.006
Bruine de Bruin, Wilbert van der Klaauw, and Georgio Topa (2011). "Expectations of Inflation: The Biasing Effect of Thoughts about Specific Prices," Journal of Economic Psychology, Elsevier, vol. 32(4): 834-845.
Bruine de Bruin, Wilbert van der Klaauw, J.S. Downs, B. Fischhoff, Georgio Topa, and Olivier Armantier (2012). "The Effect of Question Wording on Consumers' Reported Inflation Expectations," Journal of Economic Psychology, Elsevier, vol. 33(4): 749-757.
Curtin, R. (2022). "The Partisan Economy," Report, University of Michigan Surveys of Consumers.
D'Acunto, Francesco, Ulrike Malmendier, Juan Ospina, Michael Weber (2021). "Exposure to Grocery Prices and Inflation Expectations," Journal of Political Economy 129(5), 1615-1639. https://doi.org/10.1086/713192
Goidel, Robert and Ronald Langley (1995). "Media Coverage of the Economy and Aggregate Economic Evaluations: Uncovering Evidence of Indirect Media Effects," Political Research Quarterly, 48, pp. 313-328.
Herbstman, Jacob and Scott A. Brave (2023). "Persistently Pessimistic: Consumer and Small Business Sentiment after the Covid Recession," Chicago Fed Letter, No 490, November.
Jungermann, Helmut, Hans Wolfgang Brachinger, Julia Belting, Katarzina Grinberg, Elisabeth Zacharias (2007). "The Euro changeover and the factors influencing perceived inflation, "Journal of Consumer Policy, pp. 405-419
Montag, Hugh, and Daniel Villar (2023). "Price-Setting During the Covid Era," FEDS Notes. Washington: Board of Governors of the Federal Reserve System, August 29, 2023, https://doi.org/10.17016/2380-7172.3298.
Michael Weber, Bernardo Candia, Tiziano Ropele, Rodrigo Lluberas, Serafin Frache, Brent Meyer, Saten Kumar, Yuriy Gorodnichenko, Dimitris Georgarakos, Olivier Coibion, and Geoff Kenny (2023). "Tell Me Something I Don't Already Know: Learning in Low- and High-Inflation Settings," Working Paper 2023-8. Federal Reserve Bank of Atlanta. https://doi.org/10.29338/wp2023-08
Sahm, Claudia (2023). "Why are American consumers still so gloomy? Blame Covid," Opinion, Bloomberg, September 15, https://www.bloomberg.com/opinion/articles/2023-09-15/why-are-american-consumers-still-so-gloomy-blame-covid#xj4y7vzkg.
1. This conclusion was based on two sets of findings. First, the distributions of responses to the questions on both perceived inflation and expected inflation had similar central tendencies. (This similarity was more clear for perceptions and expectations at the 5-to-10 year horizon than at the 12-month horizon.) Second, inflation perceptions and expectations (at both the 12-month and 5-to-10 year horizons) are correlated at the individual level, and people who revise their answer about perceptions between surveys also tend to revise their expectations in the same direction. Return to text
2. This was somewhat in contrast with results for longer-term inflation perceptions as well as for inflation expectations at both horizons, which were all above actual inflation (whether measured by the CPI or the PCE price index), see Axelrod, Lebow, and Peneva (2018). Other surveys of inflation perceptions tend to find that even short-term perceptions exceeded published inflation prior to the pandemic, see for example Arioli et al. (2017) and Weber et al. (2023). Return to text
3. While the median captured accurately the increase in actual inflation, as shown figure A1 in Appendix A, the dispersion of responses was high and the standard deviation of the perception responses (not shown) doubled compared to the years prior to the pandemic. Return to text
4. Similarly, Weber et al. (2023) show that early in 2023 consumers' inflation perceptions in both the U.S. and the Euro Area exceeded noticeably actual inflation. In addition, in the Federal Reserve Bank of Cleveland Survey of Firms' Inflation Expectations (https://clefed.org/SoFIE), businesses' inflation perceptions in the U.S. were well above actual CPI inflation in August of this year (the last available data point). Return to text
5. Another recent finding is that salient prices, for example those of more frequently purchased items, like gasoline and groceries, play an outsized role in the formation of inflation perceptions and expectations (see, among others, Vlasenko and Cunningham (2015), Armantier et al. (2016), Binder (2018), D'Acunto et al. (2021)). However, given that the food and energy price inflation measures have fallen even more than headline inflation since mid-2022 (with gasoline prices declining outright), this finding does not seem like a good candidate explanation for divergence between actual inflation and perceptions over 2023. Return to text
6. The fact that median short-term inflation perceptions were unchanged between August and November 2023 stands in stark contrast to the data for 12-month inflation expectations; those expectations, which had declined over most of 2023, jumped back up in October and November 2023 before reversing that jump in the December survey. The increases in October and November seem puzzling in light of the ongoing declines in inflation during this period, and the magnitude of both the jump and decline were unusually large for this series. The stability in median 12-month inflation perceptions over this period may provide further evidence that the temporary jump in expectations was anomalous. Moreover, that jump was not evident in other measures of inflation expectations, such as the SCE from the Federal Reserve Bank of New York. Return to text
7. We note that it likely has been quite challenging for respondents to answer a question about perceived average inflation over the past 5 to 10 years, given that inflation was so much higher from 2021-23 than in the years before. Return to text
Lebow, David, and Ekaterina Peneva (2024). "Inflation Perceptions During the Covid Pandemic and Recovery," FEDS Notes. Washington: Board of Governors of the Federal Reserve System, January 19. 2024, https://doi.org/10.17016/2380-7172.3439.
Disclaimer: FEDS Notes are articles in which Board staff offer their own views and present analysis on a range of topics in economics and finance. These articles are shorter and less technically oriented than FEDS Working Papers and IFDP papers.