FEDS Notes
August 02, 2024
Private Credit Growth and Monetary Policy Transmission
Ahmet Degerli and Phillip Monin1
Introduction
In this note, we examine the recent growth of private credit markets and its effects on monetary policy transmission. We find that private credit has grown by competing with or substituting other forms of credit and by lending to a set of borrowers that have difficulty obtaining credit otherwise. The growth of private credit was likely driven by regulatory and supervisory actions, an expansion of private equity in the economy, and attractiveness of private credit to borrowers and investors. We also find that monetary policy transmission through private credit markets appears muted relative to financing through public credit markets or bank C&I lending, as the supply of credit remains ample during policy tightening driven by attractive returns and a large stock of investment dry powder.
Private Credit Market Growth
Private credit refers to direct lending to businesses by nonbank institutions. Although private credit accounts for a relatively small share of the total outstanding debt of private companies, at around 15 percent, it has experienced substantial growth since the GFC and has become an increasingly important source of credit for businesses, with aggregate outstanding volumes comparable to leveraged loans and high-yield corporate bonds.
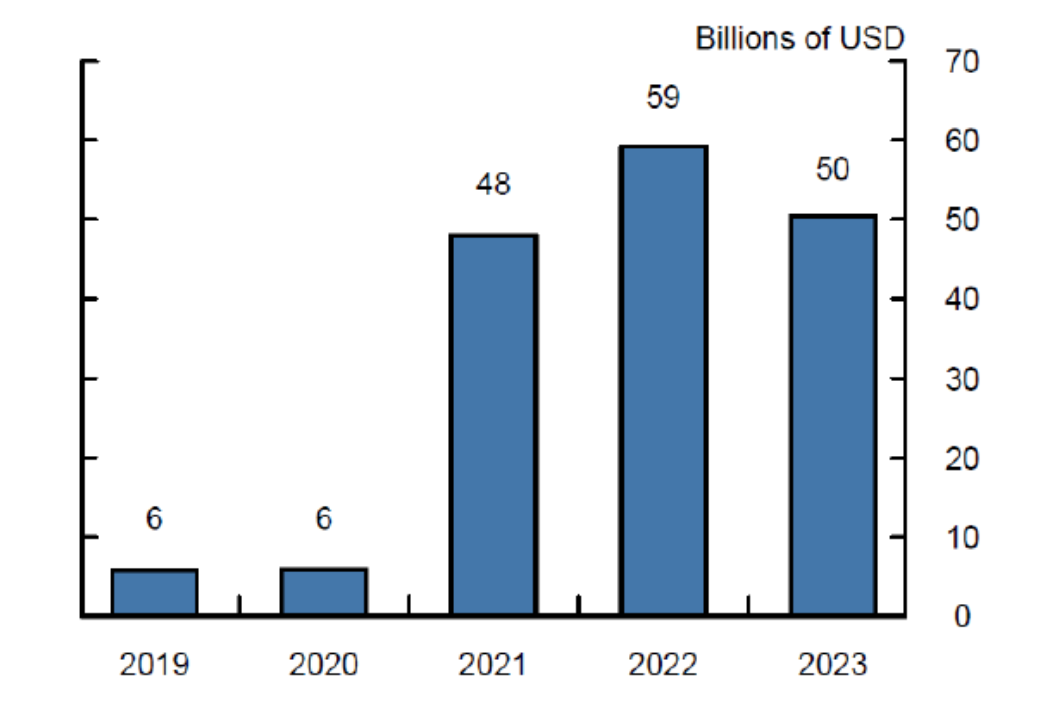
Private credit has grown by competing with or substituting other forms of credit and by lending to a set of borrowers that have difficulty obtaining credit otherwise. Private credit has traditionally served middle market companies, with a typical loan size of about $65 million.2 However, over the last few years, direct lenders have underwritten more jumbo loans of $1 billion or more (Figure 1). Historically, these jumbo loans had been underwritten in public credit markets, but the increased size of private credit lenders, supported by strong institutional and retail investor inflows, has allowed them to finance larger deals.
In addition to increasingly competing with public credit markets due to its increased size, private credit is also substituting for public credit for other reasons. Uncertainty in the leveraged loan market has been elevated over the past few years due to higher macro uncertainty amid monetary policy tightening and geopolitical risks. Also, a couple of large hung deals made banks less willing to underwrite new loans in the leveraged loan market. As leveraged lending pulled back, private credit lenders, supported by their investor base with long-term investment horizons, increasingly provided financing to companies that traditionally borrowed in the leveraged loan market (Figure 2, left panel). As a result, direct lending assets under management (AUM) grew as the leveraged loan and high yield bond markets stagnated or declined (Figure 2, right panel).
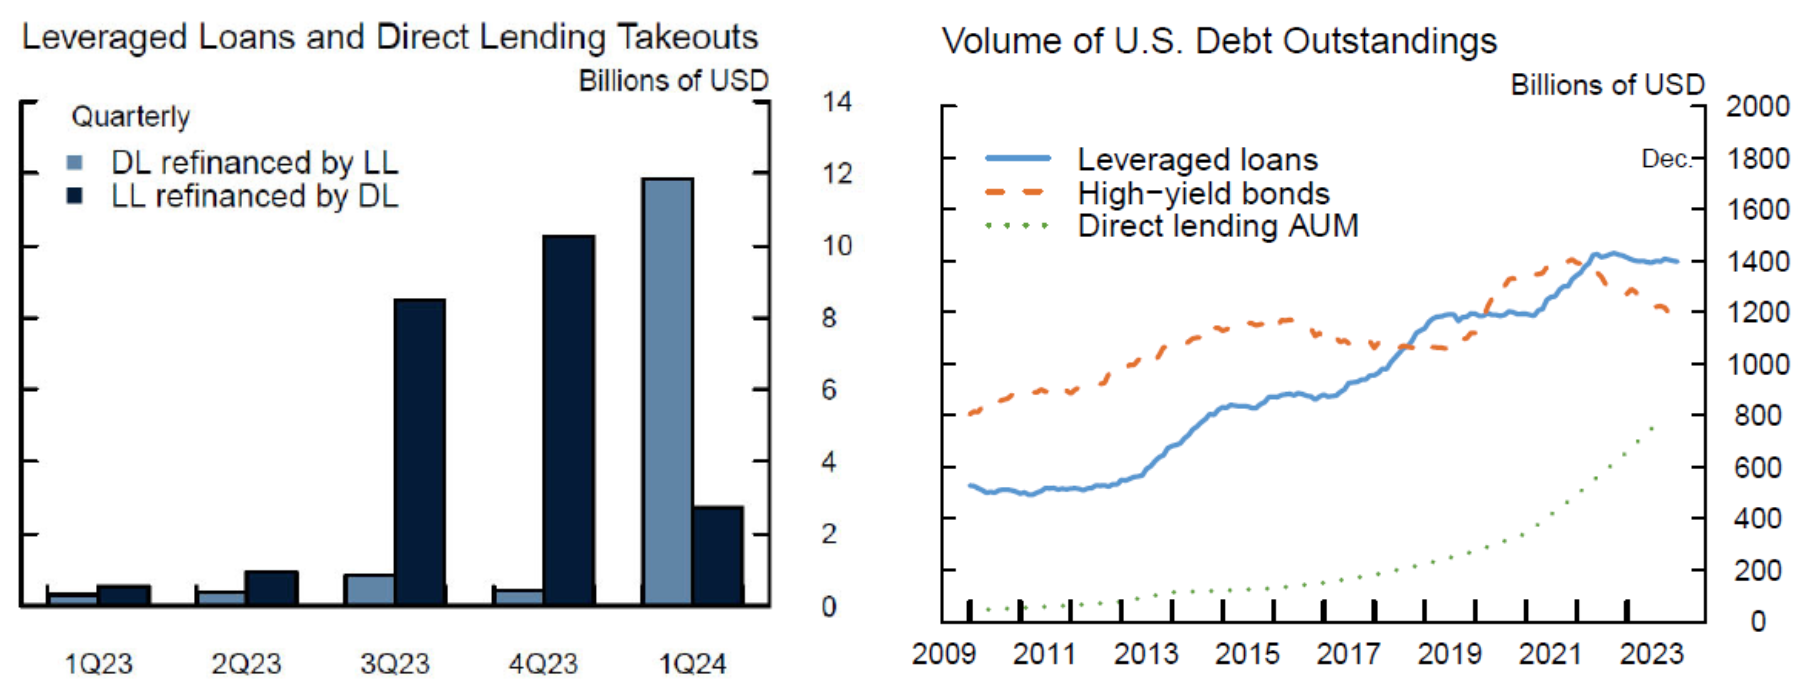
Note: Direct Lending assets under management (AUM) includes direct lending funds AUM and BDC AUM. For direct lending AUM, the data is as of June 2023.
Source: Pitchbook LCD, Mergent's FISD, Thomson Reuters LPC, Preqin, S&P Capital IQ.
Private credit lenders have also extended credit to companies that have difficulty in accessing credit from alternative sources, especially from banks. Following the GFC, the regulatory framework in the U.S. and supervisory guidance such as the 2013 Interagency Guidance on Leveraged Lending made bank lending to certain types of businesses more capital-intensive and subject to scrutiny by supervisors. This likely contributed to the post-GFC decrease in the market share of corporate loans held by banks, especially in the riskiest segment of corporate lending. Chernenko et al. (2022) document that companies with negative EBITDA or debt/EBITDA ratios above six are more likely to borrow from nonbanks post-GFC. Consistent with this, private credit markets have increasingly financed the companies in the technology industry, which includes companies with high recurring revenue growth yet low profitability and high leverage.
Aside from constraints at banks, other structural factors have likely been contributing to the growth of the private credit market, including private equity. Private equity increasingly finances a larger share of the economy and because private equity requires debt financing to finance buyouts or acquisitions, the increasing presence of private equity in the economy has increased the demand for financing. The left panel of Figure 3 indicates that invested capital for buyouts by direct lending funds has grown alongside private equity invested capital. This is also consistent with the finding of Block et al. (2023) that private credit funds heavily rely on private equity sponsors in sourcing new deals. Furthermore, as the private equity strategy involves investing in a company and holding it for a long time (sometimes exceeding 10 years), it benefits from having a relationship lender that would continuously provide financing to the company through the investment lifespan. Figure 3, right panel, shows that buyout financing is increasingly provided by direct lenders.
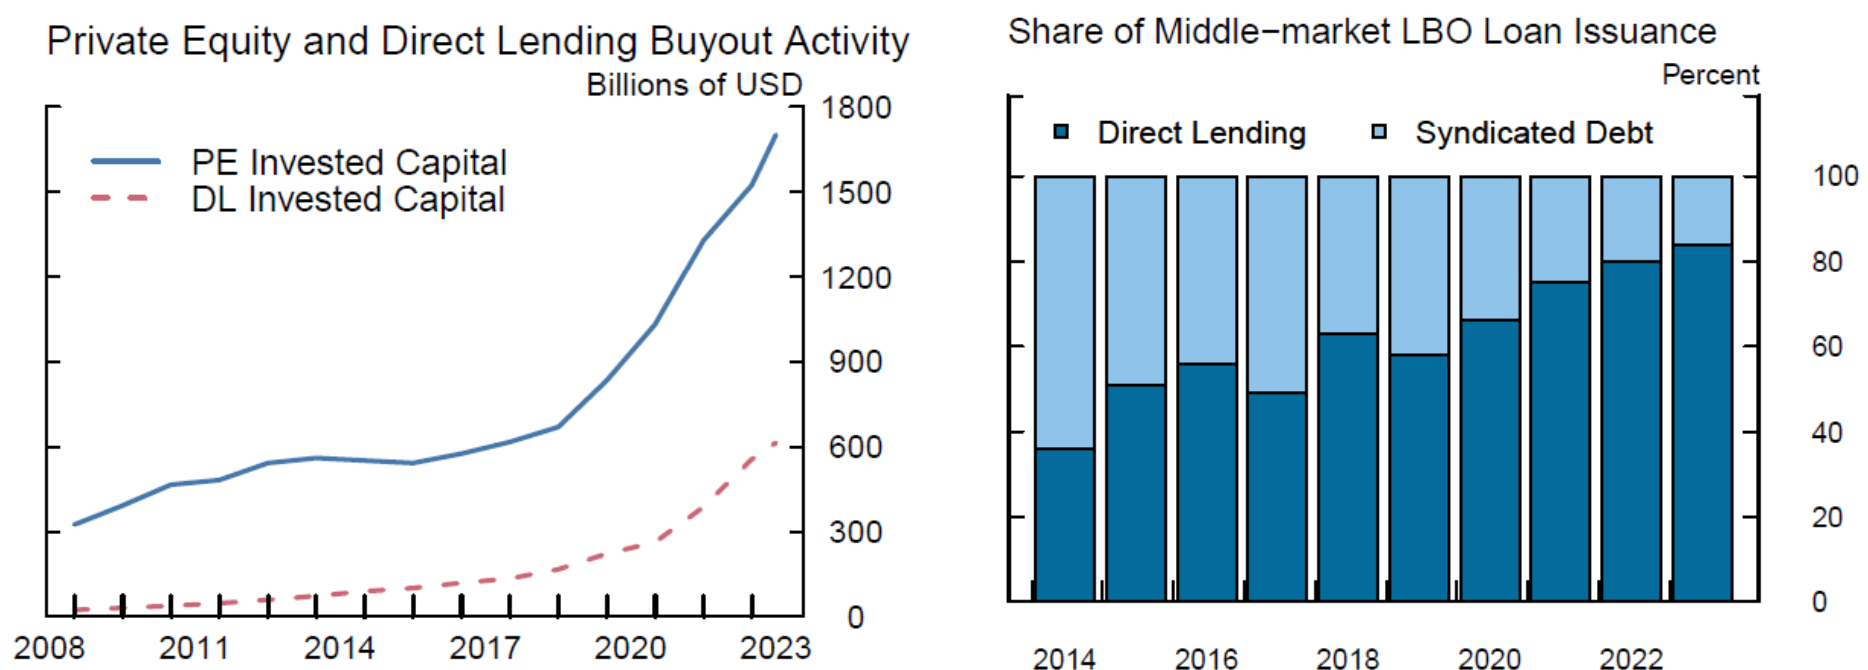
Note: Invested capital figures are as of June 2023. Only the capital invested by funds with a focus on buyout strategy in North America is included. Direct lending figure includes invested capital by direct lending funds and BDC assets under management. Middle market is defined as total loans under $500 million and issuer revenues less than $500 million.
Source: Preqin, Bain Annual PE Report, S&P Capital IQ.
The growth of private credit is also driven by its relative attractiveness to borrowers and investors. Borrowers and their private equity sponsors might prefer private credit market over public credit markets due to easier and faster origination processes as private credit deals do not require syndication or ratings, hence no sharing of company financials with a large group of potential lenders. Also, as there is no syndication of a private credit loan following its origination, the pricing of the loan does not allow for market flex terms, which lead to uncertainty regarding the final pricing of loans issued in the leverage loan market. Although private credit loan contracts tend to be more covenant-heavy than their public counterparts, higher creditor control brings the benefit of being able to provide more customized loan terms. For instance, private credit loan contracts might include payment-in-kind (PIK) clauses which enable a borrower to defer its interest payments and add them into the principal if the borrower faces challenges during the loan lifespan. Delayed-draw term loan features also provide much needed financial flexibility to borrowers, as most of these borrowers are private equity buyouts and need financing along the way for future growth opportunities, such as new acquisitions. Furthermore, having a post-origination renegotiation when a company faces challenges is much easier under a private credit loan contract as it involves only a single lender or a few.
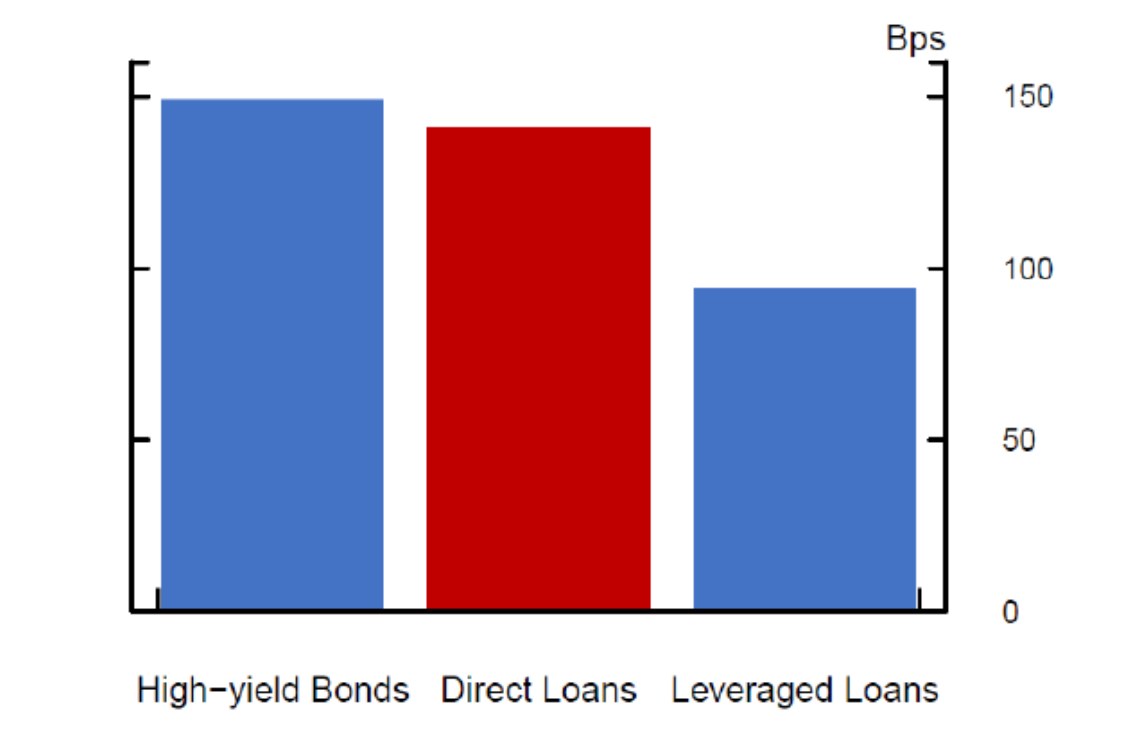
High returns also make private credit attractive for investors. The Figure 4 shows that annual total returns—unlevered gross-of-fees—on direct lending loans have been higher compared to returns on leveraged loans. Higher returns potentially reflect several elements, including compensation for the illiquidity and the opacity of the market, higher management fees, and borrowers' risk characteristics. Indeed, Erel et al. (2024) find that an average private debt fund produces insignificant abnormal returns for their investors after considering management fees and underlying loan portfolio risks. However, with the ability to get exposure to the broader set of companies in the economy, private credit markets expand the investment opportunity set for investors.
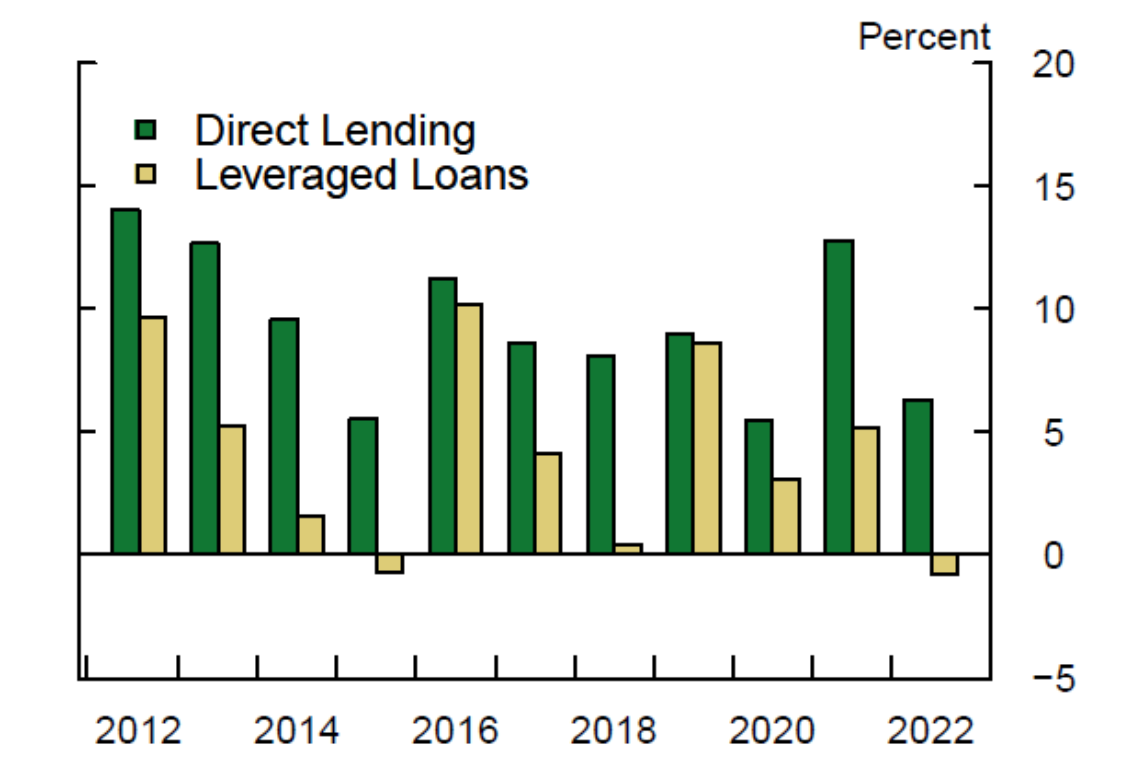
Source: Bloomberg, Pitchbook LCD.
Private credit investors have also been attracted to the asset class by its credit performance. Although private credit borrowers have lower credit quality on average than high-yield bond issuers, credit losses have been in line with other comparable credit markets to date (Figure 5). Private equity sponsors' equity interest in the companies (with potential further equity injections if needed), their active participation in the company operations and governance, and strong creditor control rights provided by covenant-heavy loan terms help private credit market borrowers to workout stress situations and avoid payment defaults or bankruptcies. However, one caveat is that private credit market, at its current scale, has not experienced a prolonged period of stress situation so far. While the GFC was a significant stress episode, the size of the private credit market was small then. Private credit markets remained resilient during the pandemic but the stress episode associated with the pandemic was a relatively short period with unprecedented fiscal and monetary support.
Note: Loss given default reported for high-yield and leveraged loans; realized losses from BDC balance sheets reported for direct loans.
Source: J.P. Morgan, Bloomberg.
Monetary Policy Transmission in Private Credit Markets
Monetary policy affects the real economy partly through the availability of credit. We find that monetary policy transmission through private credit may be muted relative to bank C&I lending and public bond markets due to resilient credit supply. We discuss three points in support of this conclusion. First, direct lending has performed well in both easing and tightening monetary policy environments. Second, private credit fundraising appears strong when policy is tightening, suggesting that the availability of credit remains solid. Finally, high levels of dry powder – capital commitments mainly from institutional investors with long time horizons – provide a buffer against shocks. Despite resilient credit supply, however, capital calls of private credit funds slow during tightening cycles, likely reflecting slowing demand for credit.
Direct lending has performed well in both easing and tightening monetary policy environments:
Figure 6 shows that direct lending's return performance compares favorably to leveraged loans and high-yield bonds in both easing and tightening monetary policy environments. Our proxy for the performance of direct lending is the quarterly changes in Cliffwater Direct Lending Index, which measures the unlevered gross-of-fees performance of U.S. middle market loans using data from public BDC filings.3 Using data spanning nearly 19 years and including the financial crisis of 2008, the figure shows that the average quarterly performance of direct lending in tightening periods is similar to its average performance in periods of easing, at over 2.2 percent, outperforming leveraged loans and the aggregate bond index. Direct lending also outperforms high yield bonds in tightening cycles and its performance is similar to high yield bonds during periods of easing. A caveat to these statistics is that direct lending loans are not traded in secondary markets like high yield bonds or leveraged loans, and instead the realization of returns is controlled by fund managers. Nevertheless, this comparison suggests one reason why long-term investors find private credit attractive even during monetary policy tightening cycles.
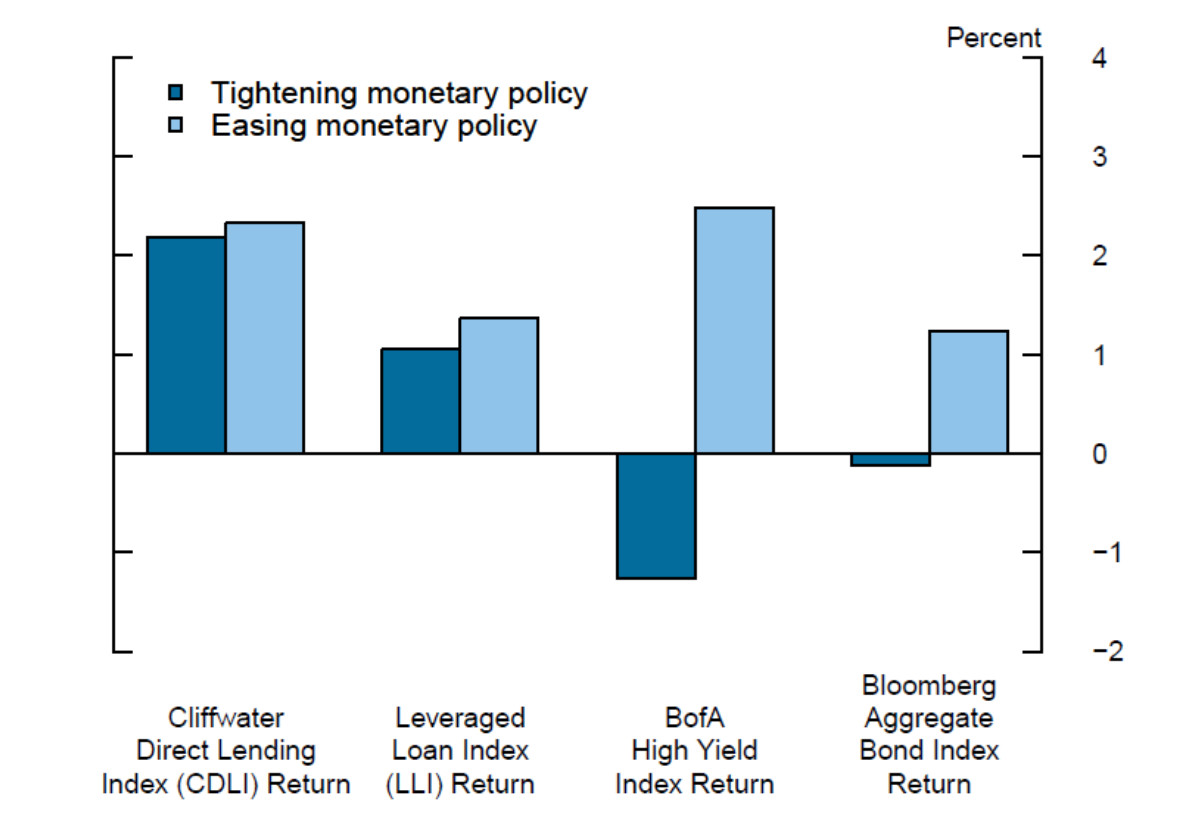
Note: The chart reports mean quarterly returns for each index during periods of tightening and easing monetary policy. The sample period is 2004Q4-2023Q2.
Source: Bloomberg, ICE Fixed Income Indices, Pitchbook LCD.
We next examine the response of direct lending returns to monetary policy shocks. In Table 1, we find that monetary policy shocks are positively and significantly associated with returns to direct lending (after controlling for risk appetite), suggesting an interest rate channel of monetary policy transmission in which unexpected policy rate increases are associated with higher returns to direct lending. In unreported results, we find that the response to monetary policy surprises is similar for leveraged loan returns, but that high yield bonds returns are not significantly related to monetary policy surprises during our sample period and the response of the Bloomberg Aggregate Bond Index is significantly negative. These results on the various types of credit are consistent with loans having lower interest rate risk relative to bonds. Direct lending loans and leveraged loans are usually floating rate, with interest rates based on SOFR and typically reset every 1 to 3 months, so that policy rate changes are rapidly reflected in interest rates on loans.
Table 1. Direct Lending Returns and Monetary Policy Shocks
| (1) | (2) | (3) | (4) | (5) | (6) | |
|---|---|---|---|---|---|---|
| (Intercept) | 2.462*** | 2.550*** | 2.351*** | 2.413*** | 3.952*** | 3.823*** |
| (13.069) | (14.334) | (14.027) | (14.558) | (7.046) | (6.785) | |
| JK shock | 18.294*** | 6.544* | 12.855** | |||
| (2.779) | (1.917) | (2.225) | ||||
| Kuttner shock | 14.228*** | 6.745*** | 11.052*** | |||
| (3.053) | (3.099) | (2.722) | ||||
| Δ VIX | -0.190*** | -0.173*** | ||||
| (-6.793) | (-6.278) | |||||
| VIX | -0.080** | -0.069** | ||||
| (-2.343) | (-2.031) | |||||
| Obs. | 76 | 76 | 76 | 76 | 76 | 76 |
| R2 | 0.262 | 0.362 | 0.6 | 0.634 | 0.37 | 0.442 |
| R2 Adj. | 0.252 | 0.353 | 0.589 | 0.624 | 0.353 | 0.426 |
Note: This table presents results of quarterly regressions of the returns to the Cliffwater Direct Lending Index (CDLI) on monetary policy shocks developed in Jarociński and Karadi (2020) (JK shock) and Kuttner (2001). The mean VIX over the quarter proxies for risk appetite. Newey-West (lag=2) standard errors are used. t-statistics are shown below the corresponding coefficient estimates. The significance of the coefficient estimate is indicated by * for p < 0.10, ** for p < 0.05, and *** for p < 0.01.
Source: Bloomberg, Brennan et al. (2024).
Higher rates also result in higher interest costs for companies borrowing from direct lenders, which can make it more difficult for some companies to pay their interest payments, potentially resulting in credit losses. However, in the current tightening cycle the higher interest income from higher policy rates has dominated credit losses. Finally, a natural question is what happens in periods of easing when rates are decreasing. Here, the high spreads above base rates that are featured in direct loans insulate returns, acting as an effective floor. Moreover, high spreads relative to base rate changes lead to overall less volatility relative to expected returns, which is attractive to investors.
Private credit fundraising appears strong when policy is tightening:
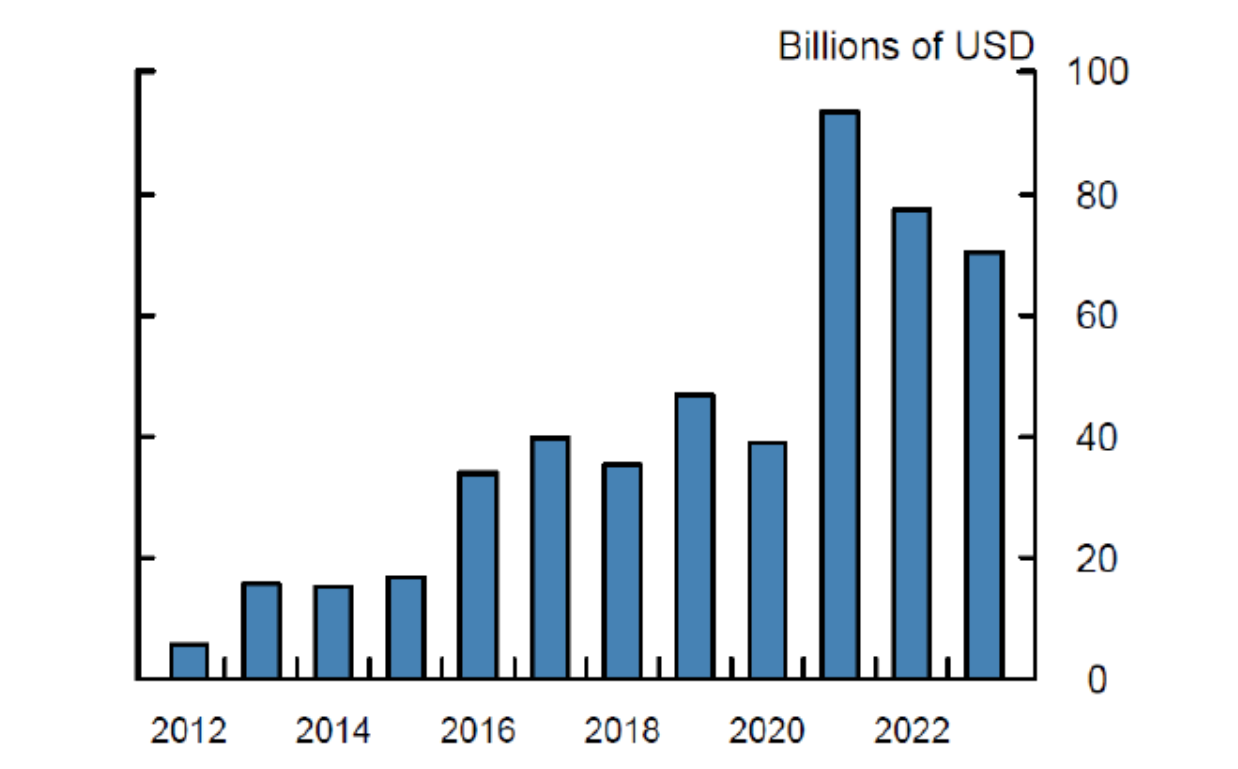
Some of the largest investors in private credit, such as pension funds, have explicit returns targets and are attracted to high all-in returns offered by private credit. Indeed, private credit fundraising appears resilient to the stance of monetary policy. Figure 7 shows that direct lending fundraising increased in the period of monetary policy tightening of 2016-2018 and, after hitting a maximum in 2021, has remained high during the current tightening period that began in 2022.
In addition, granular analysis of private credit funds using Form PF data further supports the resilience of private credit fund fundraising to the stance of monetary policy. In Table 2, we find that private credit funds fundraise at the same rate or more quickly when policy is tightening relative to when it is not, suggesting robust demand from investors. A caveat to this analysis is that it is based on 11 years of data covering a tightening cycle and the beginning of another one, and that over this period the asset class experienced rapid growth for structural reasons. Nevertheless, there is no evidence that private credit fundraising slows as monetary policy tightens.
Table 2. Private Credit Funds Fundraising and Monetary Policy Stance
| (1) | (2) | (3) | (4) | (5) | (6) | |
|---|---|---|---|---|---|---|
| (Intercept) | 38.895*** | 38.895*** | ||||
| (30.904) | (30.901) | |||||
| MP Tighten | 6.207*** | 6.459*** | 12.046*** | -3.732 | -2.464 | 6.093 |
| (2.77) | (2.95) | (3.9) | (-1.641) | (-1.098) | (1.423) | |
| Obs. | 1,876 | 1,876 | 1,876 | 1,656 | 1,656 | 1,656 |
| R2 | 0.004 | 0.032 | 0.579 | 0.001 | 0.033 | 0.582 |
| R2 Adj. | 0.004 | 0.025 | 0.076 | 0.001 | 0.026 | 0.075 |
| Age FE | X | X | X | X | ||
| Strategy FE | X | X | ||||
| Fund FE | X | X |
Note: This table presents results of panel regressions of the annual percentage change in dry powder on an indicator for monetary policy tightening period (2016-2018, 2022) during the fundraising stage of private credit funds. The data are annual from 2012 to 2022, inclusive. The fundraising stage is proxied at the fund level to be up to and including the year in which the fund reaches its maximum level of dry powder. Columns (4) – (6) omit the year 2022 from the analysis. Age, strategy, and fund fixed effects are included where indicated. Standard errors are clustered by fund. t-statistics are shown below the corresponding coefficient estimates. The significance of the coefficient estimate is indicated by * for p < 0.10, ** for p < 0.05, and *** for p < 0.01.
Source: SEC Form PF, staff calculations.
These results on the resilience of private credit fund fundraising are consistent with the findings of Aramonte and Avalos (2021) and are similar to results found for leveraged loans. For example, in unreported results we find that CLO issuance, the main funding source for leveraged loans, increases in periods of monetary policy tightening. This confirms results in Kwak (2022), who finds that CLO issuance increases, and loan mutual funds receive inflows in months with tightening monetary policy shocks (see also Cetorelli et al. (2023)).
Changes in the composition of strategies of private credit funds during tightening cycles also support the conclusion that investor flows remain resilient. As shown in Figure 8, funds incepted during tightening cycles are more likely to originate loans through direct lending or mezzanine financing and are less likely to focus on distressed credit.
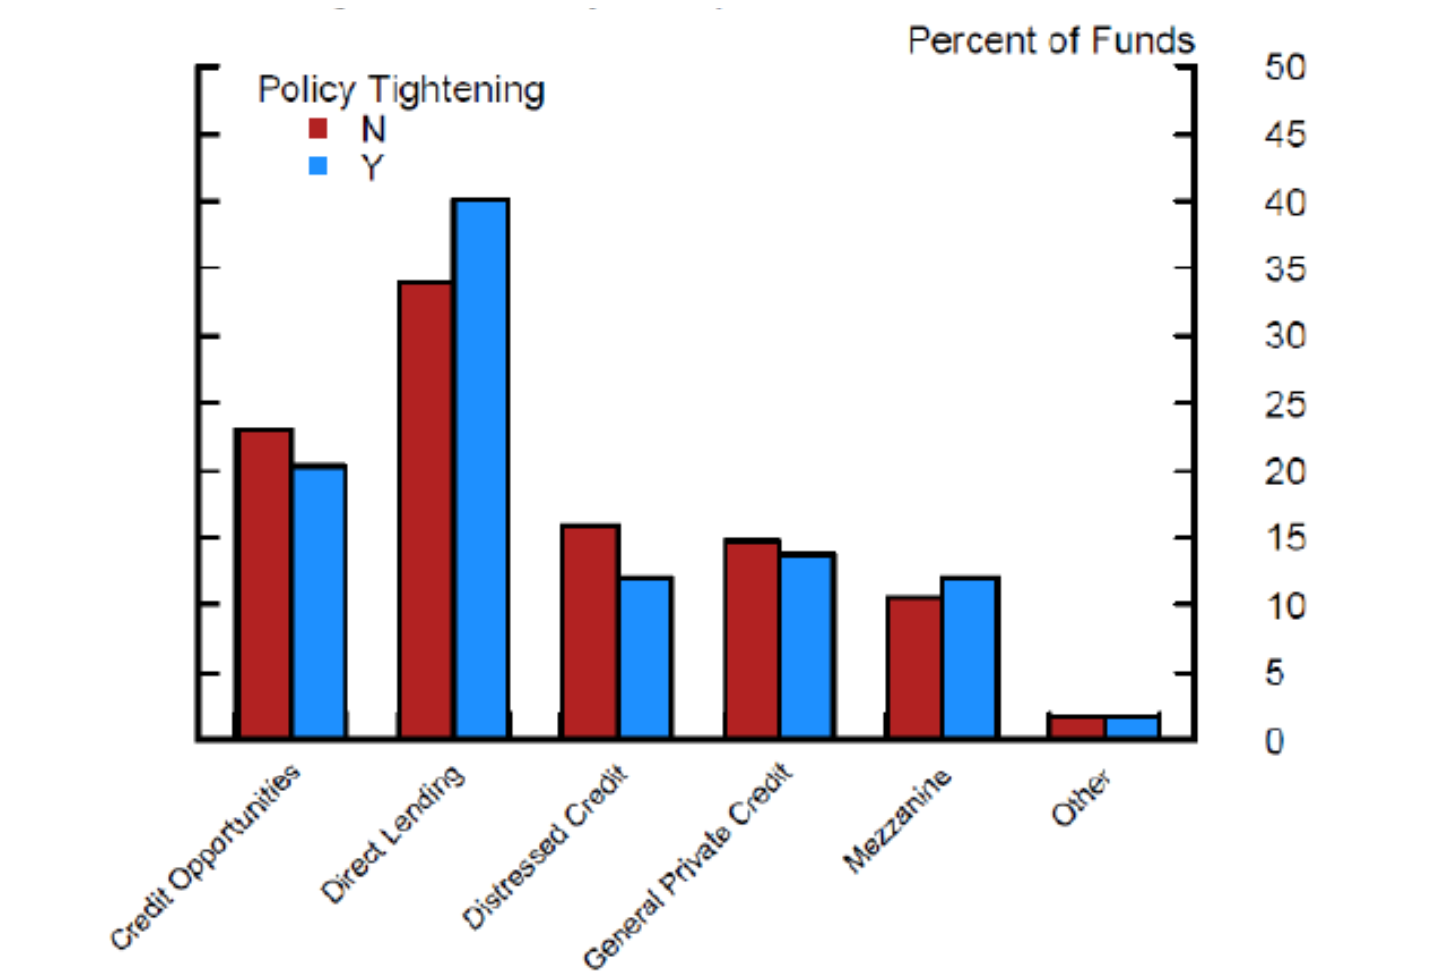
Note: Key identifies in order from left to right.
Source: SEC Form PF, staff calculations.
Dry powder provides a buffer against shocks:
Finally, uncalled capital commitments, also called dry powder, represent capital from long-term investors that can be called and deployed with relatively short notice. Figure 9 shows the estimated dry powder in private credit funds by investor type, using data from Form PF. Dry powder from pension funds, sovereign wealth funds, and insurance companies increased in years leading to 2022. Overall, dry powder in private credit funds has about tripled over the past decade.
These high levels of dry powder from investors with long-term investment horizons and without the ability to withdraw their capital suggest high credit availability in private credit funds, and contrasts with the relatively greater runnability of uninsured bank depositors and loan mutual fund investors. Furthermore, partly because of the locked-in nature of the funding, private credit fund managers can deploy capital over several years, typically three or four on average (according to industry sources), enabling them to be relatively patient and ride out short-term fluctuations.
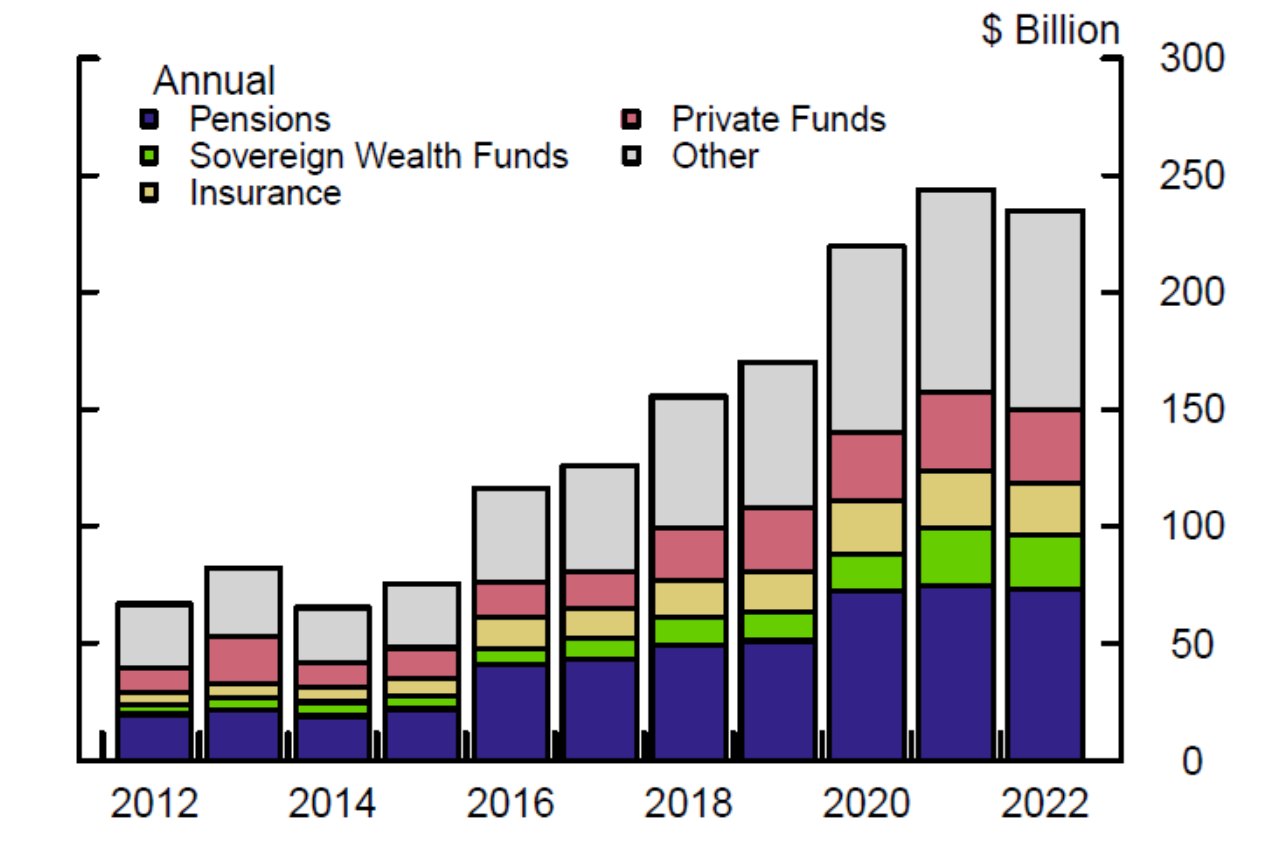
Note: Other includes individuals, endowments, funds of funds, the manager's stake, and other types of investors. Key identifies in order from bottom to top.
Source: SEC Form PF, staff calculations.
Nevertheless, analysis in Table 3 using Form PF data of private credit funds in the capital deployment stage of their lifecycle shows that capital calls (i.e., decreases in dry powder during capital deployment stage) on average slow somewhat in tightening cycles. This result suggests slower demand for financing from borrowers when policy is tightening.
Table 3. Private Credit Funds Capital Deployment and Monetary Policy Stance
| (1) | (2) | (3) | |
|---|---|---|---|
| (Intercept) | -28.494*** | ||
| (-40.093) | |||
| MP Tighten | 7.145*** | 6.187*** | 7.429*** |
| (5.624) | (5.564) | (6.472) | |
| Obs. | 4,331 | 4,331 | 4,331 |
| R2 | 0.008 | 0.167 | 0.455 |
| R2 Adj. | 0.007 | 0.164 | 0.179 |
| Age FE | X | X | |
| Strategy FE | X | ||
| Fund FE | X |
Note: This table presents results of panel regressions of the annual percentage change in dry powder on an indicator for monetary policy tightening period (2016-2018, 2022) during the capital deployment stage of private credit funds. The data are annual from 2012 to 2022, inclusive. The capital deployment stage is proxied at the fund level to be after the year in which the fund reaches its maximum level of dry powder. Age, strategy, and fund fixed effects are included where indicated. Standard errors are clustered by fund. t-statistics are shown below the corresponding coefficient estimates. The significance of the coefficient estimate is indicated by * for p < 0.10, ** for p < 0.05, and *** for p < 0.01.
Source: SEC Form PF, staff calculations.
Conclusion
Overall, private credit growth is supported by both cyclical and structural factors and our analysis suggests that the effects of monetary policy transmission through private credit may be muted due to structural features of the asset class. Private credit fund returns and capital raising remain relatively resilient during policy tightening cycles, and dry powder further insulates capital deployment from credit availability shocks. However, additional analysis using net private credit financing flows over a longer time period would be required to fully understand the effect of private credit on monetary policy transmission.
References
Aramonte, Sirio, and Fernando Avalos (2021) The rise of private markets, BIS Quarterly Review.
Brennan, Connor M., Margaret M. Jacobson, Christian Matthes, and Todd B. Walker (2024). "Monetary Policy Shocks: Data or Methods?," Finance and Economics Discussion Series 2024-011. Washington: Board of Governors of the Federal Reserve System.
Cai, Fang, and Sharjil Haque (2024). "Private Credit: Characteristics and Risks," FEDS Notes. Washington: Board of Governors of the Federal Reserve System, February 23, 2024.
Cetorelli, Nicola, Gabriele La Spada, and João A. C. Santos (2023) Monetary Policy, Investor Flows, and Loan Fund Fragility, Federal Reserve Bank of New York Staff Reports, no. 1008. March 2022; revised October 2023.
Jarociński, Marek, and Peter Karadi (2020) Deconstructing Monetary Policy Surprises – The Role of Information Shocks, American Economic Journal: Macroeconomics 12:2, 1-43.
Kuttner, Kenneth N. (2001) Monetary policy surprises and interest rates: Evidence from the Fed funds futures market, Journal of Monetary Economics, 47:3, 523-544.
Kwak, Seung (2022) How does monetary policy affect prices of corporate loans? Finance and Economics Discussion Series 2022-008. Washington: Board of Governors of the Federal Reserve System.
1. We thank Dan Li and Lubomir Petrasek for their helpful comments and discussions. We thank Lia Chabot, Ben Iorio, and Eddy Wu for their excellent research assistance. The views expressed in this note are those of the authors and do not necessarily reflect the views of the Federal Reserve Board or the Federal Reserve System. Return to text
2. The average loan size for all private credit strategies from 2013-2023 (Cai and Haque, 2024). Return to text
3. The CDLI is constructed from private and public BDC filings. For more information, see https://www.cliffwaterdirectlendingindex.com/methodology Return to text
Degerli, Ahmet, and Phillip Monin (2024). "Private Credit Growth and Monetary Policy Transmission," FEDS Notes. Washington: Board of Governors of the Federal Reserve System, August 02, 2024, https://doi.org/10.17016/2380-7172.3565.
Disclaimer: FEDS Notes are articles in which Board staff offer their own views and present analysis on a range of topics in economics and finance. These articles are shorter and less technically oriented than FEDS Working Papers and IFDP papers.