FEDS Notes
September 26, 2024
Rising Auto Loan Delinquencies and High Monthly Payments
Robert Adams, Vitaly Bord, and Haja Sannoh1
Introduction
Delinquency rates on auto loans rose substantially to above pre-pandemic levels by the end of 2023, after falling to historical lows during the COVID-19 pandemic. Because auto loans are an important sector in consumer credit, accounting for about 25 percent of nonmortgage consumer credit, a deeper analysis of the increase in delinquencies can give insights into the financial health of borrowers in consumer credit markets and overall household financial well-being.
In this note, we investigate recent trends in auto loan delinquencies and show that the increase in delinquencies is mainly concentrated in auto loans originated since 2022. We highlight the role of higher monthly payments in driving delinquencies and argue that larger auto loan amount at origination, rather than the increases in interest rates, explain most of the increase in delinquencies. The increase in loan amount likely reflects the interactions of both credit supply and demand factors: borrowers demanded larger loans amid the run-up in car prices from mid-2020 to mid-2023 and lenders, in aggregate, appeared to relax their credit standards to originate these loans.
Previous literature has noted the role of larger loan size in driving default behavior, particularly among subprime borrowers (Adams et al., 2009; Kukla and Litwin, 2002; Haughwout et al., 2024).2 We add to this literature by focusing on the relationship between monthly payments and delinquencies and by disentangling the role of interest rates and large loan size on increasing payments. We also explore the separate contributions of credit supply—that is, lenders' credit standards—as well as credit demand—borrowers' demand for larger loans amid the surge in car prices—in driving increasing loan size.
Data
We use two main data sources on auto loans for our analysis. First, we use data on auto loans from a nationally representative, anonymous 5 percent random sample of consumers with an Equifax credit report (the New York Federal Reserve Consumer Credit Panel, hereafter CCP). These data track loans over time starting at origination and include information on payment amount and delinquency status. For our main analysis, our measure of delinquency is an indicator equal to 1 when an individual is more than 30 days past due on a payment.3 We merge the auto loan data with data from the borrower's credit report (also part of the CCP) to include information on their credit score, their other debts, and so on. The auto loan data are quarterly starting in 2017 and semiannual before that. Therefore, for our main analysis, we use a one percent random sample of all auto loans originated between 2017 and 2022. Second, we use auto loan origination data from Experian AutoCount. These data provide information on loan terms, including the term and interest rate of the loan, which CCP do not contain, at origination. The AutoCount data also include granular information on the type of lender providing the loan.
In addition to data on auto loans, we also use income data at the census tract level from the Census Bureau since neither of our auto loan data sets contain borrower income. To proxy for borrower income, we use the relative income of the census tract. In other words, we use the median tract income of where a borrower lives relative to median income of other surrounding tracts.4 The income levels are classified into four groups: low, moderate, medium, and high with low income being the omitted class. Low income is defined as census tracts where the median family income is 50 percent or below the area median income. Moderate income refers to census tracts where the median family income is between 51 to 80 percent of the area median income. Medium income consists of those between 81 to 120 percent of the area median income, and high income refers to those making over 120 percent of the area median income.
Recent Trends in Delinquencies
Figure 1 presents seasonally adjusted auto loan delinquency rates from the CCP, using the full credit report data to show a longer quarterly time series.5 Auto loan 30-day delinquency rates have risen considerably in recent years. Although they remain below the peak levels of the Great Recession, as of the end of 2023, auto loan delinquency rates exceeded pre-pandemic levels about 60 basis points. The rise in delinquency rates is particularly notable, as loan delinquencies fell during the pandemic, likely because of forbearance programs, stimulus payments, and a decrease in subprime originations.6
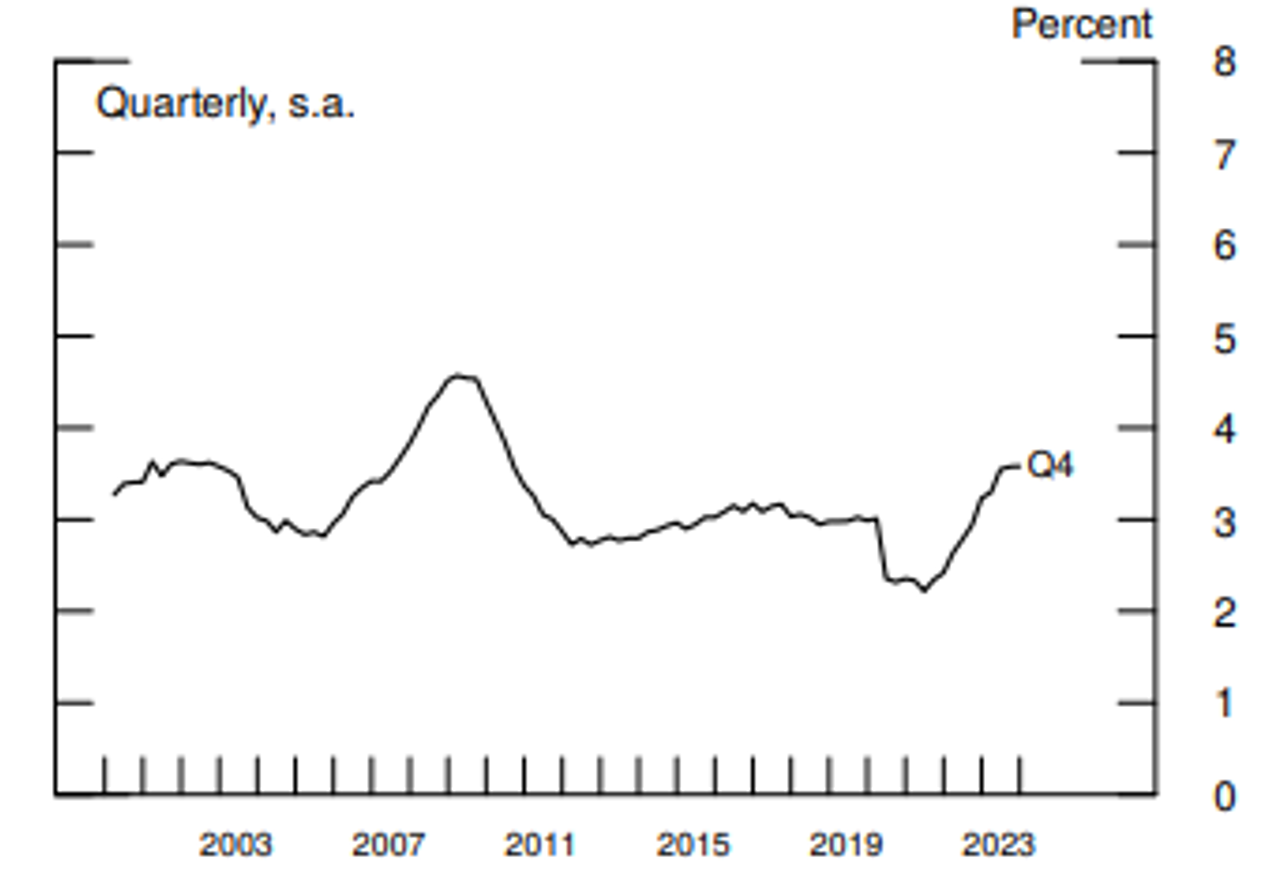
Note: Delinquency rate measures the fraction of balances that are at least 30 days past due, excluding severe derogatory loans. Data are seasonally adjusted.
Source: Federal Reserve Bank of New York Consumer Credit Panel/Equifax.
Almost all auto loan delinquencies stem from subprime and near-prime borrowers. As a result, the rise in delinquency rates among riskier borrowers has far outpaced the overall increase, with subprime and near-prime auto delinquency rates now at or exceeding levels observed during the Great Recession, though it is worth noting that the share of auto loan debt that is rated subprime is substantially less now than during the Great Recession.7
The recent increase in delinquencies is driven mainly by loans originated over the past two years. This is partly mechanical, as around 37 percent of auto loan balances comprise loans originated in the previous 12 months and 27 percent comprise loans originated in the previous 13 to 24 months. That said, as shown in figure 2, loans originated in 2022 and 2023 have appreciably steeper increases in delinquencies relative to those of other vintages.
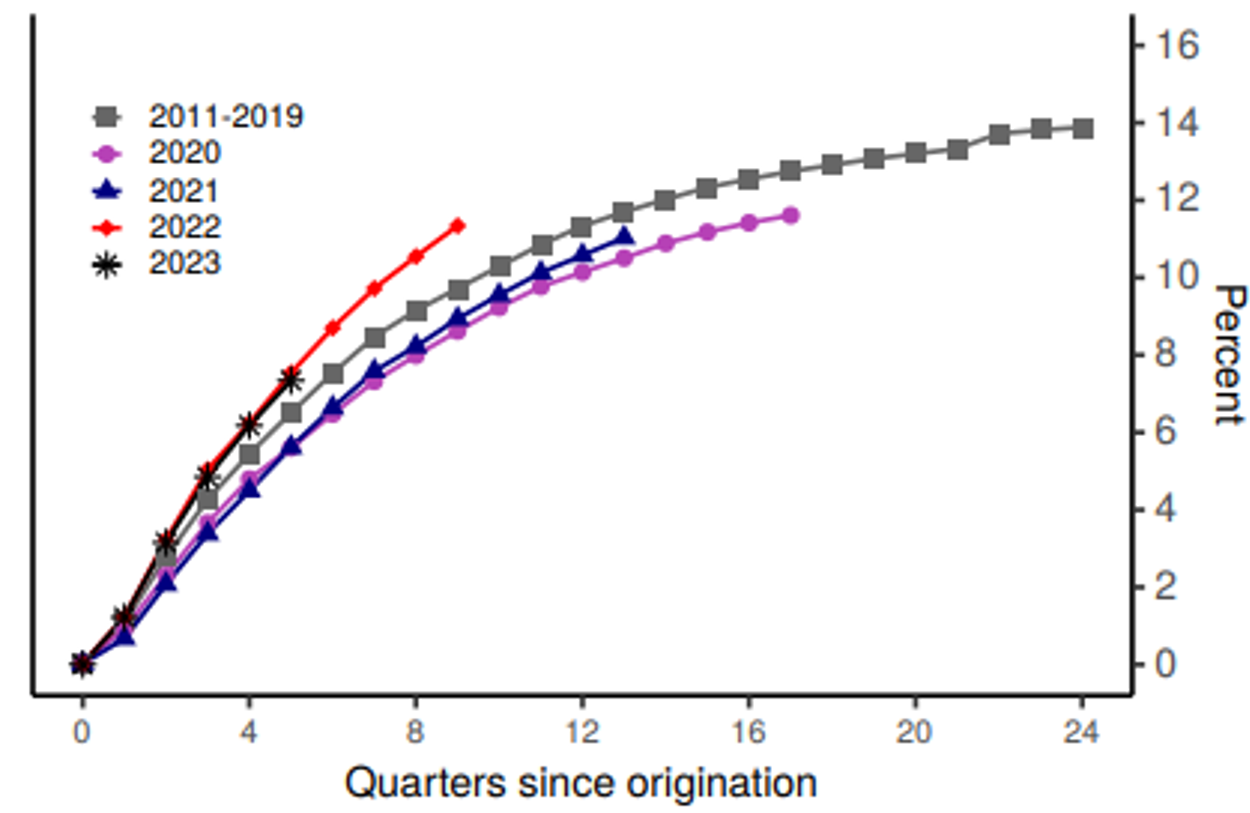
Note: For brevity, the figure only includes loans originated in Q1 of each year.
Source: Federal Reserve Bank of New York Consumer Credit Panel/Equifax.
Delinquencies and Monthly Payments
A potential driver of higher delinquencies among recently originated auto loans is higher monthly payments. Figure 3 shows the average monthly payment by a 20-point bin of the Equifax Risk Score, hereafter referred to as "credit score." From January 2017 to January 2020, average required monthly payments increased about $40, from $430 to $470. By contrast, from January 2020 to January 2023, average required monthly payments increased from $470 to about $600, a much more sizable increase that prevailed across the credit score distribution.
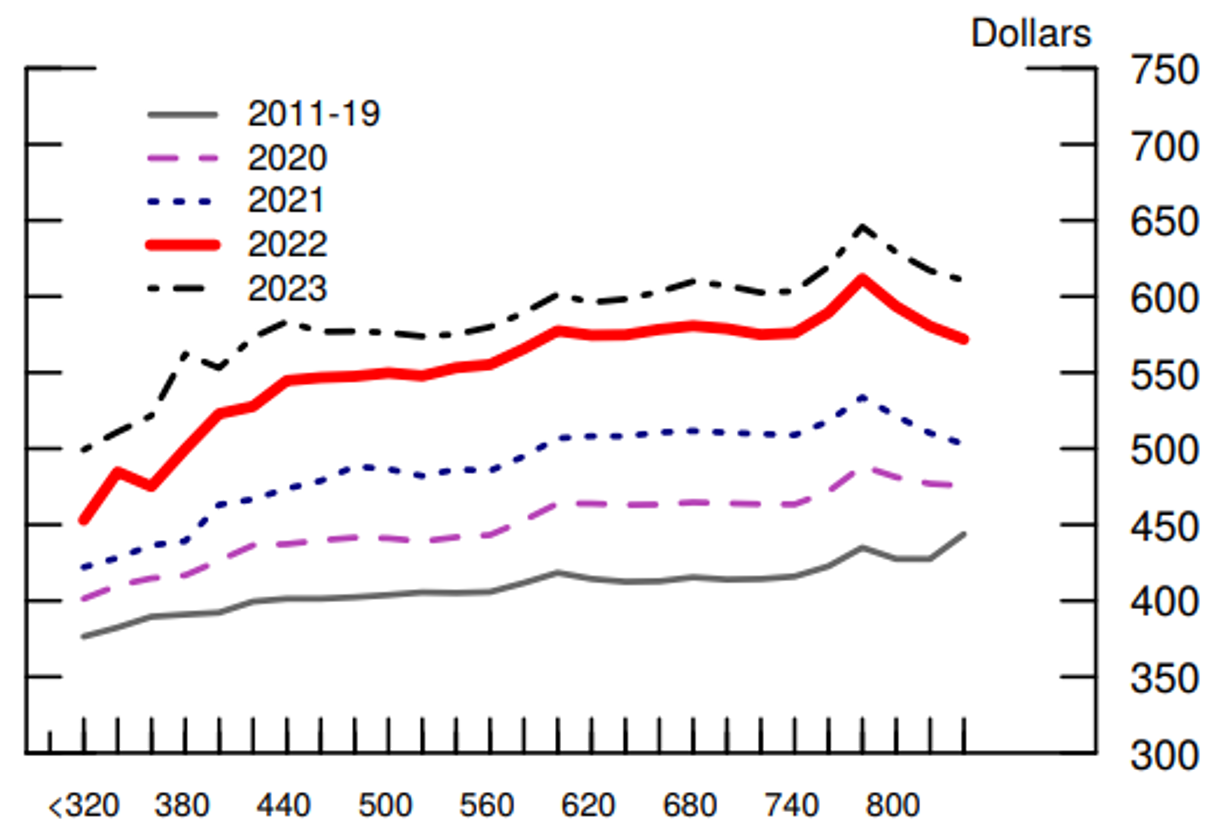
Note: Average monthly payment for new and used cars by 20 point credit score bin. Data for 2023 are through August.
Source: Experian AutoCount.
We next examine the empirical relationship between higher monthly payments and higher delinquencies. Using a linear probability model, we regress whether an individual becomes delinquent within two years of origination on the log monthly payment and other borrower controls, using the merged one percent random sample of all auto loans originated between 2017 and 2022. We estimate several versions of our model, starting with a simple regression and adding in more control variables. Table 1 presents our results.
Table 1. Delinquencies and Monthly Payment
| (1) | (2) | (3) | (4) | (5) | |
|---|---|---|---|---|---|
| Log Monthly Payment | 0.027*** | 0.026*** | 0.029*** | 0.051*** | 0.001*** |
| (0.001) | (0.001) | (0.001) | (0.003) | (0) | |
| Moderate Income × Log Monthly Payment | -0.008** | ||||
| (0.003) | |||||
| Medium Income X Log Monthly Payment | -0.023*** | ||||
| (0.003) | |||||
| High Income X Log Monthly Payment | -0.031*** | ||||
| (0.003) | |||||
| Has Mortgage | 0.006*** | 0.006*** | 0.001*** | ||
| (0.001) | (0.001) | (0) | |||
| Has CC | -0.021*** | -0.022*** | -0.003*** | ||
| (0.001) | (0.001) | (0) | |||
| Has Student Loan | -0.005*** | -0.005*** | -0.001*** | ||
| (0.001) | (0.001) | (0) | |||
| Has Personal Loan | -0.008*** | -0.008*** | -0.001*** | ||
| (0) | (0) | (0) | |||
| Has Other Loan | 0.005*** | 0.005*** | 0 | ||
| (0.001) | (0.001) | (0) | |||
| Log Total Debt | -0.003*** | -0.003*** | -0.001*** | ||
| (0) | (0) | (0) | |||
| Observations | 1,851,673 | 1,851,102 | 1,851,102 | 1,851,102 | 1,851,102 |
| R-squared | 0.133 | 0.178 | 0.182 | 0.182 | 0.062 |
| Year-Qtr FE | YES | YES | YES | YES | YES |
| Score FE | YES | YES | YES | YES | YES |
| Census Tract FE | YES | YES | YES | YES |
Note: This table examines the relationship between log monthly payment and delinquency. Each observation is an auto loan origination. In specifications (1)-(4), the dependent variable is an indicator equal to 1 if the borrower becomes at least 30 days delinquent within two years of origination. In specification (5), the dependent variable is an indicator equal to 1 if the borrower becomes at least 90 days delinquent within two years of origination. Standard errors are clustered at the county level. The sample includes loans originated from 2017 to 2022. ***, **, and * indicate statistical significance at the 1%, 5%, and 10% levels, respectively.
Across all the models, we find that the coefficient on monthly payments is consistently positive and statistically significant, implying that a higher minimum monthly payment is correlated with a greater probability of delinquency. In Specification (1), we include fixed effects for borrower age, year-quarter, and 20-point credit score bins fixed effects. Specification (2) adds census tract fixed effects, which control for granular differences in income and other characteristics across census tracts. Specification (3) adds indicator variables for whether the borrower has a mortgage, a credit card, a student loan credit card debt, a personal loan, or another type of loan, as well as the total amount owed across all accounts. Controlling for these borrower characteristics slightly increases the coefficient on Log Monthly Payment.8
Specification (3) shows that, on average, a 1 percentage point increase in monthly payment is correlated with more than a 2.9 basis point increase in the likelihood of delinquency.9 In the regression sample, the average payment increased about 25 percent from the end of 2019 to the end of 2022, while the probability of becoming delinquent within two years rose from 6.32 percentage points at the end of 2019 to 8.08 percentage points at the end of 2022. Our findings suggest that the increase in monthly payment can explain about 40 percent of the increase in the two-year delinquency rate during this period, holding constant all other loan and borrower characteristics.10
Specification (4) adds interactions between monthly payments and the income levels described in the Data section. The coefficients on the interaction terms are negative and decrease monotonically in accordance with increasing relative income levels. The omitted category is low-income census tracts. The results imply that in a low-income census tract, the relationship between log monthly payment and delinquency is almost two-thirds larger than in the average tract (5.1 percent), while, in a high-income census tract, it is about two-thirds as large (2 percent). Notably, the relationship between monthly payment and delinquency holds across all census tract types, as the sum of the coefficients on log monthly payment and each of the interaction terms is statistically different from zero at the 0.01 percent level.
Finally, for robustness, in Specification (5), we use as the dependent variable an indicator equal to 1 if the borrower becomes 90 days delinquent within two years of origination. As one would expect, the coefficient is much smaller in magnitude, but the results are similar.
What Drives the Recent Increase in Monthly Payments?
Required monthly payments depend mechanically on three factors: loan size, interest rate, and term length. Specifically, as for any installment loan, the monthly payment can be calculated as $$\ MP=L\frac{r\left(1+r\right)^n}{\left(1+r\right)^n-1},$$ where $$MP$$ is the monthly payment, $$L$$ is the loan size, $$r$$ is the interest rate, and $$n$$ is the term in months. For simplicity, in the discussion below, we do not consider the loan repayment period, since the loan term has generally increased during the past several years and increases in the loan term mechanically decrease monthly payments.
We next examine the roles of larger loan sizes and higher interest rates in driving up monthly payments. Figure 4 shows the distribution of loan sizes among newly originated loans by a 20-point credit score bin. As Panel A shows, since 2020, average loan size increased 26 percent for loans to subprime borrowers with credit scores below 620 and just under 20 percent for loans to prime borrowers with credit scores above 720.11 As the formula in the previous paragraph shows, all else being equal, a 1 percent change in loan size directly leads to a 1 percent change in required monthly payments. Therefore, if nothing else changed, the increase in loan size could explain almost all of the 30 percent increase in monthly payments for subprime borrowers and a significant portion of the increase for prime borrowers.
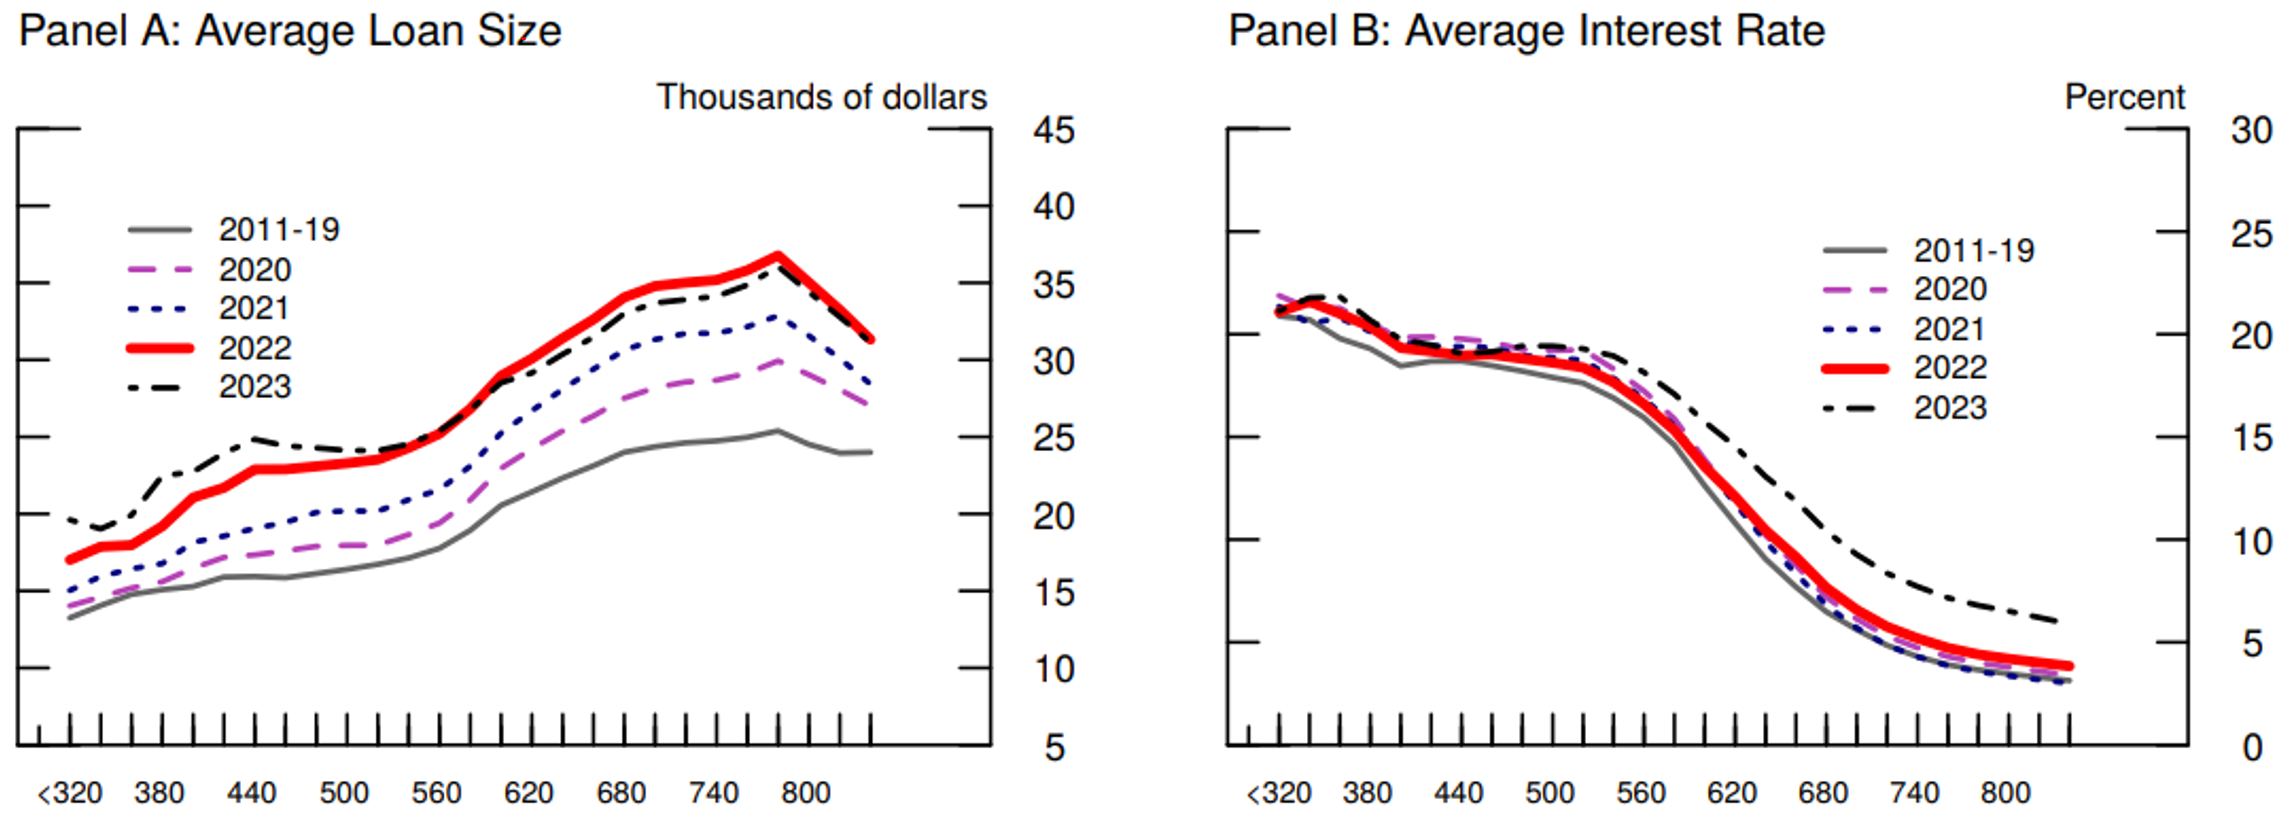
Note: Average interest rate for new and used cars by 20 point credit score bin. Data for 2023 are through August.
Source: Experian AutoCount.
By contrast, the increases in auto loan rates can explain only a small share of the increases in monthly payments over the same period. Panel B of Figure 4 shows that, on average, subprime and prime auto loan rates increased about 140 basis points and 300 basis points, respectively, between 2020 and 2023.12 With nothing else changing—holding loan size fixed at its average 2020 level with a 60-month repayment period—we calculate that the 140 basis point increase in the interest rate for the average subprime auto loan borrower would lead to a monthly payment increase of about $15 (3 percent). The relatively high subprime auto loan interest rate is the main reason for this small change, because the 140 basis point increase is small in percentage terms (14 percent). However, although the 300 basis point increase is relatively significant (90 percent) for prime borrowers, the relatively low level of prime auto loan interest rates means that interest is a small share of monthly payments for these borrowers. Thus, prime borrowers' monthly payments increase only about $40 from the interest rate rise. Although the reasons differ, higher interest rates do not appear to explain the higher monthly payments for any borrower.
Why did Auto Loan Size Rise?
Several factors help explain this sharp increase in loan size since 2020. First, before inching down in 2023, average car prices increased about 30 percent between January 2020 and September 2022, probably because of supply constraints and household demand from the economic stimulus.13 As car prices surged, car buyers sought larger loans.
At the same time, lenders approved these loans, reflecting an aggregate loosening of standards that took place via two distinct mechanisms. First, lenders may have approved loans that they would have rejected in previous years. According to the Federal Reserve Bank of New York Survey of Consumer Expectations, the share of respondents who applied for an auto loan over the past 12 months was approximately the same in the 2021–22 period as in the 2018–19 period, but the rejection rate among applicants was only 5 percent in the 2021–22 period, compared with 7 percent in the 2018–19 period. In addition, median nominal earnings rose 15 percent between 2020:Q1 and 2023:Q3, while auto loan size increased more than 20 percent, suggesting the debt burden of interest payments relative to income increased on average.14
Second, the composition of lenders originating auto loans changed significantly during this period. Banks, which held about 35 percent of loans outstanding in the auto market in 2019, appeared to tighten standards and pull back from lending in 2022 and 2023.15 At the same time, credit unions and finance companies stepped in and filled this gap.16 In particular, independent finance companies experienced increases in originations and, as of the end of 2023, accounted for a greater share of originations.17 These companies are not affiliated with a car manufacturer and tend to focus on riskier segments of the population, as evidenced by both higher loan-to-value ratios and higher delinquencies. As a result, their loans tend to have higher delinquencies and their LTV ratios, on average, are currently about 40 percentage points higher than those of banks.18
Discussion
In this note, we provide evidence on the drivers of the recent rise in auto loan delinquencies. We show that delinquencies generally correlate with monthly payments and that the recent increase in auto loan payments has been driven by loan size, rather than interest rate increases. These trends are especially relevant for consumers with very low credit scores, where loans amounts increased more dramatically, and interest rates changed little. Moreover, amid the increase in car prices since 2020, lenders approved the larger loans that borrowers sought and that many borrowers subsequently became delinquent on.
Our analysis also sheds light on how delinquency rates may evolve in the future. Used auto prices have come down considerably from the highs seen in 2022, and new car prices also began to retract beginning in late 2023. At the same time, respondents to the June 2024 module of the Federal Reserve Bank of New York Survey of Consumer Expectations indicated the highest rejection rate among auto loan applicants since the survey began in 2014. Because the effective duration of auto loans is fairly short, changes in affordability and credit standards for newly originated loans can quickly lead to changes in delinquency rates within several quarters, especially for low-income and low credit-score borrowers.
References
Adams, William, Liran Einav, and Jonathan Levin (2009). "Liquidity Constraints and Imperfect Information in Subprime Lending." American Economic Review, vol. 99 (1): 49–84.
An, Xudong, Larry Cordell and Sharon Tang (2020), "Extended Loan Terms and Auto Loan Default Risk," Philadelphia Federal Reserve Bank Consumer Finance Institute Working Paper, WP20-18.
Bord, Vitaly M. and Lucas M. Nathe (2022), "Delinquency Rates and the 'Missing Originations' in the Auto Loan Market," FEDS Notes. Washington: Board of Governors of the Federal Reserve System, February 11.
Driscoll, John C., Jessica N. Flagg, Bradley Katcher, and Kamila Sommer (2024). "The Effects of Credit Score Migration on Subprime Auto Loan and Credit Card Delinquencies," FEDS Notes. Washington: Board of Governors of the Federal Reserve System, January 12.
Dunbar, Jack, Christopher Kurz, Geng Li and Maria Tito (2024) "In the Driver's Seat: Pandemic Fiscal Stimulus and Light Vehicles," FEDS Notes. Washington: Board of Governors of the Federal Reserve System, March 2024.
Guo, Zhengfeng, Yan Zhang, and Xinlei Zhao (2022) "Risks of long-term auto loans," Journal of Credit Risk, 18(4), pp. 1-27.
Goodman, Sarena, Geng Li, Alvaro Mezza, and Lucas Nathe (2021). "Developments in the Credit Score Distribution over 2020," FEDS Notes. Washington: Board of Governors of the Federal Reserve System, April 30.
Haughwout, Andrew, Donghoon Lee, Daniel Mangrum, Joelle Scally, Wilbert van der Klaauw, and Crystal Wang (2024). "Auto Loan Delinquency Revs Up as Car Prices Stress Budgets," Federal Reserve Bank of New York, Liberty Street Economics (blog), February 6.
Kukla, Chris and Ben Litwin (2022). "Market monitoring insights: examining the potential credit impact of high vehicle costs for consumers," Consumer Financial Protection Bureau (blog), September 19.
1. The views presented here are those of the authors and do not necessarily reflect those of the Federal Reserve Board or its staff. We thank Geng Li, Michael Palumbo, and Kamila Sommer for helpful comments. Return to text
2. An et al (2020) and Guo et al (2022) focus on longer loan maturities and auto loan performance. Return to text
3. For robustness, we consider 90+ day delinquencies in the fifth column of Table 1. Return to text
4. Census tract information is obtained from Federal Financial Institution Examination Council census tract files used for Community Reinvestment Act examinations. We compare the census tract income relative to the MSA income for MSAs and rural county income otherwise. Relative income measures also account for differences in cost of living across geographic regions. Return to text
5. Throughout this note, credit score refers to the Equifax Risk Score included in the CCP. We refer to borrowers with credit scores of less than 620 as subprime; 620 to 720 as near prime; and borrowers with credit scores above 720 as prime. The seasonal adjustment includes a level shift in 2020:Q2. Return to text
6. See Bord and Nathe (2022). Return to text
7. For a discussion of the role of this decline, called credit score migration, on delinquency rates, see Goodman et al. (2021) and Driscoll et al. (2023). Return to text
8. In unreported results, we show that the coefficients are very similar in magnitude when including controls for the total payments made on non-auto debt, the number of recent inquiries before auto loan origination, and fixed effects for the type of lender originating the loan. Return to text
9. Although we end the sample in 2022, some loans originated in 2022 do not have a full two years of data to track delinquencies. To address the concern that, because of this, specification 3 underestimates the true coefficient, in unreported results, we rerun specification (3) removing loans originated in 2022. The coefficient declines slightly to 0.025. Return to text
10. In unreported results, we show that a 1 percentage point increase in monthly payment is associated with a 1.5 percentage point increase in the likelihood of delinquency within one year. In addition, using delinquency within three years as the dependent variable yields an almost identical 0.029 coefficient. As discussed above, the majority of loans are repaid or default within two years of origination. Return to text
11. For credit scores lower than 560, the average loan size increased by more than 30 percent. Return to text
12. In fact, average interest rates for credit scores lower than 560 increased less than 100 basis points and, in some cases, did not increase at all. Return to text
13. Dunbar et al (2024) discuss how fiscal stimulus such as the Paycheck Protection Program resulted in greater car sales. Return to text
14. See: https://fred.stlouisfed.org/series/LES1252881500Q. Return to text
15. See Senior Loan Officer Opinion Survey on Bank Lending Practices. Board of Governors of the Federal Reserve System (US), Net Percentage of Domestic Banks Tightening Standards for Auto Loans [STDSAUTO], retrieved from FRED, Federal Reserve Bank of St. louis; https://fred.stlouisfed.org/series/STDSAUTO. Return to text
16. Finance companies include loans originated by captive finance companies, which are owned by car manufacturers; independent finance companies; and dealers. Return to text
17. Originations of auto loans by credit unions also increased. However, credit unions generally do not lend to very risky borrowers and generally have low delinquencies, despite relatively high loan-to-value ratios, likely, in part, because of restricted membership fields and lower interest rates due to their tax-exempt status. Return to text
18. Average loan-to-value ratios at independent finance companies lie above 120 percent and may indicate car trade-ins or large up-front fees. Return to text
Adams, Robert, Vitaly Bord, and Haja Sannoh (2024). "Rising Auto Loan Delinquencies and High Monthly Payments," FEDS Notes. Washington: Board of Governors of the Federal Reserve System, September 26, 2024, https://doi.org/10.17016/2380-7172.3623.
Disclaimer: FEDS Notes are articles in which Board staff offer their own views and present analysis on a range of topics in economics and finance. These articles are shorter and less technically oriented than FEDS Working Papers and IFDP papers.