FEDS Notes
February 28, 2025
The Sectoral Evolution of China's Trade1
Francois de Soyres, Ece Fisgin, Alexandre Gaillard, Ana Maria Santacreu, and Henry Young
Since 2018, Chinese officials have been emphasizing the need for China to achieve greater self-reliance. As discussed in de Soyres and Moore (2024), China has reduced its reliance on imported inputs, while simultaneously becoming more dependent on foreign demand to absorb its manufactured goods. In this Note, we look at the evolution of the sectoral composition of China's exports and imports and investigate its similarity with the sectoral composition of the trade baskets of advanced economies (AEs).
First, using a gravity model, we show that bilateral trade flows are significantly influenced by the complementarity between trading partners' export and import profiles---a metric we develop to complement existing measures that primarily focus on export similarity. This relationship persists after controlling for conventional variables. Our findings demonstrate how sectoral analysis can reveal shifting trade patterns and competitive dynamics during periods of rapid industrial transformation.
We then document three key trends regarding the sectoral composition of Chinese international trade over the past decade. First, using existing measures of export similarity, we show that China has shifted towards producing and exporting in the same sophisticated product categories as advanced economies, particularly the euro area. Second, using our new index capturing the congruence between the sectoral specialization of an exporter and sectoral dependencies of an importer, we highlight that China is importing fewer of the types of goods that European countries typically export, potentially limiting European exporters' ability to benefit from Chinese economic growth. Third, we reveal how China's export basket is becoming more aligned with the import patterns of advanced economies, which could potentially strengthen China's position to serve AE markets.
1. Measuring Trade basket Similarity
To gauge the evolution of trade basket similarity, the current literature relies on an Export Similarity Index (ESI), introduced by Finger and Kreinin (1979), which measures the degree of similarity between the export structures of two countries. Consider two countries, A and B. Let $$X_{i,A}$$ represent country A's total exports (to all countries globally) in sector $$i$$ and let $$X_A$$ represent country A's total exports. The Export Similarity Index (ESI) is defined as:
$$$${ESI}_{AB}=100\ast\sum_{i=1}^{N}{Min\ \left(\frac{X_{i,A}}{X_A},\ \frac{X_{i,B}}{X_B}\right)}$$$$
Note that $$\frac{X_{i,A}}{X_A}$$ represents the share of sector $$i$$ in country A's total exports. The index ranges from 0 (completely dissimilar export profiles) to 100 (when export profiles are identical), capturing how closely the sectoral composition of exported goods between both countries coincides. Intuitively, it is a measure of the overlap between two countries' export baskets.2
Tracking the ESI's evolution over time reveals important shifts in global trade patterns, indicating whether countries are becoming competitors or complementary partners in international markets. For instance, changes in the ESI between a developing country and Advanced Economies can reveal trends such as industrial upgrading or shifts in comparative advantage.3
Introducing a new Exporter-Importer sectoral similarity index
To complement existing measures focused on export similarity, we construct an index that measures the similarity between a country's export profile and another country's import profile. This index, which we call the Partner Similarity Index (PSI), captures how well the goods that a country exports to all its trading partners match the goods that another country imports from all its trading partners. Denoting by $$M_{i,B}$$ the total imports of country B in sector $$i$$, from all partners worldwide, we define PSI as:
$$$${PSI}_{AB}=100\ast\sum_{i=1}^{N}{Min\ \left(\frac{X_{i,A}}{X_A},\ \frac{M_{i,B}}{M_B}\right)}$$$$
Unlike the ESI, which is symmetric ($${ESI}_{AB}=\ {ESI}_{BA}$$), the PSI is a directed index and $${PSI}_{AB}\neq\ {PSI}_{BA}$$. An increase of $${PSI}_{AB}$$ indicates that the export basket of country A is becoming more aligned with the sectoral composition of the imports of country B. When investigating the drivers of international trade, the PSI metric enables us to capture the congruence between the sectoral specialization of an exporter and sectoral dependencies of an importer.
Data
In the subsequent analysis, we use 3-digit Harmonized System (HS) sector-level trade data from the United Nations Commodity Trade Database (UN Comtrade) for 2010–2023. UN Comtrade compiles official import and export statistics from hundreds of reporting countries, providing a consistent dataset of bilateral trade flows for cross-country analysis.
To validate whether our PSI measure effectively captures potential trade relationships, we test its predictive power for bilateral trade flows using a gravity model framework. Using a sample of 32 Advanced and Emerging Market countries, we estimate the following specification:4
$$$$X_{AB,t}=\ \beta_1\ {PSI}_{AB,t}\ +\ \beta_2\ {RTA}_{AB,t}+\ {FE}_{AB}+\ {FE}_{A,t}\ +\ {FE}_{B,t}+\ \varepsilon_{AB,t}$$$$
where $$X_{AB,t}$$ is exports from country A to country B at time $$t$$, $${PSI}_{AB,t}$$ is our new index measuring export-import similarity from country A to country B at time $$t$$, $${RTA}_{AB,t}$$ is an indicator variable for whether there is a regional or bilateral trade agreements between countries A and B at time $$t$$ or not, $${FE}_{AB}$$ is a country-pair fixed effects that controls for all time invariant bilateral characteristics such as distance or common language, and $${FE}_{A,t}$$ and $${FE}_{B,t}$$ are country-time fixed effects that capture cyclical push and pull factors respectively. The results are presented in Table 1 below and reveal that an increase in PSI is associated with an increase in bilateral trade flows, over and beyond standard gravity variables. Not surprisingly, countries will import more from those countries whose sectoral specialization is closer to their own sectoral dependences. This result is robust to varying the set of fixed effects as shown in columns 1 to 3, or, as shown in column 4, to using Poisson Pseudo Maximum Likelihood (PPML) which enables the inclusion of observations with a trade flow of zero in the sample. Importantly, the new PSI metric enables researcher to introduce a sectoral dimension into aggregate bilateral gravity settings.
Table 1: Gravity Specification including the Partner Similarity Index
| VARIABLES | (1) Log(Trade) |
(2) Log(Trade) |
(3) Log(Trade) |
(4) PPML: Trade |
|---|---|---|---|---|
| $$PSI_t$$ | 0.076*** | 0.068*** | 0.028*** | 0.026*** |
| (0.001) | (0.001) | (0.002) | (0.001) | |
| $$RTA_t$$ | 0.936*** | 0.027 | 0.047*** | |
| (0.02) | (0.016) | (0.014) | ||
| Importer x Year FE | yes | yes | yes | yes |
| Exporter x Year FE | yes | yes | yes | yes |
| Country-Pair FE | no | no | yes | yes |
| Years | 2010-2023 | 2010-2023 | 2010-2023 | 2010-2023 |
| Observations | 13,117 | 13,117 | 13,117 | 13,125 |
| $$R^2$$ | 0.76 | 0.79 | 0.98 | 0.99 |
Note: Robust standard errors are used and the constant is suppressed from output. *** p<0.1, ** p<0.05, * p<0.1
Using the most robust specification outlined in column three, finding a country with a one percentage point increase in similarity as measured by the PSI corresponds to approximately a 2.7% increase in imports by the importing country from that exporting country. This result is statistically highly significant and is also economically meaningful considering the average PSI value between trading partners is 42.9% with a standard deviation of 14.3% during this time period.
2. Documenting China's trajectory
Having established the association between bilateral trade flow and export-import similarity as measured by our PSI index, we now focus on documenting the evolution of both ESI and PSI indices between China and AEs.
We start by assessing the extent to which China's development was associated with an increase in its export similarity with AEs. In the left panel of Figure 1, we plot the evolution of ESI between China and selected AEs. In the right panel, we decompose the total increase between 2010 and 2023 into their sectoral contributions.5
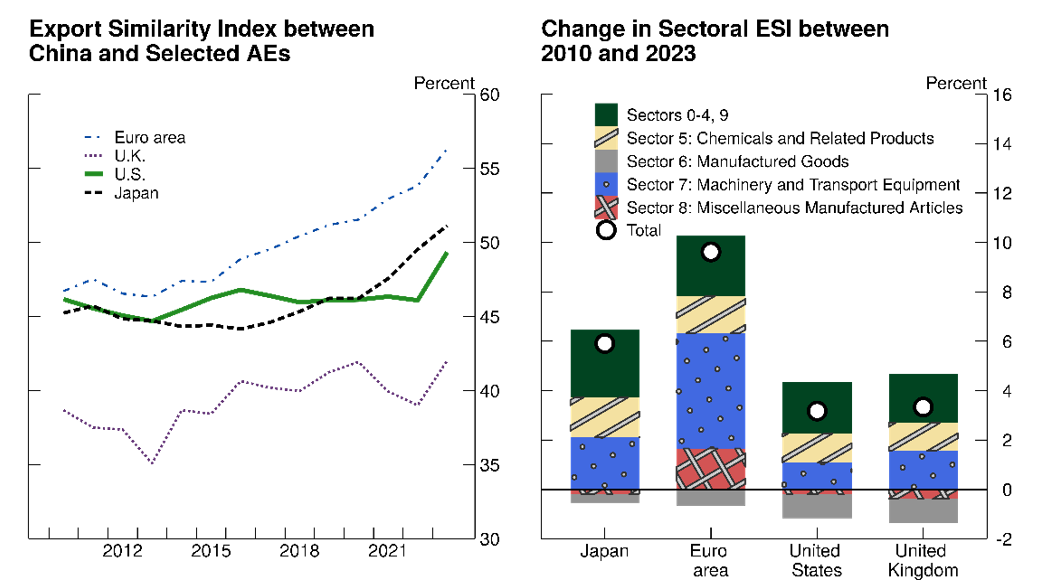
Over that period, the similarity between China and euro area exports increased the most, rising by 10 percent. In terms of sectoral contribution, we note that the increase was driven mainly by SITC sector 7 (Machinery and Transport Equipment), which notably reflects the rise in China's automotive industry. In fact, the share of SITC sector 78 (Road Vehicles, which includes parts and accessories) in China's total exports increased notably from 2.9 percent in 2013 to 5.9 percent in 2023. During the same period, the euro area export share of Road Vehicles decreased a touch, from 14 percent in 2013 to 13.5 percent in 2023.
The similarity between China's and Japan's exports increased by slightly less than that of the euro area, rising by about 6 percentage points over the period. Turning to the US, we observe that the ESI was essentially flat between 2010 and 2022, before jumping by 4 percent in 2023.
Turning to the PSI metric, we first examine how the similarity between AE's exports and China's imports has evolved over time. In Figure 2, the left panel reveals notable differences across AEs. Looking first at the euro area, Japan and the UK, we observe that the similarity between these AE's exports and Chinese imports decreased notably. As seen in the right panel of Figure 2, the increasing sectoral mismatch between euro area exports and Chinese imports is largely driven by the SITC-7 sector (Machinery and Transport Equipment), reflecting decreasing Chinese imports in the automotive industry as the country becomes more self-reliant in that sector. In fact, while sector 78 (Road Vehicles, which also includes parts and accessories) represented about 4.5 percent of Chinese imports between 2013 and 2017, it decreased continuously in subsequent years and reached only 2.7 percent of Chinese imports in 2023.
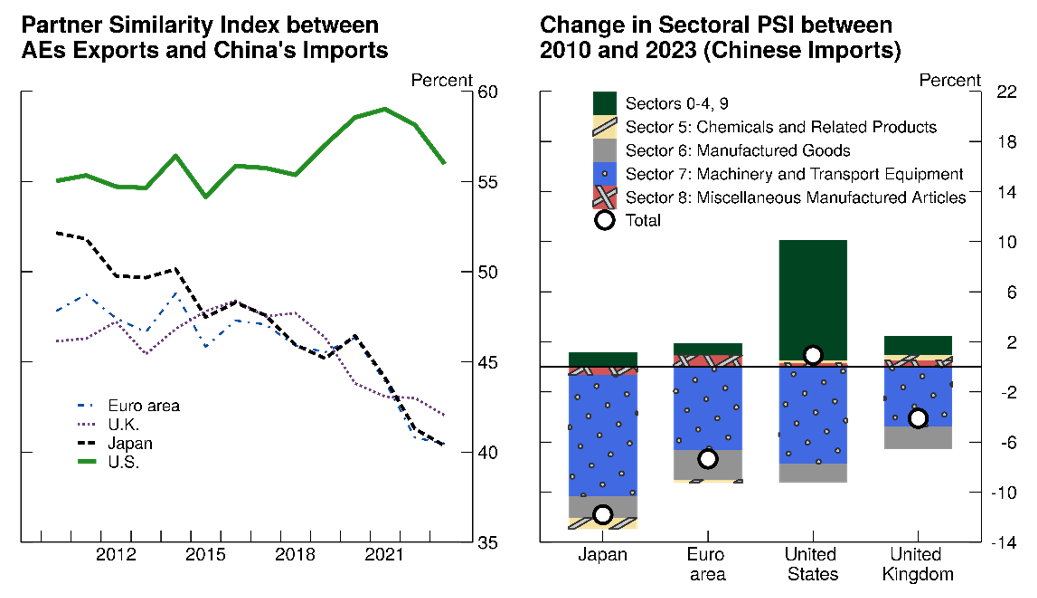
However, the sectoral similarity between US exports and Chinese imports remained essentially flat since 2010, stemming from countervailing forces. On the one hand, the drop in Chinese import share in sector 7 (Machinery and Transport Equipment) drove a decrease in similarity between US exports and Chinese imports. On the other hand, this growing mismatch was compensated by increases in China's import share in energy commodities which led to increased similarity between US exports and Chinese imports.
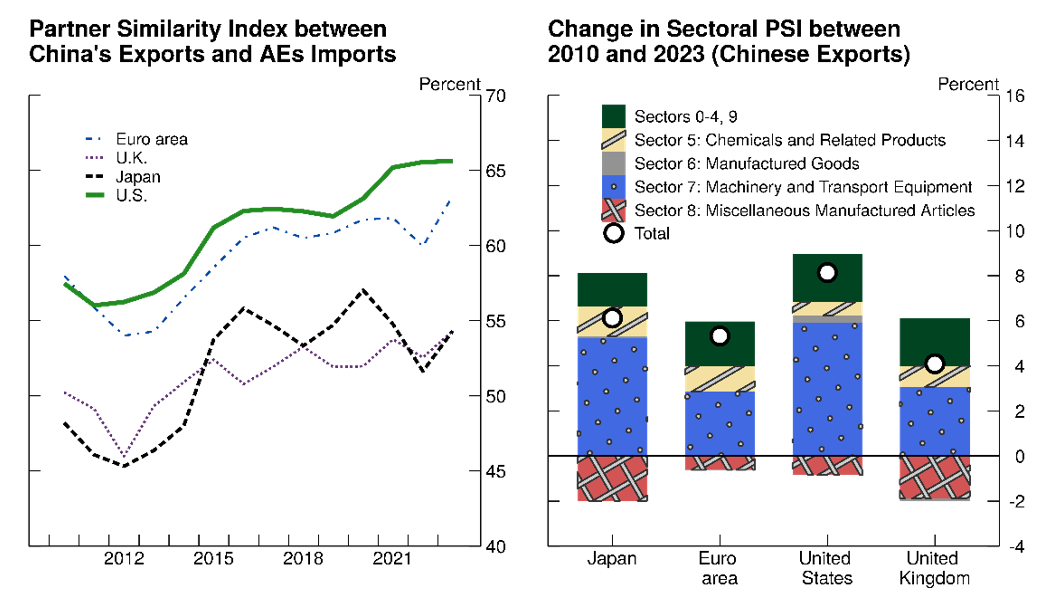
Finally, the same exercise can be done by looking at the reverse trade flows. In Figure 3, the left panel highlights a notable increase in similarity between sectors exported by China and sectors imported by all AEs. As seen on the right panel, the surge in sectoral similarity is again mostly accounted for by sector 7 (Machinery and Transport Equipment) as China gradually increased its export share in that sector while AEs maintained a high import share.
3. Lessons for future research
The evolving composition of China's exports can potentially have important implications for understanding international economic spillovers. As China's exports become more similar to those of AEs, the level of competition in third markets intensifies. This can lead to potential market displacement, as traditional exporters may lose market shares in industries where China is becoming a strong competitor, such as automotive, high-tech goods or green technologies. Additionally, increased competition can also weigh on prices, as Chinese firms may undercut prices, affecting profit margins for firms from advanced economies.
The similarity in export composition likely reflects China's move up the value chain—from producing labor-intensive goods to more advanced, technology-driven products. Given ongoing tensions in some sectors, a convergence in export profiles and an increased sectoral similarity between Chinese exports supply and AEs imports demand can intensify trade tensions, as countries might adopt protective trade measures to safeguard domestic industries.
4. Conclusion
Rising similarity between China and Advanced Economies export profiles highlight the importance of looking beyond aggregate trade flows and flesh out changes in the sectoral composition of trade.
Changes in trade profiles at the sectoral level could have important consequences for the evolution international spillovers of shocks and affects the balance between competition and cooperation in trade and technology, a topic we are exploring further in de Soyres et al. (2025).
References
de Soyres, François, and Dylan Moore (2024). "Assessing China's Efforts to Increase Self-Reliance," FEDS Notes. Washington: Board of Governors of the Federal Reserve System, February 2, 2024.
de Soyres, François, Ece Fisgin, Joaquin Garcia-Cabo Herrero, Mitch Lott, Chris Machol, and Keith Richards (2024). "An investigation into the economic slow-down in the euro area," FEDS Notes. Washington: Board of Governors of the Federal Reserve System, December 20, 2024.
de Soyres, François, Ece Fisgin, Alexandre Gaillard, Ana Maria Santacreu and Henry Young (2025), "From Partners to Rivals: The Global Trade Dynamic", Working Paper.
Riad, N., Errico, M. L., Henn, C., Saborowski, C., Saito, M., & Turunen, M. J. (2012). "Changing patterns of global trade." International Monetary Fund, Departmental Paper No 2012/001.
Schott, Peter K. (2008) "The relative sophistication of Chinese exports," Economic Policy, Volume 23, Issue 53. doi.org/10.1111/j.1468-0327.2007.00195.x
Wang, Pei-zhi and Xiaojing Liu. (2015) "Comparative Analysis of Export Similarity Index between China and EU ." Proceedings of the 2015 International Conference on Management Science and Management Innovation. www.atlantis-press.com/proceedings/msmi-15/25836042
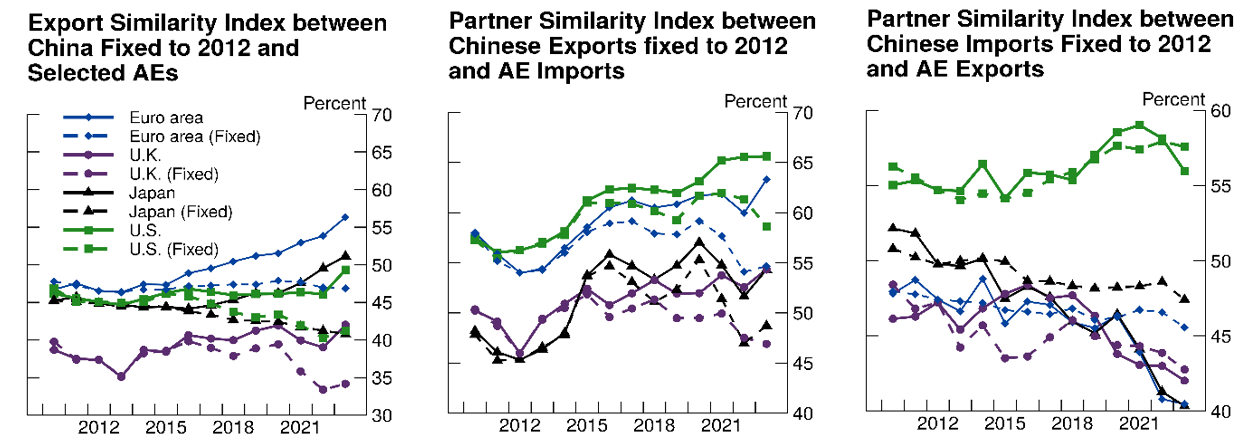
Appendix
Figure 4 shows the evolution of our various trade similarity indices when China's export and import trade basket is kept fixed. The left panel shows that, if China had kept constant the sectoral composition of its export basket, the ESI between China and all AEs would have been roughly constant over time. In other words, the observed increase in ESI between China and AEs is largely attributable to China's sectoral repositioning. Similarly, both the increase in PSI between China's exports and AE's imports and the decrease in PSI between China's imports and AE's export are also largely due to changing composition of China's trade basket. As discussed in section 2, the US is an exception to the above pattern as the similarity between China's im- port and US exports is largely unchanged over the past decade. Holding China's import shares constant does not change this observation.
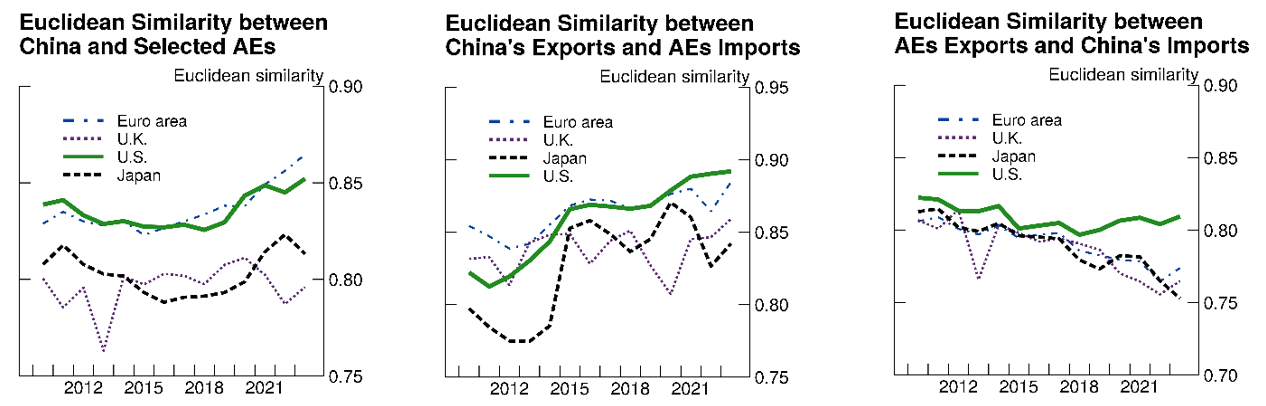
In the analysis above, we use Finger and Kreinin (1979)'s index for ESI which is based on summing the sectoral overlap of export flows, and we construct PSI using a formula that follows a similar logic. To investigate whether our findings are robust to alternative definitions of similarity, we construct an alternative metric based on simple Euclidian distance, defined as:
$$$${ESI}_{AB}^{Eucl}=1-\sqrt{\sum_{i=1}^{N}\left(\frac{X_{i,A}}{X_A}-\frac{X_{i,B}}{X_B}\right)^2}$$$$
We similarly define an alternative PSI metric based on Euclidean distance. Figure 5 shows the evolution of trade similarity indices when using a trade sectoral similarity metric based on Euclidian distance. Results based on this alternative metric are qualitatively unchanged: over the past decade, the sectoral (Euclidian) similarity between China's exports and AE's exports increased, the similarity between China's exports and AE's imports increased, while the similarity between China's imports and AE's exports decreased.
Finally, Table 2 presents the estimation results of gravity regression specifications analogue to Table 1, but using the PSI metric based on Euclidian distance. This alternative definition of sectoral alignment between an exporter and an importer features the same statistical and economic association with bilateral trade.
Table 2: Robustness using Euclidian version of PSI
| VARIABLES | (1) Log(Trade) |
(2) Log(Trade) |
(3) Log(Trade) |
(4) PPML: Trade |
|---|---|---|---|---|
| $$PSI_t$$ | 0.100*** | 0.090*** | 0.023*** | 0.021*** |
| (0.002) | (0.002) | (0.002) | (0.002) | |
| $$RTA_t$$ | 0.990*** | 0.028* | 0.061*** | |
| (0.020) | (0.017) | (0.015) | ||
| Importer x Year FE | yes | yes | yes | yes |
| Exporter x Year FE | yes | yes | yes | yes |
| Country-Pair FE | no | no | yes | yes |
| Years | 2010-2023 | 2010-2023 | 2010-2023 | 2010-2023 |
| Observations | 13,117 | 13,117 | 13,117 | 13,125 |
| $$R^2$$ | 0.74 | 0.78 | 0.98 | 0.99 |
Note: Euclidean PSI metric is multiplied by 100 to make results comparable to PSI. Robust standard errors are used and the constant is suppressed from output. *** p<0.1, ** p<0.05, * p<0.1
Recognizing the role of other factors
The PSI from China to the US and other AEs has shown a steady increase over recent years, indicating that China's export capabilities have become increasingly well-aligned with US import demands. However, although we showed that PSI is statistically and economically significantly related to actual trade flows in our gravity regressions, the growing potential complementarity has not been fully reflected in actual trade flows for some specific countries.
In figure 6, we show the evolution of the share of AE's import coming from China. In line with the evolution of PSI, the Chinese import share increased in total imports of the euro area and the UK.6 However, we also notice a significant decrease in the Chinese import share in total imports for the US. Interestingly, the difference between rising PSI values and trade patterns becomes noticeable after 2017, suggesting that policy factors–notably trade tensions and the implementation of trade restrictions–may have influenced the realization of these trade complementarities between nations.
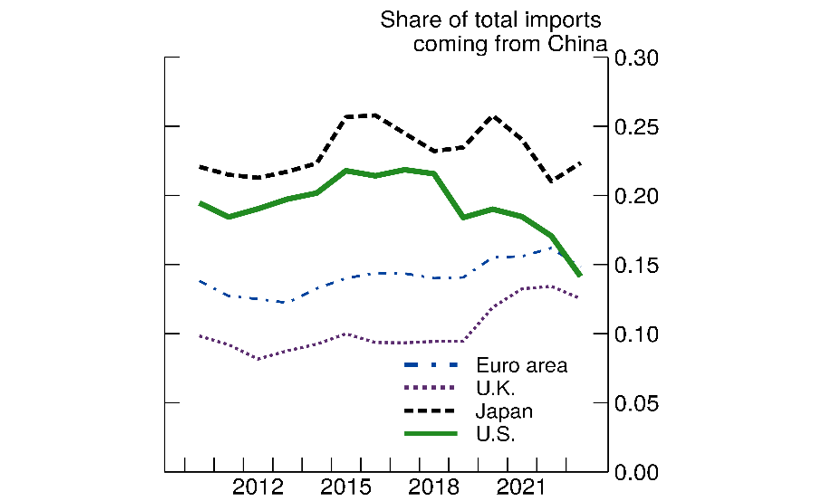
Source: UN Comtrade.
1. François de Soyres and Ece Fisgin are with the Board of Governors of the Federal Reserve System. Alexandre Gaillard is with Brown University. Ana Maria Santacreu is with the Federal Reserve Bank of Saint Louis. Henry Young is with the University of Michigan. The views expressed in this note are our own, and do not represent the views of the Board of Governors of the Federal Reserve, the Federal Reserve Bank of Saint Louis, nor any other person associated with the Federal Reserve System. Return to text
2. Mechanically, the min operator returns 0 whenever either $$\frac{X_{i,A}}{X_A}$$ or $$\frac{X_{i,B}}{X_B}$$ are 0. Hence, if countries A and B's exports are specialized in mutually exclusive sectors, the min operator returns 0 for all sectors and their ESI is 0. Furthermore, if the sectoral shares of both countries' exports are exactly the same for every sector, then the min operator simply returns the value of these sectoral shares which, mechanically, sum to 1. Return to text
3. Earlier changes in Export Similarity Indices between China and other countries can be found in Schott (2008), Riad et al (2012) or Wang and Liu (2015). Return to text
4. Our sample contains a total of 32 countries (and 992 country-pairs) between 2010 and 2023. Return to text
5. In additional investigations shown in the appendix, we also computed the time evolution of these indices when holding China's sectoral export constant. This exercise highlights that, if China had kept the composition of its exports unchanged, the similarity index with AEs would have been roughly flat over time. In other words, the increase in similarity between China and AE exports is the result of China's evolution and repositioning of exports, whereas the composition of most AE's exports was fairly constant over time during that period. In the appendix, we also examine sensitivity with respect to alternative measures of similarity. Return to text
6. As noted in de Soyres et al. (2024), over the past decade, the euro area imports from China as a share of euro-area GDP increased notably, while Chinese imports from the euro area (as a share of China GDP) decreased by almost half. Return to text
de Soyres, Francois, Ece Fisgin, Alexandre Gaillard, Ana Maria Santacreu, and Henry Young (2025). "The Sectoral Evolution of China's Trade," FEDS Notes. Washington: Board of Governors of the Federal Reserve System, February 28, 2025, https://doi.org/10.17016/2380-7172.3713.
Disclaimer: FEDS Notes are articles in which Board staff offer their own views and present analysis on a range of topics in economics and finance. These articles are shorter and less technically oriented than FEDS Working Papers and IFDP papers.