Report on the Economic Well-Being of U.S. Households in 2013
- Preface
- Executive Summary
- Introduction
- Household Economic Well-Being
- Housing and Household Living Arrangements
Housing and Household Living Arrangements
Since housing is an important factor in most households' financial equation, the SHED posed a series of housing-related questions to survey participants. The survey included questions meant to increase understanding of how housing choices and experiences may have changed coming out of the recent recession.
According to the survey, 58 percent of all respondents owned their home in 2013, 32 percent rented, and 9 percent neither owned their home nor paid rent. Restricting the sample to heads of household only, the share who owned their home increased to 66 percent, which matches the Census estimate for the same period.3 Among those who did not currently own a home, 6 percent had owned a home in the prior 12 months. The share of household heads who reported renting was 31 percent, and only 3 percent reported that they neither owned their home nor paid rent.
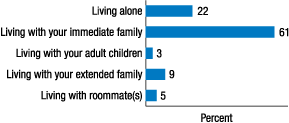
In terms of their living arrangements, 22 percent of respondents reported living alone; the majority (61 percent) resided with their immediate family (figure 4).
Renters
About one-third of households reported renting their home. The average renter paid $830 in monthly rent, while the median renter paid $700. Renters were asked to give all reasons for renting rather than owning their home, with the most common responses being that they can't afford a down payment to buy a home (45 percent), can't qualify for a mortgage (29 percent), find it more convenient to rent (24 percent), or find it cheaper to rent than own (23 percent). Almost 10 percent of renters indicated that they are currently looking to buy a home. The fact that 59 percent cited down-payment challenges, inability to obtain a mortgage, and/or reported that they were currently looking to buy as their reason for renting seems to indicate that a sizeable percentage of renters would ultimately prefer to own a home were it possible for them to do so. Others who cited convenience or affordability as their reasons to rent seemed to signal a preference for renting based on its own advantages.
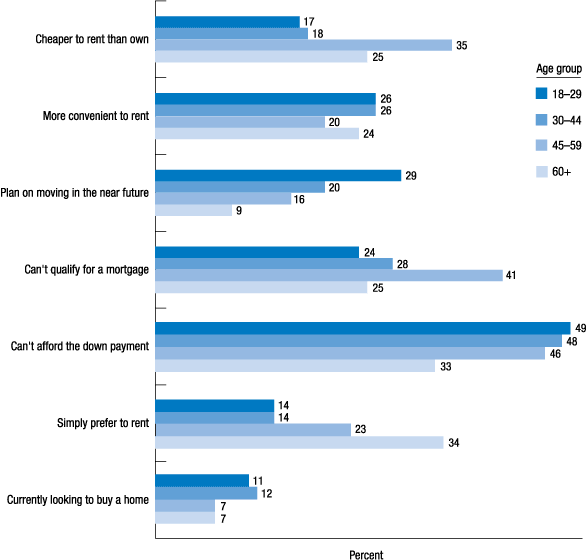
The reasons that respondents cited for why they rent rather than own their home varied by age in several notable ways (figure 5). Among renters, those ages 18 to 29 were far more likely to indicate that they plan on moving in the near future (29 percent) than those in other age groups, and were the most likely to indicate that they can't afford the down payment (49 percent). Those ages 45 to 59 were the most likely to cite their inability to qualify for a mortgage as the reason for renting (41 percent), while those ages 60 and over simply prefer to rent (34 percent).
Over 50 percent of renters indicated that they had to cut back on spending to some degree over the prior 12 months in order to pay their rent, with 17 percent indicating that they had to cut spending back by "a lot."
Homeowners
Nearly 60 percent of respondents said they owned their home. Among homeowners at the time of the survey, 68 percent had a mortgage, and among mortgage holders, 21 percent also had a home equity line of credit. The average homeowner had purchased the home in 1998, while the median owner had bought the home in 2002.
Nationally, home values have varied greatly in recent years. The SHED asked respondents who were homeowners about the perceived value of their own homes and how they believe those values have changed over time. When asked to compare the current value of their home to the value five years prior (2008), 45 percent of homeowners said that the value of their home was now lower, while 20 percent said that the value had stayed the same, and 27 percent said that the home now had a higher value. Eight percent said that they didn't know how or whether the value of their home had changed.
Most homeowners expected home values in their neighborhood to increase over the next 12 months, with 14 percent expecting values to increase by more than 5 percent and 26 percent expecting values to go up by less than 5 percent. Thirty-seven percent of homeowners expected the value of homes in their neighborhood to remain about the same over the coming 12 months, while less than 10 percent expected homes to decrease in value.
The depressed house prices appeared to prevent some homeowners from listing or selling their homes. When asked if they wanted to sell their home or had tried to sell their home over the prior 12 months, 9 percent of homeowners said they had kept their home off the market despite wanting to sell, and 2 percent said that they had listed their home but had been unable to sell it. In nearly three-quarters of cases, the current market value of the home was cited as the reason for not listing or selling the home.
References
3. U.S. Census Bureau (2013), "Residential Vacancies and Homeownership in the Third Quarter 2013," news release, November 5, www.census.gov/housing/hvs/files/qtr313/q313press.pdf. Return to text


