Report on the Economic Well-Being of U.S. Households in 2014
- Preface
- Executive Summary
- Introduction
- Overall Economic Well-Being
- Housing and Household Living Arrangements
- Economic Fragility and Emergency Savings
- Savings and Spending
- Banking, Credit Access, and Credit Usage
- Education and Student Loans
- Retirement
Banking, Credit Access, and Credit Usage
Banking and credit access can be important tools for wealth accumulation and for establishing the resources to withstand short-term economic hardships. Given the importance of banking and credit for economic well-being and individuals' long-run economic trajectory, the SHED asks several questions pertaining to the use of banking services, credit availability, and the demand for credit among respondents. The survey finds that lacking a bank account or using alternative financial services is prevalent among lower-income respondents. The results also show that a sizeable minority of those who applied for credit had difficulties getting approved. However, despite the challenges that some face when trying to access credit, a majority of respondents do feel that credit is available to them should they desire it.
Unbanked and Underbanked
Based on the results of the survey, 8 percent of respondents are considered unbanked, as they do not have a checking, savings, or money market account. A further 12 percent of respondents are underbanked, defined as having a bank account but also using an alternative financial service such as a check cashing service, money order, pawn shop loan, auto title loan, paycheck advance, or payday loan.9
The likelihood of being unbanked or underbanked varies substantially by income, with lower-income respondents being much less likely to have a traditional banking relationship (table 10). Among respondents with incomes under $40,000 per year, 17 percent are unbanked and 19 percent are underbanked.
| Income categories | Fully banked | Unbanked | Underbanked |
|---|---|---|---|
| Less than $40,000 | 63.2 | 16.7 | 19.2 |
| $40,000-$100,000 | 83.2 | 4.6 | 11.3 |
| Greater than $100,000 | 92.3 | 1.6 | 5.6 |
| Overall | 79.4 | 7.6 | 12.2 |
| Total number of respondents | 5,896 |
Access to Credit
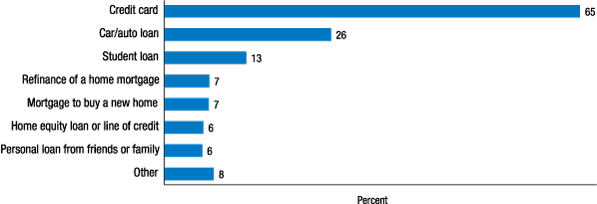
The survey also inquires about respondents' demand for credit in the past year. Thirty-seven percent of respondents applied for some type of credit in the prior 12 months, up from 31 percent in the 2013 survey. Among those who applied for credit, credit cards and auto loans were the most common application types, with 65 percent reporting that they applied for a credit card and 26 percent reporting that they applied for an auto loan (figure 12).

Note: Among respondents who reported having applied for credit in prior 12 months.
Return to textTwenty-four percent of respondents who applied for credit were denied credit at least once (9 percent of the entire population). However, some respondents who applied for credit were also limited in their credit access without receiving an outright denial--either by being offered less credit than they desired or by putting off a credit application because they expected to be denied (table 11). Overall, 32 percent of respondents who applied for credit were either denied outright or offered less credit than they applied for. Thirty-five percent of those who applied were denied, offered less credit, or put off applying for additional credit due to a fear of denial.
| Yes | No | |
|---|---|---|
| Denied credit | 24.4 | 73.6 |
| Offered less credit than applied for | 15.5 | 81.1 |
| Also put off applying for other credit because you thought you would be denied | 18.7 | 78.0 |
| Total number of respondents | 2,054 |
Note: Among those who reported having applied for credit in prior 12 months.
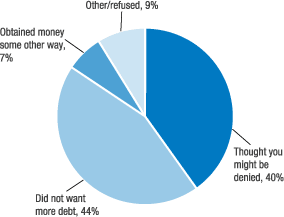
The survey also asks respondents who did not apply for credit whether they desired credit but chose not to submit an application. Twelve percent of respondents who did not submit a credit application in the past year report that they had a desire for additional credit. When asked why they did not act on their desire for credit by submitting an application, these respondents were closely split between thinking that their application would be denied and simply not wanting to take on more debt (figure 13).
Figure 13. Why did you choose not to submit a credit application when you desired credit in the past 12 months?

Note: Among respondents who desired credit in the past 12 months but did not submit a credit application.
Return to textConsidering the entire population, including both those who applied and did not apply for credit, 16 percent of respondents indicate that they were denied credit outright, offered less credit than they desired, or thought they would be denied so put off some or all of their credit applications. The rate of denial, or expected denial, is higher among respondents with incomes under $40,000. Among respondents in this income group, 24 percent of respondents were denied credit, offered less credit, or thought they would be denied.
The survey also finds that respondents who are denied credit, offered less credit, or who expected to be denied are more likely to have used some form of alternative financial services in the prior year. Thirty-eight percent of these individuals used alternative financial services, which compares to 15 percent of the overall population who did so. This may indicate that some individuals who cannot receive credit through traditional channels are turning to alternative financial services instead. However, it also may reflect underlying differences in either the credit needs, creditworthiness, or financial choices of those who use alternative financial services and those who do not.
Mortgages
In general, respondents are reasonably confident in their ability to obtain a mortgage if they were to apply for one. Overall, 60 percent of respondents indicate they are either somewhat or very confident they would be approved (table 12). This is an increase in confidence from 2013, when 55 percent expressed this level of confidence.
| Income categories | Very confident | Somewhat confident | Not confident | Don't know |
|---|---|---|---|---|
| Less than $40,000 | 19.2 | 20.7 | 39.6 | 19.9 |
| $40,000-$100,000 | 44.5 | 20.3 | 22.6 | 11.3 |
| Greater than $100,000 | 59.8 | 17.3 | 14.2 | 7.8 |
| Overall | 40.8 | 19.6 | 25.7 | 13.1 |
| Total number of respondents | 5,896 |
Confidence in mortgage approval varies substantially by income, as only 19 percent of respondents with a household income under $40,000 say that they are very confident that their loan would be approved if they applied for a mortgage. This may partially reflect the income requirements for a mortgage, but it may also reflect the large fraction of low-income borrowers who report lacking good credit. Less than half of respondents making under $40,000 per year rate their credit rating as "good" or better, whereas 85 percent of those in the highest income group feel that they have good, very good, or excellent credit (figure 14). Irrespective of one's income level, respondents reporting poor, fair, or unknown credit lack confidence in their ability to get a mortgage, with only 16 percent of these respondents feeling that they would be approved for a mortgage. Among those who believe their credit rating to be good or excellent, 80 percent of respondents feel that they would be approved, including two-thirds of the respondents in the lowest income group who rate their credit as good, very good, or excellent.

The survey results also indicate that confidence that a mortgage application will be approved is lower among blacks and Hispanics than it is for non-Hispanic whites. Among non-Hispanic whites, 48 percent are very confident that they would be approved for a mortgage should they apply, relative to 25 percent of Hispanics and 23 percent of non-Hispanic blacks. Blacks and Hispanics are both more likely than whites to report that they are not confident that their application would be approved or that they do not know if it would be approved or not. These differences in perceived credit access may be at least partially attributable to differences in income and other socioeconomic factors that also vary by race and ethnicity.
Credit Cards
Overall, 76 percent of respondents report that they have at least one credit card. The majority of these respondents with credit cards say that they pay their balances in full every month (56 percent). Among the remaining 44 percent who revolve their credit card balances, in the prior 12 months 81 percent report that they had been charged interest on their balance, 48 percent made only the minimum payment at least once, 39 percent carried a balance using a low-interest rate balance transfer offer, and 11 percent received a cash advance using their credit card. Each of these are largely consistent with the findings in the 2013 survey.
As was the case for mortgage credit, access to a credit card differs substantially by income. Only 60 percent of respondents with incomes under $40,000 per year have at least one credit card, approximately 20 percentage points lower than that seen for respondents making between $40,000 and $100,000 per year (figure 15). However, among respondents with a credit card, those with incomes below $40,000 were just as likely as those making between $40,000 and $100,000 to pay their bills in full each month. In each of these income groups, 53 percent of respondents with a credit card always pay their bill in full--which is 10 percentage points lower than that seen for the highest income group.
References
9. Among the respondents who do not have a checking, savings, or money market account, 63 percent use some form of alternative financial services, while 36 percent neither have a traditional bank account nor use alternative financial services.
The percentage of respondents who report not having a bank account in the SHED is similar to that seen in the 2013 Federal Deposit Insurance Corporation (FDIC) National Survey of Unbanked and Underbanked Households, which found that 7.7 percent of households do not have a bank account (see www.fdic.gov/householdsurvey/2013report.pdf). The fraction of SHED respondents who are underbanked, however, is lower than that seen in the FDIC survey. This partially reflects differences in definitions of who is underbanked, as the FDIC survey considers individuals who used remittances as underbanked while the SHED does not. Return to text

