
FEDS Notes
 Print
PrintJune 24, 2016
The Young and the Carless? The Demographics of New Vehicle Purchases
Christopher Kurz, Geng Li, and Daniel Vine
U.S. sales of new light vehicles have rebounded strongly since the end of the 2007-09 recession and are considered one of the bright spots of the recovery. Indeed, sales totaled 17.4 million units in 2015, about the same rate as the all-time record set in 2000 (thin black line in figure 1). Personal vehicle sales, which exclude sales to businesses and governments, have also rebounded strongly since the end of the recession (thick blue line in figure 1).
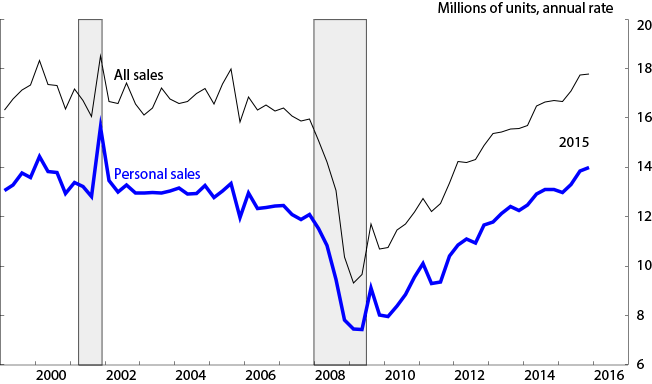 |
Note. Personal sales exclude sales to businesses and governments. Data are seasonally adjusted. Shaded area indicates NBER recession.
Source. Light vehicle sales from Ward's Automotive Group, Ward's Communications. Ward's AutoInfoBank. http://wardsauto.com/miscellaneous/wards-autoinfobank. Personal sales from IHS Automotive, driven by Polk.
As sales have rebounded, some analysts have noticed a shift in the age composition of new light vehicle buyers. Indeed, a number of recent studies and press articles have documented a dramatic decline in young adults' willingness to own vehicles, particularly in the years since the 2007-09 recession. For example, Fortune recently cited the decline in the fraction of new vehicles purchased by young adults--defined as 18 to 34 year olds--as evidence that financial constraints for that age group had increased and their interest in driving had decreased.1 As quoted in the article, young adults "just don't think driving is cool--or even necessary--anymore." Similar stories abound and often attribute these changes to the rising popularity of social media, which reduces the need to travel, and alternative means of transportation, such as ride-sharing, public transportation, and biking, which reduce the need of owning a vehicle.2
Much of this analysis was published shortly after the 2008 financial crisis and the 2007-09 recession, when many of the so-called millennial generation were entering adulthood. Because the financial crisis had severe and lingering effects on many household decisions, distinguishing its effects on vehicle purchases from the effects of cultural and technological changes can be quite difficult. For example, The Atlantic notes that while today's younger buyers do have some unique characteristics, they have begun looking increasingly like their older cohorts as their employment and income prospects have improved.3
In this note, we use data on new vehicle purchases from the Consumer Expenditure Survey (CE) and J.D. Power & Associates to examine the changes in new vehicle-buying demographics over time. We show that the average age of new vehicle buyers has risen since 2000 and that these increases were biggest during the 2007-09 recession. Although young buyers have been purchasing new vehicles at lower rates in recent years, the two most important factors that contributed to the rise in the average age of new vehicle buyers seem to be (1) the aging of the Baby Boomers--a large group that continued to purchase new vehicles at a solid rate during and after the 2007-09 recession; and (2) the decline in the new vehicle purchase rate for 35 to 50 year olds over the past 10 years.4 Moreover, we show with a probability model that vehicle purchase rates declined for all age groups after 2007, but these declines are roughly the same among the age groups once economic factors such as employment and income are taken into account.
Changes in the Age Distribution of New Vehicle Sales
The average age of new vehicle buyers has increased notably over the past 15 years, as shown by the two solid lines in figure 2. According to J.D. Power and Associates, the average age of new vehicle buyers rose from 43-1/2 years in 2000 to more than 49 years in 2009 (thick blue line). Average age stepped up most sharply in 2009, the first year after the financial crisis, and it has moved sideways since the end of the 2007-09 recession.5 Similarly, the average age of the heads of households that reported buying a new vehicle in the CE survey rose more than 5 years between 2000 to 2014 (thin black line), also with a more notable increase during the 2008 to 2009 period than at other times.6
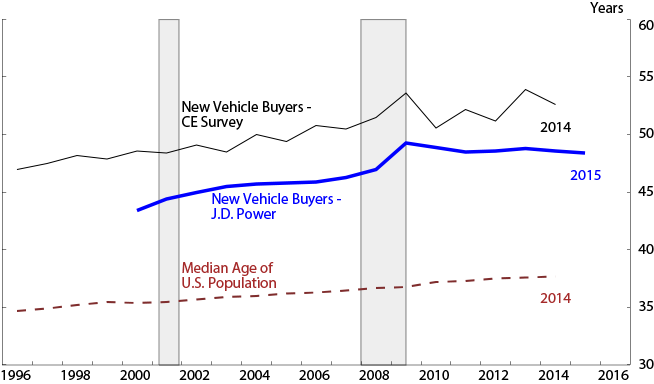 |
Note. Shaded area indicates NBER recession.
Source. Consumer Expenditure Survey, Bureau of Labor Statistics; Power Information Network PIN, a business division of J.D. Power and Associates; and United States Census Bureau.
Some--but not all--of the increases in the average age of new vehicle buyers reflects the aging of the overall U.S. population. According to the U.S. Census Bureau, the median age of U.S. residents increased 2 years between 2000 and 2015 (red dashed line in figure 2). Similarly, the average age of heads of households in the CE survey increased about 3 years (not shown). The rise in the average age of new vehicle buyers during this period was roughly twice as large as the increase in the age of the overall population.
Looking at the age composition of new vehicle buyers in more detail, table 1 shows the share of new vehicles purchased by people in four age groups in the years 2000, 2005, 2010, and 2015. The share of new vehicles bought by 16 to 34 year olds declined by about 6 percentage points between 2000 and 2015, consistent with the anecdotes of younger buyers' declining interest in buying vehicles. However, the share of new vehicles bought by 35 to 49 year olds fell by an even-larger 9 percentage points. And the share of new vehicles purchased by people 55 years and older--the only age group to register a real increase--rose by a dramatic 15 percentage points. Interestingly, the most pronounced changes between 2000 and 2015 in the age distribution of new vehicle buyers are the decline in the share of new vehicles bought by the 35 to 49 age group and the rise in the share bought by the 55 and over age group.
(Percent) |
| Year | Age group: 16 - 34 years | Age group: 35 - 49 years | Age group: 50 - 54 years | Age group: 55+ years |
|---|---|---|---|---|
| 2000 | 28.6 | 39.2 | 11.1 | 21.2 |
| 2005 | 24.3 | 36.6 | 11.5 | 27.4 |
| 2010 | 19.8 | 31.4 | 12.2 | 36.5 |
| 2015 | 22.6 | 29.9 | 11.2 | 36.4 |
Source. Power Information Network PIN, a business division of J.D. Power and Associates.
Changes in the age profile of the overall U.S. population likely explain some of the changes shown in table 1, but the rates at which people in each age group purchase new vehicles have also shifted over time. We explore this idea further by decomposing the rate of car purchases for each age group in table 2, which shows the number of new vehicles purchased per 100 people in each age group in each year. The age groups that purchase new vehicles at the highest rates--on average almost 7 out of 100 people per year--are the 35 to 49 and the 50 to 54 year olds. The average buying rate of these groups fell about 40 percent between 2005 and 2010, a period that included the 2007-09 recession, and then recouped about 90 percent of that decline between 2010 and 2015.
| Year | Age group: 16 - 34 years | Age group: 35 - 49 years | Age group: 50 - 54 years | Age group: 55+ years |
|---|---|---|---|---|
| 2000 | 5 | 8.3 | 8.7 | 4.9 |
| 2005 | 3.8 | 7.1 | 7.3 | 5.2 |
| 2010 | 2 | 4.3 | 4.8 | 4.1 |
| 2015 | 3.5 | 6.6 | 6.7 | 5.7 |
| Memo: Average | 3.6 | 6.6 | 6.9 | 5 |
Note. Average purchase rate is calculated over the four years listed in the table.
Source. Authors' calculations based on data from the Power Information Network PIN, a business division of J.D. Power and Associates; Ward's Automotive Group, Wards Communications (Ward's AutoInfoBank. http://wardsauto.com/miscellaneous/wards-autoinfobank); and United States Census Bureau.
The age group that buys new vehicles at the lowest rate--on average about 3-1/2 out of 100 people per year--is the 16 to 34 year olds. The new vehicle buying rate for this young group fell roughly 50 percent from 2005 to 2010--a bigger decline than was observed for the 35 to 54 year olds--but it also recovered after 2010 and returned to about 90 percent of its pre-recession level by 2015.
The pattern in new vehicle buying for the 55 years and over age group is somewhat different than for the others. The buying rate for this group, which averages 5 out of 100 people per year, fell only 20 percent from 2005 to 2010, and a robust recovery after 2010 pushed it up to 5.7 in 2015, well above its pre-recession level.
In summary, the average age of new vehicle buyers increased by almost 7 years between 2000 and 2015. Some of that increase reflected the aging of the overall population, but some of it reflected changes in buying patterns among people of different age groups. The most relevant changes in new vehicle-buying demographics over this period were a decline in the per-capita rate of new vehicle purchases for 35 to 54 year olds and an increase in the per-capita purchase rate for people over 55. The per-capita purchase rate among younger buyers also declined over this period, but the contribution of this decline to the rise in the average age of new vehicle buyers was not disproportionately large.
In the next section, we estimate a model of new vehicle purchases that includes economic and demographic factors, and we test more formally whether age-specific new vehicle buying patterns changed after 2007.
Model of Household New Vehicle Purchase Likelihood
Consider the probability model of whether household buys a new vehicle shown in the equation below:
$$$$ Prob(new=1) = \Phi(\alpha + \sum_{g=1}^{4} ( \delta_g + \beta_g POST)bin_g + \gamma X),$$$$
where
g = 1 if age is less than 35
g = 2 if age is between 35 & 49
g = 3 if age is between 50 & 54
g = 4 if age is greater than 54
POST = 1 if year > 2007.
The indicator variable new equals 1 if the household purchased a new vehicle during their survey year and 0 otherwise, and bing indicates that the head of household is in one of four age group bins. The indicator POST equals 1 if the household was interviewed after 2007 and 0 otherwise. The vector X includes household demographics (race, education, having children, and marriage status) and economic variables (employment status, school enrollment, and combined household income).7
We estimate this standard probability (probit) model on roughly 80,000 household responses to the CE survey collected between 1996 and 2014, which included about 6,300 new vehicle purchases. Table 3 presents the estimates from the model of the average marginal effect of each variable listed in the table on the probability that a household purchased a new vehicle in the past year. The column labeled "Baseline Model" presents estimates from a baseline specification, which tests for differences among the age groups in the average propensity to purchase new vehicles and whether those propensities changed after 2007. The column labeled "Model with Controls" presents estimates from the full model, which also includes demographic and economic variables. The marginal probabilities estimated on the demographic and economic variables seem sensible and suggest that households are more likely to buy a new vehicle if they are white, married, have more education,8 and have a higher income.
(Significance Indicators: *** is p < .01; ** is p < .05; * is p < .10) |
| Variables | Baseline Model | Baseline Model Standard Error | Baseline Model Significance Indicators | Model with Controls | Model with Controls Standard Errors | Model with Controls Significance Indicators |
|---|---|---|---|---|---|---|
| Age indicator: Age < 35 | -.018 | .005 | *** | .007 | .005 | |
| Age indicator: 35 < Age < 49 | -.004 | .004 | .003 | .004 | ||
| Age indicator: Age >54 | -.028 | .004 | *** | .000 | .004 | |
| Post-2007 Age Indicator: Age < 35 | -.029 | .005 | *** | -.035 | .005 | *** |
| Post-2007 Age Indicator: 35 < Age < 49 | -.029 | .004 | *** | -.038 | .003 | *** |
| Post-2007 Age Indicator: 50 < Age < 54 | -.027 | .006 | *** | -.034 | .006 | *** |
| Post-2007 Age Indicator: Age >54 | -.014 | .003 | *** | -.029 | .003 | *** |
| Demographic/Economic Variable: Race (White) | .022 | .003 | *** | |||
| Demographic/Economic Variable: Education (Below high school) | -.020 | .006 | *** | |||
| Demographic/Economic Variable: Education (High school) | .004 | .005 | ||||
| Demographic/Economic Variable: Education (Some College) | .011 | .005 | ** | |||
| Demographic/Economic Variable: Education (College) | .003 | .006 | ||||
| Demographic/Economic Variable: Married | .029 | .002 | *** | |||
| Demographic/Economic Variable: Employed | -.003 | .003 | ||||
| Demographic/Economic Variable: Children | -.009 | .002 | *** | |||
| Demographic/Economic Variable: Income | .047 | .002 | *** | |||
| Memo: No. of observations | 77,148 | 77,148 |
Note. Table excludes estimates for current school enrollment and spouse's employment, which were included in the column (2) specification but were not statistically significant.
We first note that the coefficients on the age group indicators do not show significant differences in the average propensity to purchase new vehicles over the entire sample period if economic and demographic controls are included in the model. That is, factors other than age explain new vehicle purchasing behavior, on average, over the entire period.
Second, the baseline and full models both show evidence of a structural break in the intercepts after 2007. The coefficients on the post-2007 age group indicators are all negative and significant, results that indicate the probability of buying a new vehicle declined after 2007 for all households, conditional on their employment status and incomes. According to the estimates, the likelihood of purchasing a new vehicle dropped by about 3 percentage points after 2007 for all age groups.9 The question remains, however, whether or not the coefficients on the post-2007 age group indicators differ significantly from one another when we control for income, employment, and other demographic factors.
Table 4 presents the significance levels of a series of chi-squared test for the pair-wise equality of the coefficients on various post-2007 age group indicators. Tests based on the baseline model are in column 1, and tests based on the full model are in column 2. In the baseline specification, we can reject the hypothesis that the coefficient on the post-2007 indicator for the oldest age group (age > 55) is equal to the coefficients for both the youngest (age < 35) and middle (35 to 49) age groups. That is, the propensity to buy a new vehicle declined more after 2007 for people younger than 50 than for people older than 54. However, once we add demographic and economic factors in the full model, the declines in purchasing propensities observed after 2007 do not differ significantly among the age groups.10
(P-values from Chi-Squared Tests) |
| Coefficients Tested | Baseline Model | Model with Controls |
|---|---|---|
| β(Age < 35) = β(35 < Age < 49) | 0.95 | 0.68 |
| β(Age < 35) = β(50 < Age < 54) | 0.86 | 0.86 |
| β(Age < 35) = β(Age >54) | 0.01 | 0.30 |
| β(35 < Age < 49) = β(50 < Age < 54) | 0.80 | 0.57 |
| β(35 < Age < 49) = β(Age >54) | 0.00 | 0.07 |
In summary, the probability model of new vehicle purchases that includes controls for employment, income, and other household characteristics suggests that the differences in average vehicle purchasing rates observed among age groups appear to reflect economic and (non-age) demographic factors. In addition, the declines in the average propensities to purchase new vehicles observed after 2007 do not appear to have varied significantly by age group, once these same economic and demographic factors are taken into account.
Conclusion
In this note, we show that the increase in the average age of vehicle buyers in recent years has reflected demographic shifts in the U.S. population as well as changes in vehicle purchasing rates among buyers in different age groups. While part of the rise in average age does reflect a decline since 2007 in the rate at which young buyers purchase new vehicles, the aging of the Baby Boomers and a drop in the purchasing rate among 35 to 50 year olds appear to be the most important factors. Using a probability model and household-level vehicle purchasing data, we find that new vehicle purchasing rates by age group have declined since 2007, but these declines do not appear to differ significantly by age group once we condition purchases on economic factors such as income and employment.
Our results suggest the decline in the per capita rate of new vehicle purchases since 2007 more likely reflects economic factors than permanent shifts in tastes and preferences for vehicle ownership. If per capita new vehicle purchasing rates eventually do return to pre-recession levels for buyers between the ages of 16 and 49 years, new light vehicle sales could easily reach levels above 18 million units per year in the coming years.
References
Badger, E. (2014, October 14). "The Many Reasons Millennials are Shunning Cars." The Washington Post. Retrieved June 14, 2016, from https://www.washingtonpost.com/news/wonk/wp/2014/10/14/the-many-reasons-millennials-are-shunning-cars/
Fry, R. (2013, February 21). "Young Adults after the Recession: Fewer Homes, Fewer Cars, Less Debt." Retrieved June 14, 2016, from http://www.pewsocialtrends.org/2013/02/21/young-adults-after-the-recession-fewer-homes-fewer-cars-less-debt/
Gorzelany, J. (2012, January 23). "Social Media Trumps Driving Among Today's Teens." Forbes.
Highway Loss Data Institute. (2015, December). "Evaluation of Changes in Teenage Driver Exposure--an Update." Highway Loss Data Institute, Vol. 32, No. 30.
Nelson, N. (2013, August 21). "Why Millennials are Ditching Cars and Redefining Ownership." National Public Radio. Retrieved June 14, 2016, from http://www.npr.org/2013/08/21/209579037/why-millennials-are-ditching-cars-and-redefining-ownership
Plache, L. (2013, May 15). "Millennials Take the Wheel: Why the Youngest Generation of Drivers is Buying More New Cars." Edmunds.com. Retrieved June 14, 2016, from http://www.edmunds.com/industry-center/analysis/millennials-take-the-wheel.html
Rechtin, M. (2013, May 17). "The death of driving? Don't Make any Funeral Plans." Automotive News. Retrieved June 14, 2016, from http://www.autonews.com/article/20130517/RETAIL/130519902/the-death-of-driving?-dont-make-any-funeral-plans
Thompson, D. (2015, April 21). "Millennials: Not So Cheap, After All. The Atlantic. Retrieved June 14, 2016, from http://www.theatlantic.com/business/archive/2015/04/millennials-not-so-cheap-after-all/391026/
Thompson, D. and J. Weissmann (2012, September). "The Cheapest Generation." The Atlantic. Retrieved June 14, 2016, from http://www.theatlantic.com/magazine/archive/2012/09/the-cheapest-generation/309060/
Tseng, N. (2013, August 16). "Why car companies can't win young adults." FORTUNE. Retrieved June 14, 2016, from http://fortune.com/2013/08/16/why-car-companies-cant-win-young-adults/
1. "Why Car Companies Can't Win Young Adults," Fortune. August 16, 2013. Return to text
2. For example, see "The Many Reasons Millennnials are Shunning Cars" (Washington Post, October 14, 2014); "Why Millennials Are Ditching Cars and Redefining Ownership" (National Public Radio, August 21, 2013), "The Cheapest Generation" (The Atlantic, September 2012), "Young Adults After the Recession: Fewer Homes, Fewer Cars, Less Debt" (Pew Research Center, 2013), and "Social Media Trumps Driving Among Today's Teens" (Forbes, February 2012). Return to text
3. See "Millennials: Not So Cheap, After All" (The Atlantic, April 21, 2015), "The death of driving?" (Automotive News, May 17, 2013), "Millennials Take the Wheel" (Edmunds.com, May 2013), and "Evolution of Changes in Teenage Driver Exposure--an Update" (Highway Loss Data Institute, December 2015). Return to text
4. We define baby boomers as the cohort of individuals born between 1946 through 1964. Return to text
5. The information supplied by Power Information Network, a business division of J.D. Power and Associates ("PIN") is based on data believed to be reliable but is neither all-inclusive nor guaranteed by PIN. Without limited the generality of the foregoing, specific data points may vary considerably from other information sources. Any opinions expressed herein reflect the judgment of the Federal Reserve Board at this date and are subject to change. Return to text
6. Average age of the head of new vehicle buying households in the CE exceeds the average age of new vehicle buying individuals in the J.D. Power data by about 5 years, on average. This gap likely reflects the fact that the heads of households are more likely older than the other members of the household. Return to text
7. Separate indicators are included for the head of household and the spouse for employment status and for school enrollment. Return to text
8. The omitted education category is an indicator variable for more than a college degree. Return to text
9. The marginal effect of the probability if purchasing a new car at the mean of the explanatory variables. For the results in the second column, the declines in purchasing probability were 3-1/2 percent for the 35 years and younger age group, 3-3/4 percent for the 35 to 49 year age group, 3-1/2 percent for the 50 to 54 year age group, and 3 percent for the 55 years and over age group. Return to text
10. The $$$ \chi^2(3)$$$ significance values for this test is $$$(Prob > \chi^2(3)) = 0.3237$$$. For the baseline specification, we can reject equality of all the coefficients for the post-recession indicators in the baseline specification $$$(Prob > \chi^2(3)) = .005)$$$. Return to text
Please cite this note as:
Kurz, Christopher, Geng Li, and Daniel Vine (2016). "The Young and the Carless? The Demographics of New Vehicle Purchases," FEDS Notes. Washington: Board of Governors of the Federal Reserve System, June 24, 2016, http://dx.doi.org/10.17016/2380-7172.1798.
Disclaimer: FEDS Notes are articles in which Board economists offer their own views and present analysis on a range of topics in economics and finance. These articles are shorter and less technically oriented than FEDS Working Papers.
