EFA: State Pensions
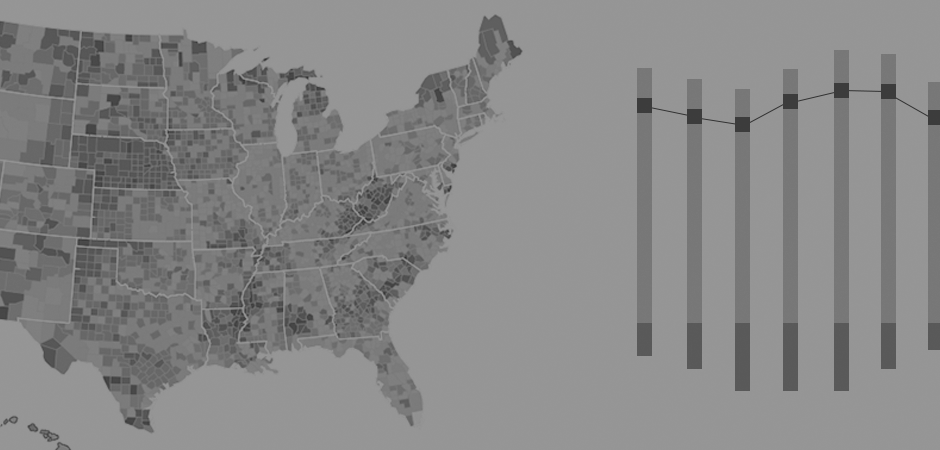
State and Local Pension Funding Status and Ratios by State, 2002 - 2022
LOADING
Last Update: December 20, 2024
Official websites use .gov
A .gov website belongs to an official government organization in the United States.
Secure .gov websites use HTTPS
A lock () or https:// means you've safely connected to the .gov website. Share sensitive information only on official, secure websites.
LOADING