EFA: State Pensions
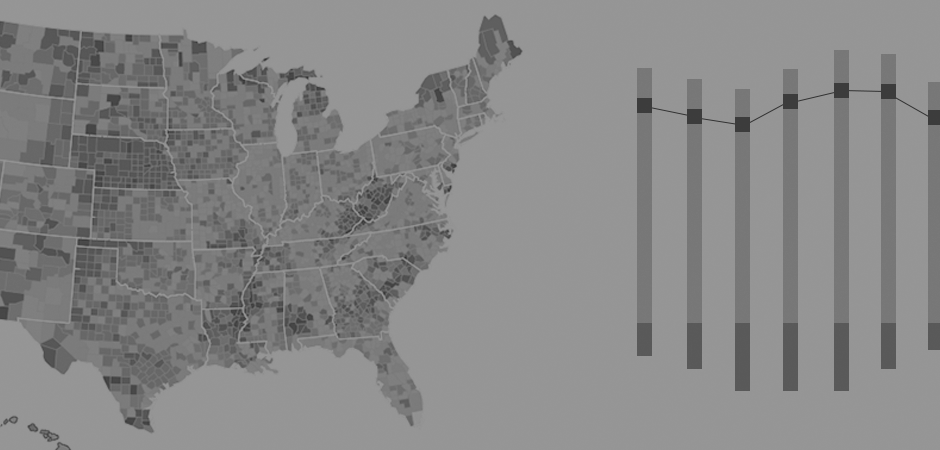
State and Local Government Pension Funding Ratios, 2002 - 2022
The funding ratio is the pension plan's assets as a percentage of liabilities. See the overview page a for information on the measurement of pension assets and liabilities.
Last Update: December 20, 2024