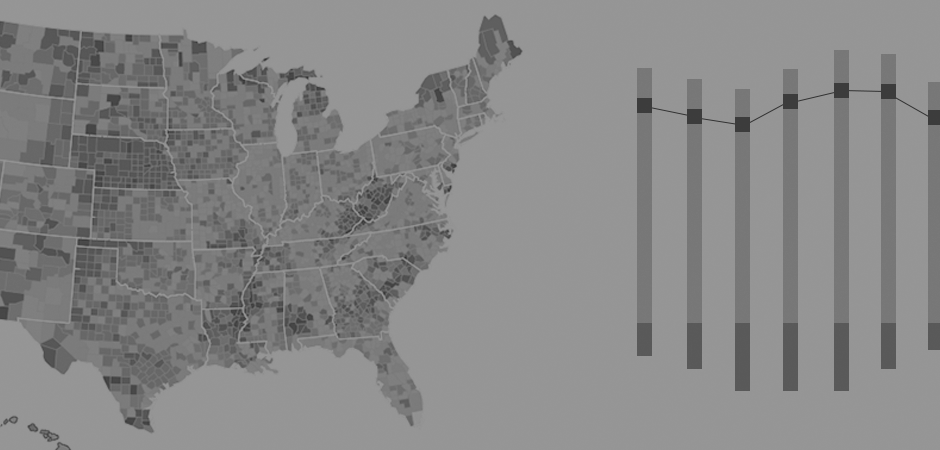
State and Local Government Pension Funding Status, 2002 - 2022

The funding status is the pension plan's assets less liabilities (measured in dollars). The map shows the funding status expressed as a percentage of state GDP.

2002 2022 2022 PLAY
United States Map

Chart graphic.

ChartCreated with Highmaps 6.2.0Zoom inZoom out
  • < -25%
  •   -20%
  •   -15%
  •   -10%
  • > -5%
Top 3 States %
District of Columbia
-0.21
Wisconsin
-0.25
Wyoming
-0.54
Bottom 3 States %
Illinois
-31.61
Mississippi
-27.87
Hawaii
-24.7
Last Update: December 20, 2024