
FEDS Notes
 Print
PrintOctober 14, 2014
Residual Seasonality in Core Consumer Price Inflation
Ekaterina Peneva
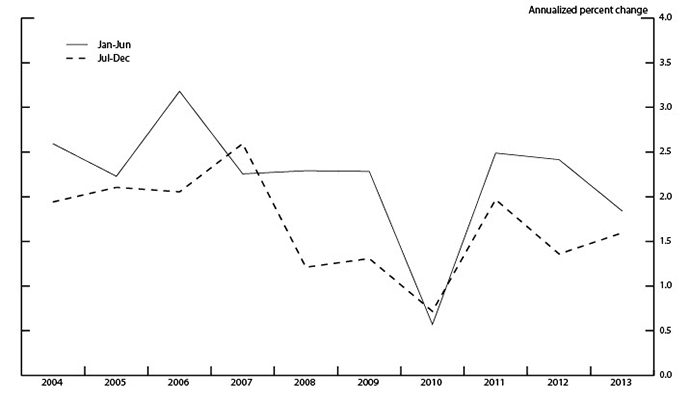
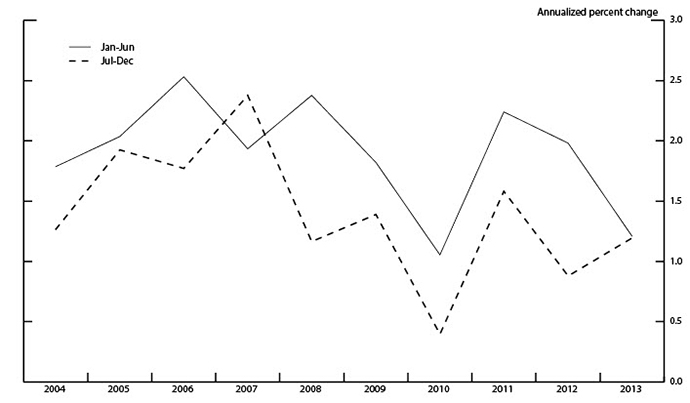
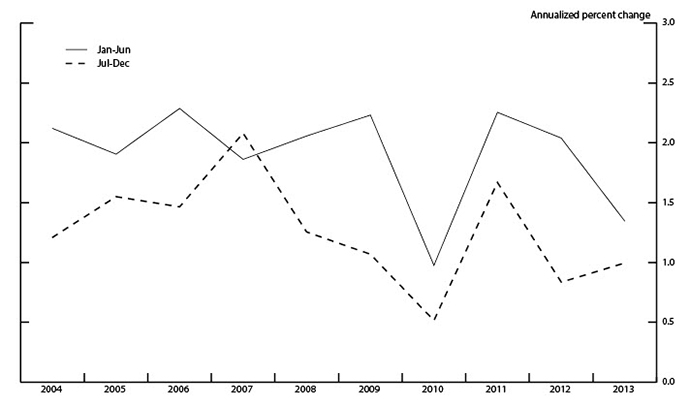
The past 10 years have typically seen a pattern in which consumer price inflation has tended to be higher in the first half of the year than in the second half. This pattern, which is evident even in seasonally adjusted data, has occurred in real time in 8 out of the past 10 years for inflation as measured by the core consumer price index (CPI) and by the core personal consumption expenditures (PCE) price index and in 9 out of the past 10 years for market-based core PCE inflation (see charts 1, 2, and 3, where the solid lines tend to lie above the dashed lines).1 This tendency for a time series to manifest a seasonal pattern despite being seasonally adjusted is sometimes referred to as "residual seasonality." The potential presence of residual seasonality in the core inflation data suggest that awareness of this pattern may be useful for anyone trying to interpret or understand current inflation developments.2
Some evidence
Table 1 shows the average deviations in the annualized three-month inflation rate from the inflation rate for the year as a whole for three price measures: the core CPI, the core PCE price index, and the core market-based PCE price index. The table reports calculations based on both real-time and current-vintage data, and covers the past 10 years.3 (By construction, the deviations sum to zero in a given year and on average across the years.4 ) For core CPI inflation, residual seasonality is more pronounced in real time than in current-vintage data. For overall and market-based core PCE inflation, however, residual seasonality does not diminish noticeably for the revised (current-vintage) data.
| Table 1: Average Difference Between the Annualized Three-Month Inflation Rate and the Inflation Rate for the Year as a Whole, 2004 to 2013 (Percentage Points) |
|---|
| Core CPI | Core PCE | Core Market-based PCE | ||||
|---|---|---|---|---|---|---|
| Current Vintage | Real-Time Data | Current Vintage | Real-Time Data | Current Vintage | Real-Time Data | |
| Jan-Mar | 0.26 | 0.21 | 0.31* | 0.42* | 0.41* | 0.44* |
| Apr-Jun | -0.04 | 0.32 | 0.13 | 0.08 | 0.05 | 0.2 |
| Jul-Sep | -0.14 | -0.15 | -0.20* | -0.27* | -0.20* | -0.26* |
| Oct-Dec | -0.08 | -0.38 | -0.25 | -0.23 | -0.26 | -0.39* |
* Statistically significant at the 10 percent level.
Source. Author's calculations using data for CPI from the Bureau of Labor Statistics and data for PCE from the Bureau of Economic Analysis
In real time (and at an annual rate), according to each of the three measures show, core inflation tends to come in 0.2 percentage point to 0.4 percentage point higher in the first three months of the year; this difference is statistically significant at the 10 percent level for the two PCE price indexes. The results for the second three months of the year are mixed, but both the market-based core PCE inflation and core CPI inflation again tend to be higher than average. By contrast, the change over the last three months of the year tend to come in lower than average for all three price measures.
For all three price measures, the residual seasonality that appears to be present over the first three months of the year is also apparent in the current-vintage data. However, for the core CPI, the residual seasonality that is evident in the real-time data for the second and final three months of the year appears to largely disappear after the index's seasonal factors have been revised. Residual seasonality for market-based core PCE price inflation in the second three months of the year also becomes negligible in the current-vintage data. However, even in the current-vintage data, market-based core PCE inflation is typically about 1/4 percentage point lower than average in the second half of the year. All told, based on both initial and revised estimates, core and market-based core PCE inflation tend to be higher than average in the first half of the year, and lower than average in the second half of the year.
For quarterly inflation ratesthat is, the annualized percent change in the quarterly average price levelsome of these differences average out, and as a result, the evidence for residual seasonality is both economically and statistically less significant (see Table 2). Nevertheless, the real-time data imply that annualized market-based core PCE inflation tends to rise by about 0.5 percentage point between the fourth and first quarters of the year (all else equal); similarly, overall core PCE inflation tends to rise 0.3 percentage point between the fourth and first quarters. The swing in current-vintage data are less pronounced.
| Table 2: Average Difference Between the Annualized Quarterly Inflation Rate and the Inflation Rate for the Year as a Whole, 2004 to 2013 (Percentage Points) |
|---|
| Core CPI | Core PCE | Core Market-based PCE | ||||
|---|---|---|---|---|---|---|
| Current Vintage | Real-Time Data | Current Vintage | Real-Time Data | Current Vintage | Real-Time Data | |
| Q1 | 0 | -0.03 | 0.08 | 0.22* | 0.18* | 0.2 |
| Q2 | 0.08 | 0.26 | 0.15 | 0.08 | 0.08 | 0.13 |
| Q3 | -0.08 | 0.11 | -0.13 | -0.16 | -0.14 | -0.05 |
| Q4 | -0.01 | -0.33* | -0.1 | -0.14 | -0.12 | -0.28* |
* Statistically significant at the 10 percent level.
Source. Author's calculations using data for CPI from the Bureau of Labor Statistics and data for PCE from the Bureau of Economic Analysis
It is difficult to tie this residual seasonality to particular subcomponents of the price indexes. Using current-vintage data, table 3 decomposes the residual seasonality for the overall core PCE price index into the contributions of various subaggregates. (These contributions are calculated using current PCE shares.) Within the market-based category, the contributions from market-based services and market-based goods are about equal despite the much larger weight of services in consumption. In addition, it appears that the presence of residual seasonality is widespread throughout the index, rather than concentrated in a few categories.
| Table 3: Contributions to Deviations from Annual Core PCE Inflation (Current-Vintage Data), 2004 to 2013 |
|---|
| Jan-Mar | Apr-Jun | Jul-Sep | Oct-Dec | ||
|---|---|---|---|---|---|
| 1 | Core PCE deviations | 0.31 | 0.13 | -0.2 | -0.25 |
| 2 | Market-based | 0.36 | 0.04 | -0.16 | -0.23 |
| 3 | MB Goods | 0.19 | 0.03 | -0.09 | -0.13 |
| 4 | Durable | 0.08 | 0.04 | -0.1 | -0.01 |
| 5 | Durable ex MV | 0.09 | 0.02 | -0.08 | -0.03 |
| 6 | Nondurable | 0.12 | -0.01 | 0.01 | -0.12 |
| 7 | Tobacco | 0.04 | 0.01 | 0 | -0.04 |
| 8 | MB Services | 0.17 | 0.01 | -0.07 | -0.11 |
| 9 | Housing | 0.01 | 0 | 0 | -0.01 |
| 10 | Medical | 0.07 | -0.03 | -0.02 | -0.01 |
| 11 | Food | 0 | 0.03 | 0 | -0.02 |
| 12 | Airfares | 0.01 | -0.02 | 0 | 0.01 |
| 13 | Other | 0.09 | 0.03 | -0.05 | -0.07 |
| 14 | Non-market | -0.04 | 0.09 | -0.03 | -0.01 |
Source. Author's calculations using data from the Bureau of Economic Analysis
Potential explanations
A number of factors could be producing the residual seasonality that appears to be present in these price measures. First, given the relatively short span of data that we consider, it is possible that these patterns are merely the result of chance. A more persistent factor may be the different seasonal adjustment procedures used to construct the CPI and the PCE price index. For example, while many detailed components in the CPI are not seasonally adjusted (the CPI seasonally adjusts at a higher level of aggregation), these detailed prices are used directly (without seasonal adjustment) in the construction of the PCE price index.5 The different seasonal adjustment procedures may also be why residual seasonality in the core CPI declines in the current-vintage data relative to the real-time data but does not appear to diminish much in the two PCE measures we study.
Conclusion
In recent years, consumer price inflation has tended to be relatively high in the first half of the year and relatively low in the second half. Even though the estimates of residual seasonality are small relative to the variance of quarterly inflation movements, keeping this pattern in mind can be helpful when interpreting incoming high-frequency consumer price data.
1. Here, we calculate the first six months of the year as average of the three-month change through March and the three-month change through June. Return to text
2. For previous discussions of residual seasonality in consumer price data, see the following Macro Focus articles by Macroeconomic Advisers: "Residual Seasonality in Core Consumer Prices" (March 5, 2007) and "To What Extent is Residual Seasonality Responsible for the Recent Upturn in Core Inflation?" (June 24, 2011). Return to text
3. To obtain real-time CPI data for a given year, we used the published seasonally adjusted CPI estimates that were available in January of the following year. (Each year, the BLS recalculates the seasonal adjustment factors to reflect price movements from the just-completed calendar year and releases them along with the January CPI numbers in February; these routine calculations can result in revisions to the past five years' worth of seasonally adjusted CPI data.) The PCE price indexes are also revised every year, with revisions resulting from the incorporation of newly available and revised source data (including any revisions to the source data's seasonal factors) and from revisions to the weights used to compute the indexes. For the real-time PCE price data, we use the estimates that were available just prior to any annual or comprehensive revisions (these revisions typically take place in the summer). Return to text
4. An annual inflation rate in this memo is defined as the arithmetic average of the annualized inflation rates for the four three-month sub-periods and can therefore differ slightly from the December-over-December inflation rate. Return to text
5. For example, the BLS seasonally adjusts the expenditure category "household furnishings and operations" but not many of its components; however, it is the more-aggregated category that is used in the construction of the seasonally adjusted overall CPI. Lower-level components that are not seasonally adjusted include "furniture and bedding"used as a component of PCE durable goodsand "household operations"used in PCE services. Thus, using these not seasonally adjusted lower-level components can introduce residual seasonality into the overall PCE price index. Return to text
Please cite as:
Peneva, Ekaterina V. (2014). "Residual Seasonality in Core Consumer Price Inflation," FEDS Notes. Washington: Board of Governors of the Federal Reserve System, October 14, 2014. https://doi.org/10.17016/2380-7172.0030
Disclaimer: FEDS Notes are articles in which Board economists offer their own views and present analysis on a range of topics in economics and finance. These articles are shorter and less technically oriented than FEDS Working Papers.
