FEDS Notes
August 21, 2023
Non-Completion, Student Debt, and Financial Well-Being: Evidence from the Survey of Household Economics and Decisionmaking
Jacob Lockwood and Douglas Webber
Introduction
As the price of college and student loan debt has grown relative to inflation in recent decades, many have questioned the return on investment offered by a college degree.1 Recent research tends to highlight the importance of risk when examining the question of “is college worth the investment?” (Hendricks and Leukhina, 2018; Akers, 2021). These works emphasize that a college degree can both be a financial boon for the average student (amounting to roughly $1 million in additional lifetime earnings), but also a risky investment which will not pay off for many students. Arguably the single-biggest determinant of the downside risk associated with attending college is the substantial likelihood of non-completion (Toutkoushian, Shafiq, and Trivette, 2013; Webber, 2016).2
In this note, we explore the relationship between non-completion in higher education and future financial well-being. Utilizing a unique set of questions in the Survey of Household Economics and Decisionmaking (SHED), we focus on a sub-population of particular interest to policymakers and colleges: individuals who borrowed for college (at any level) but failed to complete their degree. This sub-population faces the long-term financial costs of student loan borrowing without incurring the financial benefits associated with degree completion and, therefore, may face additional risks of falling behind.
The financial returns to college are disproportionately bundled with the diploma (Flores-Lagunes and Light, 2010). This means the implicit and explicit costs of attending college can be particularly burdensome for those who fail to graduate. With only about six in ten attendees of four-year institutions completing a degree, and even lower rates at two-year schools,3 the scale of the non-completion problem is large. Both the government (e.g. Denning, Marx, and Turner, 2019) and schools (Evans et. al, 2020; Goldrick-Rab et. al, 2023) have invested significant resources in attempts to increase graduation rates. The overall take-away message from this literature is that there is no free-lunch when it comes to increasing completion rates; light-touch/cheap interventions tend not to move the needle much (Oreopoulos, 2021).
Yet financial outcomes for borrowers who do not complete a degree are historically understudied due to a lack of data identifying this group. Most financial/labor market surveys do not ask about student loan borrowing, and those that do rarely capture information on which levels of education borrowers financed using student loans. In contrast, the SHED asks respondents both their highest level of education and which educational programs they funded by taking out student loans, which allows us to identify those who borrowed using student loans for a higher level of education than they completed.
We find strong negative effects of non-completion among student loan borrowers on a variety of measures of financial well-being and indicators of sentiment/regret about one's education. These negative effects exist when comparing dropouts to graduates and when holding the level of education constant and looking at the association between excess borrowing and financial outcomes. These results underscore the importance of identifying and investing in interventions which increase completion. The link between non-completion and receipt of SNAP benefits further underscores potential budgetary effects from reducing the number of programs with low completion rates.
Data and Methodology
This note uses data from the Survey of Household Economics and Decisionmaking (SHED), conducted annually by the Federal Reserve since 2013. The SHED is a nationally representative survey of roughly 12,000 adults which seeks to provide insights into the state of consumer/household finances not available in other surveys.
Our sample period spans the years 2017 to 2019. 2017 is chosen as the starting year because the relevant questions on current college enrollment needed to identify non-completion were not identical in prior survey waves. More recent surveys are not included because the pandemic student loan payment pause that began in 2020 muddles any conclusions or comparisons that can be made to prior/future years without such a pause.4
We leverage a unique set of questions asked in the SHED to identify students who borrowed for a level of education which they did not complete. The SHED separately asks respondents their highest completed level of education and the highest level of education for which they borrowed. By combining these responses with current enrollment status, we are able to identify the sub-population this note focuses on.
We estimate a series of regression models which take the following form:
$$$$ Y_i = \alpha + \beta Noncomplete + X_\gamma + \varepsilon $$$$
Y denotes various financial well-being and attitudinal outcomes (overall financial well-being, the ability to cover an unexpected $400 expense, homeownership status, SNAP receipt, beliefs about the benefits vs. costs of their undergraduate education, and specific regrets about education choices). Noncomplete is an indicator for whether the respondent borrowed for a level of education that they did not complete. X is a vector of control variables including age, race/ethnicity, gender, level of education, level of education borrowed for, and year fixed effects.
In addition to estimating Equation (1) for each dependent variable, we can also alter the implicit comparison being made by limiting the sample to a specific level of education. We fix the highest degree completed, which compares (for instance) individuals who borrowed for graduate school but did not complete their graduate education with individuals holding an undergraduate degree that never attended graduate school. This comparison focuses more on the role that additional student loan debt plays in financial well-being. Alternatively, we can fix the highest level of education an individual borrowed for. This variation focuses more on how financial well-being is associated with the failure to obtain a particular credential.
It is important to note that the variation used in this note is neither experimental nor quasi-experimental. In other words, it is not random which students drop out of college. Moreover, whatever factors lead these students to drop out are likely closely related to labor market and financial success. For instance, if a student drops out because they experience a large negative financial shock (e.g. their car breaks down, they are laid off from their job), at least part of the estimated non-completion effect will actually be causally due to this shock. The results presented below should thus be interpreted descriptively, and are meant to illustrate a specific population which is struggling and could be efficiently targeted by policymakers.
Results
Table 1 presents summary statistics for our full sample of student loan borrowers, as well as a breakdown by completion status.
Table 1: Summary Statistics
| Sample | All Borrowers | Non-completers | Completers |
|---|---|---|---|
| Female | 0.505 | 0.552 | 0.494 |
| White | 0.686 | 0.576 | 0.709 |
| Black | 0.125 | 0.202 | 0.108 |
| Hispanic | 0.108 | 0.149 | 0.1 |
| Asian | 0.033 | 0.008 | 0.039 |
| Other race | 0.048 | 0.065 | 0.044 |
| Age | 47 | 46 | 47 |
| Financial well-being (at least okay) | 0.726 | 0.512 | 0.772 |
| Cover $400 expense with cash | 0.615 | 0.351 | 0.671 |
| Homeowner | 0.635 | 0.456 | 0.674 |
| SNAP recipient | 0.09 | 0.237 | 0.058 |
| Regret (Different field) | 0.411 | 0.505 | 0.392 |
| Regret (Different school) | 0.296 | 0.457 | 0.263 |
| Regret (More education) | 0.482 | 0.771 | 0.423 |
| Any Regrets | 0.72 | 0.935 | 0.676 |
| N | 10,073 | 1,784 | 8,289 |
Note: The means presented above are derived from a pooled cross-section of 2017–2019 SHED data. The first column consists of all respondents who ever borrowed for any level of higher education. Non-completion is defined as having borrowed for a level of education greater than the highest completed level (e.g. having borrowed for graduate school despite listing a bachelor’s as the highest completed level). Currently enrolled students are excluded from the sample.
The SHED's financial well-being indicator illustrates the dramatic difference between completers and non-completers. Before getting to our main analysis, it is worth digging deeper into this variable to highlight the risks associated with borrowing for college. Table 2 reports the proportion of respondents doing at least okay financially broken down by education and borrowing status. The gaps noted in this table must not be mistaken for being causal, as the differences between respondents who borrowed vs. never borrowed could be due to the burden of student debt or the pre-existing financial situation which determined whether they needed to borrow in the first place. That said, the large magnitude of the gaps are at the very least suggestive of the high risk associated with borrowing for college if graduation is not certain. Indeed, borrowers without a bachelor's degree report significantly lower financial well-being than individuals who never attended college at all.
Table 2: Financial well-being (Doing at least okay) by education
| All | Ever borrowed | Never borrowed | |
|---|---|---|---|
| HS only | 0.673 | - | 0.673 |
| Some college no degree | 0.677 | 0.52 | 0.73 |
| Associate’s degree | 0.738 | 0.628 | 0.798 |
| Bachelor’s degree | 0.823 | 0.77 | 0.872 |
Note: The means presented above are derived from a pooled cross-section of 2017–2019 SHED data. The first column consists of all respondents who answered the education, financial well-being, and student loan questions. The second column consists of all respondents who answered yes to having current student loan debt or having repaid past student loan debt. The final column consists of respondents who responded no to having current or past student loan debt.
To illustrate the magnitude of the non-completion problem facing higher education, Figure 1 presents density plots for the distribution of 6-year completion rates for public, private non-profit, and private for-profit four-year institutions using College Scorecard5 data. While the median student is enrolled at a four-year school with a completion rate of roughly 60 percent, there is substantial variation across institutions and sectors. Since completion rates are highly correlated with institutional resources and student demographics, these large gaps in completion only serve to exacerbate pre-existing inequality.
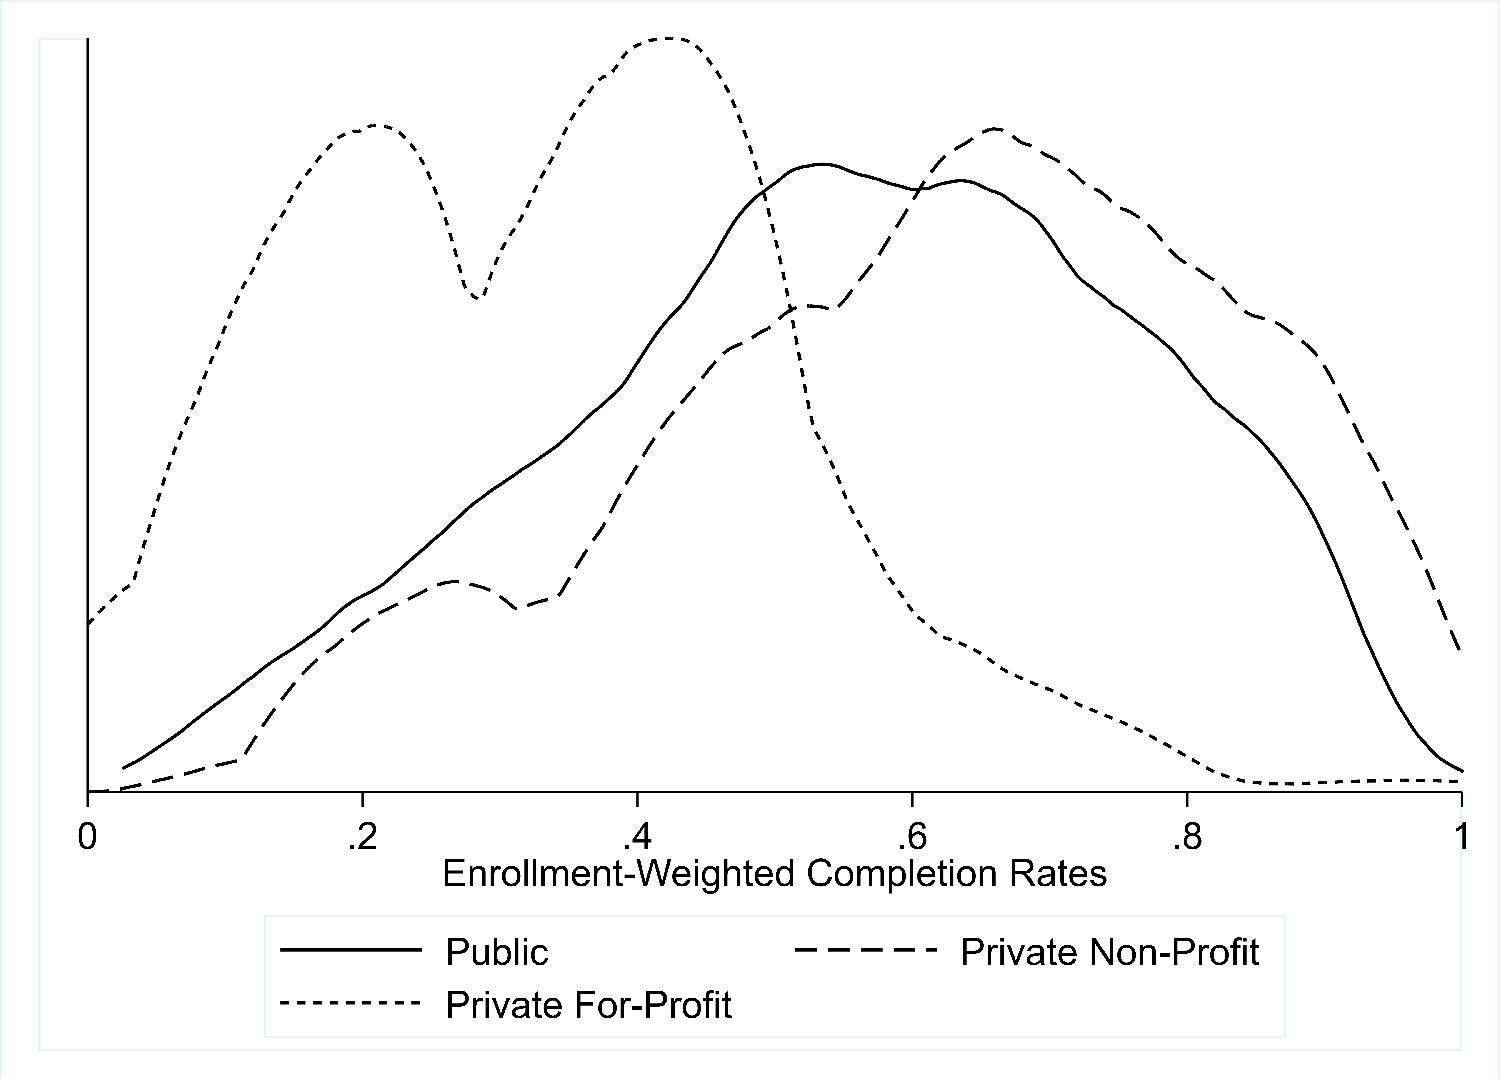
Note: Authors' calculations from the 2019–2020 College Scorecard.
Table 3 shows the relationship between non-completion and five measures of financial well-being in four different samples of student loan borrowers. The SHED measures overall financial well-being with a four-point Likert scale (1=Finding it difficult to get by, 2=Just getting by, 3=Doing okay, 4=Living comfortably). The first column collapses this measure into an indicator for whether the respondent is at least doing okay financially (e.g. 3 or 4 on the Likert scale). The second outcome measures whether the respondent would cover an unexpected $400 expense with cash or a cash equivalent, such as a credit card paid off at the next statement. The final two outcomes are homeownership status, whether the respondent is a SNAP recipient.
Table 3: Non-completion and Financial Well-Being
| Sample | Overall Financial Well-Being | Cover $400 Expense | Homeowner | SNAP Recipient |
|---|---|---|---|---|
| Overall | -0.097*** | -0.084*** | -0.094*** | 0.060*** |
| (0.023) | (0.022) | (0.022) | (0.017) | |
| BA Completers | -0.047 | -0.136** | -0.039 | 0.015 |
| (0.062) | (0.06) | (0.059) | (0.034) | |
| Borrowed for Grad | -0.195* | -0.178 | -0.187 | 0.384*** |
| (0.11) | (0.109) | (0.127) | (0.104) | |
| Borrowed for Bachelor's | -0.344*** | -0.385*** | -0.206*** | 0.159*** |
| (0.024) | (0.024) | (0.025) | (0.017) | |
| Estimated BA premium | 0.136*** | 0.189*** | 0.070*** | -0.114*** |
| (0.025) | (0.026) | (0.021) | (0.016) |
Note: Each cell represents the regression coefficient on the non-completion treatment variable from Equation (1). All models are estimated as linear probability models, and include age, gender, race, education, and year control variables. Robust standard errors are presented below each coefficient, with statistical significance at the .10, .05, and .01 levels respectively denoted by *, **, and ***.
The first row presents results from the full sample of student loan borrowers, and pools all education levels (and non-completers of each level) together. Non-completion is strongly associated with every negative financial outcome among all borrowers. The relationship between SNAP status and non-completion is especially notable, as it represents a nearly 60 percent increase in SNAP receipt among non-completers relative to the average borrower.
The second row looks only at borrowers whose highest degree is a bachelor's degree, and compares respondents who took out student loans for graduate school to those who did not. As discussed above, this comparison isolates the effect of borrowing, but roughly holds labor market opportunities constant as the level of education is fixed. Among this sample, non-completion is associated with modestly worse outcomes, though the relationships are mostly imprecise.
The third and fourth rows focus on the disparities borrowers face associated with the gap in educational credentials and how financial well-being is affected by the failure to complete a given credential, contingent on having started it. To do so, the third row compares borrowers who completed a graduate degree to those who borrowed for a graduate degree but failed to complete it. The fourth row compares borrowers who completed (at least) their bachelor's degree to borrowers failed to complete the degree. These two sets of comparisons yield the most stark differences in financial outcomes, with non-completers faring far worse.
Failing to complete one's bachelor's degree is generally associated with worse financial outcomes relative to completers, with non-completion associated with a 34 percentage point decline in the likelihood of reporting at least "doing okay" and a nearly 40 percentage point gap in whether the borrower would cover an unexpected $400 expense with cash or a cash equivalent.
A particularly useful way to frame these results is in the context of the premium that attaining a bachelor's degree produces (presented in the final row based on the overall sample, including non-borrowers).6 For instance, a BA increases the likelihood of at least "doing okay" in terms of financial well-being by 14 percentage points relative to respondents with no college degree. It should be noted that our sample is composed entirely of student loan borrowers, emphasizing the positive potential that that loan availability can provide to borrowers.7
Given that the financial impact of college graduation is considered to be enormous in magnitude, a non-completion coefficient two-thirds the size must also be considered as very large. Moreover, the fact that the penalty for failing to complete a BA is roughly two-and-a-half times as large as the premium (14 vs. 34 percentage points) highlights the substantial risk that students are taking when they borrow for college if graduation is not certain. It is important to point out the exact comparison being made here given the large magnitude of this particular relationship. First, since the entire sample is comprised of borrowers, a common type of non-completer is under-represented in the sample: students who leave within their first year. For a variety of reasons, borrowing often takes place during a student's later years (e.g. financial aid is often frontloaded). This means that the non-completers in our sample will have invested disproportionately more time in their schooling (and potentially outside the labor force) than the national average. Second, since this comparison holds constant the highest level at which a student borrowed, some of the BA completers also went on to complete graduate degrees. This is a reasonable comparison to make because failing to complete one's BA rules out the (sometimes lucrative) option value of attending graduate school, but this does muddle the interpretation somewhat. If we were to remove graduate completers from this comparison, the coefficient drops to -0.27 from -0.34.
Table 4 presents the same set of comparison groups, but instead examines the relationship between non-completion and attitudes toward education. Overall, non-completion is significantly related to feelings of regret about respondents' own undergraduate educational experience. Non-completers were more likely to wish they had chosen a different field (5.7 percentage points), a different school (5.3 percentage points, more education (10.6 percentage points), and were 6.3 percentage points more likely to have expressed any regret with their educational experience. Every subgroup of non-completers was substantially more likely to express regret, with the strongest link to wishing they had completed more education.
Table 4: Non-completion and Attitudes on Education
| Outcome | Different Field | Different School | More Education | Any Regrets |
|---|---|---|---|---|
| Overall | 0.057** | 0.053** | 0.106*** | 0.063*** |
| (0.026) | (0.024) | (0.024) | (0.019) | |
| BA Completers | 0.071 | -0.075 | 0.207*** | 0.162*** |
| (0.066) | (0.061) | (0.064) | (0.056) | |
| Borrowed for Grad | 0.391*** | 0.162 | 0.390*** | 0.365*** |
| (0.109) | (0.146) | (0.149) | (0.061) | |
| Borrowed for Bachelors | 0.155*** | 0.251*** | 0.539*** | 0.431*** |
| (0.029) | (0.028) | (0.025) | (0.019) | |
| Estimated BA premium | 0.005 | -0.133*** | -0.200*** | -0.175*** |
| (0.03) | (0.028) | (0.029) | (0.026) |
Note: Each cell represents the regression coefficient on the non-completion treatment variable from Equation (1). All models are estimated as linear probability models, and include age, gender, race, education, and year control variables. Robust standard errors are presented below each coefficient, with statistical significance at the .10, .05, and .01 levels respectively denoted by *, **, and ***.
Among respondents who attended/borrowed for graduate school, non-completion is highly correlated with feelings of regret over the field they concentrated in for their bachelor's degree (39.1 percentage points). Comparing undergraduate completers to non-completers, non-completion is more strongly associated with regretting the school they attended (25.1 percentage points) rather than their field of study (15.5 percentage points).
Conclusion
This note uses data from the Survey of Household Economics and Decisionmaking (SHED) to focus on an important population that is typically impossible to identify in other surveys: student loan borrowers who fail to complete the course of study they borrowed for. We add further evidence to the recent literature which aims to quantify both the upside and downside risks of investing in higher education.
Our results can best be summarized as college graduates who took out debt are better off than those without degrees, but college dropouts with debt are financially worse off than any group. There are myriad potential mechanisms behind this result which we hope to examine in future work. One such pathway is that of credit availability. The fact that, except in rare and specific circumstances, student loan debt cannot be discharged in bankruptcy may cause non-completion to leave a permanent stain on an individual's credit report, thereby restricting access to credit (and large purchases such as homes or cars) even in the cases where the consumer makes no payments on their student loans.8
These results further underscore the need and importance of boosting completion rates in higher education, be it through enhanced accountability for low-performing programs or increased investment in underfunded ones.
References
Addo, Fenaba R., and William A. Darity Jr. "Disparate recoveries: Wealth, race, and the working class after the Great Recession." The ANNALS of the American Academy of Political and Social Science 695.1 (2021): 173-192.
Addo, Fenaba R and Houle, Jason N and Simon, Daniel, "Young, black, and (still) in the red: Parental wealth, race, and student loan debt", Race and Social Problems 8, 1 (2016), pp. 64–76.
Akers, Beth. "Making College Pay: An Economist Explains How to Make a Smart Bet on Higher Education" Penguin Random House Press. (2021).
Altonji, Joseph G., and Seth D. Zimmerman. "The costs of and net returns to college major." Productivity in higher education. University of Chicago Press, 2018. 133-176.
Andrews, Rodney, Marcus Casey, Bradley L. Hardy, and Trevon D. Logan. "Location matters: Historical racial segregation and intergenerational mobility." Economics Letters 158 (2017): 67-72.
Andrews, Rodney J., Jing Li, and Michael F. Lovenheim. "Quantile treatment effects of college quality on earnings." Journal of Human Resources 51.1 (2016): 200-238.
Black, Sandy, Jeff Denning, Lisa Dettling, and Sarena Goodman "Taking it to the Limit: Effects of Increased Student Loan Availability on Liquidity Constrained Students," (2020). NBER working paper 27658.
Clotfelter, C. T., Ladd, H. F., Muschkin, C. G., & Vigdor, J. L. (2013). Success in community college: Do institutions differ?. Research in Higher Education, 54, 805-824.
Denning, Jeffrey T., Benjamin M. Marx, and Lesley J. Turner. "ProPelled: The effects of grants on graduation, earnings, and welfare." American Economic Journal: Applied Economics 11.3 (2019): 193-224.
Evans, W. N., Kearney, M. S., Perry, B., & Sullivan, J. X. (2020). Increasing community college completion rates among low‐income students: Evidence from a randomized controlled trial evaluation of a case‐management intervention. Journal of Policy Analysis and Management, 39(4), 930-965.
Flores-Lagunes, Alfonso, and Audrey Light. "Interpreting degree effects in the returns to education." Journal of Human Resources 45.2 (2010): 439-467.
Hendricks, Lutz, and Oksana Leukhina. "The return to college: selection and dropout risk." International Economic Review 59.3 (2018): 1077-1102.
Kahn, Lisa B. "The long-term labor market consequences of graduating from college in a bad economy." Labour economics 17.2 (2010): 303-316.
Miller, Kevin and Shai Akabas. "Which Colleges are Worth the Cost?: Institution-Level Return on Investment for Students and Taxpayers" Bipartisan Policy Center. February (2022).
Oreopoulos, Philip. "Nudging and Shoving Students toward Success: What the research shows about the promise and limitations of behavioral science in education." Education Next 21.2 (2021): 8-16.
Scott-Clayton, Judith. "What accounts for gaps in student loan default, and what happens after." Brookings Institution (2018).
Toutkoushian, Robert K., M. Najeeb Shafiq, and Michael J. Trivette. "Accounting for risk of non-completion in private and social rates of return to higher education." journal of education finance (2013): 73-95.
Webber, Douglas A. "The lifetime earnings premia of different majors: Correcting for selection based on cognitive, noncognitive, and unobserved factors." Labour economics 28 (2014): 14-23.
Webber, Douglas A. "Are college costs worth it? How ability, major, and debt affect the returns to schooling." Economics of Education Review 53 (2016): 296-310.
1. https://www.wsj.com/articles/americans-are-losing-faith-in-college-education-wsj-norc-poll-finds-3a836ce1 Return to text
2. Beyond the risk of non-completion, the returns to education are influenced by many factors, including: major (Webber, 2014; Altonji and Zimmerman, 2018), institution attended (Cooper, 2021; Miller and Akabas, 2022), location (Andrews et. al, 2017) macroeconomic factors such as the point in the business cycle in which one leaves school (Kahn, 2010) or personal characteristics such as race or familial wealth (Addo, Houle, and Simon, 2016; Scott-Clayton, 2018; Addo and Darity, 2021). Return to text
3. Measuring graduation in two-year schools is difficult due to a variety of data limitations, most notably associated with students transferring (Clotfelter et. al, 2013). Return to text
4. For a detailed analysis of the financial status of student loan borrowers during the pandemic, see the SHED reports for 2020–2022 (Federal Reserve Board - Survey of Household Economics and Decisionmaking). Return to text
5. U.S. Dept. of Education, College Scorecard, https://collegescorecard.ed.gov/data/ Return to text
6. The sample for this coefficient was enlarged to include non-borrowers in order to avoid perfect collinearity. They are provided to give the reader a general sense of how BA attainment relates to financial well-being in order to contextualize the non-completion coefficients. However, to the extent that borrowers and non-borrowers may receive different boosts to financial well-being the comparison is imperfect. Return to text
7. While the evidence presented in this note is correlational, it is in line with quasi-experimental evidence such as Black et al. (2020). Return to text
8. Prior to the pandemic, roughly 15% of borrowers in the federal student loan portfolio were in default on their student loans. https://studentaid.gov/data-center/student/portfolio Return to text
Lockwood, Jacob, and Douglas Webber (2023). "Non-Completion, Student Debt, and Financial Well-Being: Evidence from the Survey of Household Economics and Decisionmaking," FEDS Notes. Washington: Board of Governors of the Federal Reserve System, August 21, 2023, https://doi.org/10.17016/2380-7172.3371.
Disclaimer: FEDS Notes are articles in which Board staff offer their own views and present analysis on a range of topics in economics and finance. These articles are shorter and less technically oriented than FEDS Working Papers and IFDP papers.